The economic gains of closing the employment gender gap - Evidence from Morocco WIDER Working Paper 2021/79
←
→
Page content transcription
If your browser does not render page correctly, please read the page content below
WIDER Working Paper 2021/79

The economic gains of closing the employment
gender gap

Evidence from Morocco

Olivier Bargain1 and Maria C. Lo Bue2

May 2021
Abstract: The present paper sheds new light on the growth implications of gender inequalities in
the Moroccan labour market. We confront two different approaches. The first one is based on
firm data to estimate gender complementarity in production and uses this information for
simulations based on a simple macroeconomic model. The second relies on country panel variation
to relate growth to the relative employment of women and, also, suggest simulations for Morocco.
Both approaches lead to similar conclusions regarding the potential economic gains from increased
female participation in this country. This paper is one of the rare attempts to elicit the growth
potential of a reduction in the employment gap in a low-income country.
Key words: Morocco, female labour force participation, gender employment gap, growth,
aggregate production function, constant elasticity of substitution, firm data
JEL classification: E23, J16, J24, O41
Acknowledgements: We are grateful to the teams at UN Women Morocco and the Department
of Studies and Financial Forecasts, Department of Economic Studies and Financial Forecast, and
the Centre of Excellence for Gender Budgeting under the Ministry of Economy and Finance and
Administrative Reform of Morocco that helped make this working paper and the release of the
corresponding report on ‘Economic Costs of Gender Inequalities in the Labour Market in
Morroco’ possible. We are particularly grateful for the contributions from Ragbi Bouameur and
Zineb Bouba (Ministry of Economy, Finance and Administrative Reform of Morocco), Sofie
Lambert, Sacha Belleclot, and Hasna Boulasri (UN Women Morocco) and to the French
Development Agency who has supported the preparation of the report. Bargain is also grateful to
UNU-WIDER for the support to the realization of this working paper. Usual disclaimers apply.

1 Bordeaux   University, Bordeaux, France, corresponding author: olivier.bargain@u-bordeaux.fr; 2 UNU-WIDER
This study has been prepared within the UNU-WIDER project Women’s work – routes to economic and social empowerment.
Copyright © UNU-WIDER 2021
UNU-WIDER employs a fair use policy for reasonable reproduction of UNU-WIDER copyrighted content—such as the
reproduction of a table or a figure, and/or text not exceeding 400 words—with due acknowledgement of the original source,
without requiring explicit permission from the copyright holder.
Information and requests: publications@wider.unu.edu
ISSN 1798-7237 ISBN 978-92-9267-017-7
https://doi.org/10.35188/UNU-WIDER/2021/017-7
Typescript prepared by Mary Lukkonen.
United Nations University World Institute for Development Economics Research provides economic analysis and policy advice
with the aim of promoting sustainable and equitable development. The Institute began operations in 1985 in Helsinki, Finland, as
the first research and training centre of the United Nations University. Today it is a unique blend of think tank, research institute,
and UN agency—providing a range of services from policy advice to governments as well as freely available original research.
The Institute is funded through income from an endowment fund with additional contributions to its work programme from
Finland, Sweden, and the United Kingdom as well as earmarked contributions for specific projects from a variety of donors.
Katajanokanlaituri 6 B, 00160 Helsinki, Finland
The views expressed in this paper are those of the author(s), and do not necessarily reflect the views of the Institute or the United
Nations University, nor the programme/project donors.
1       Introduction

In prominent theories about the long-term relationship between economic development and female
labour force participation, countries in their late development stages are supposed to mature into mod-
ern economies where fertility rates decline, female education rates increase, and female employment
expands, notably in the service sector (Goldin 1990, 1995). Empirical evidence is somewhat different
(Gaddis and Klasen 2014; Klasen 2018). While substantial progress has been achieved around the world
in narrowing gender gaps in education, health, and political representation, it is not necessarily matched
by similar improvements in labour market outcomes for women. Women still tend to occupy the worst-
paid jobs or are more likely to be unpaid for their work in family enterprises. They often cumulate
occupations that do not bring a sense of autonomy and caring tasks. This situation is all the more wor-
rying as attitudes towards gender are persistent and continue to hinder access to better opportunities for
women in many countries (Giuliano 2018). This is a serious concern for fairness, gender equity, and the
implications of low autonomy on women’s and children’s well-being.

More recently, efficient arguments have been put forward to militate in favour of policies that could
improve women’s position in the labour market. In particular, there is an increasing field of research
pointing to the detrimental effect of gender employment gaps on the overall productivity and growth
potential of emerging economies (Klasen and Lamanna 2009). Many reasons have been invoked to
explain it. Women’s labour may provide a competitive advantage in early development stages if it is
cheaper than men’s (Seguino 2000). Increasing women’s bargaining power at home makes them more
able to invest in health and education (Cavalcanti and Tavares 2016). More generally, the economy
may simply benefit from larger pools of workers and talents (Kan and Klasen 2018; Klasen 2018). The
macro-critical importance of this issue lies in the fact that increasing women’s participation in the labour
market is not only an issue of women’s economic empowerment but also a lever for generating higher
levels of production and growth for the benefit of all (World Bank 2004; Wodon and de la Brière 2018).
It is in this perspective of growth, and of well-being for a country as a whole, that the inclusive dimension
of growth can be considered (Lagarde and Ostry 2018).

The present paper attempts to contribute to this debate by shedding new light on the macro-criticality
of gender inequalities in the Moroccan labour market. With the lowest female participation rates in
the world, Middle East/North Africa (MENA) countries are badly in need of policies that could reduce
gender gaps in employment (Verme 2015)—and in this context, the potential gains in terms of macroeco-
nomic performances are possibly very large. We suggest such an investigation with the aim of analysing
and quantifying these economic gains. Morocco is an interesting case study for several reasons. First,
progress has been made in this country with the implementation of several reforms to promote gen-
der equality so that the political interest for enhanced women’s participation is strong (DEPF and OCP
2017). Despite recent political developments, however, gender employment gaps remain a problem in
Morocco.

Then, the availability of firm data allows us to conduct original estimations of the complementarity
between men’s and women’s labour in the labour market, interpreted as gender complementarity in
terms of productive traits. With these estimates, we suggest simple macroeconomic simulations of the
impact of a reduction in the gender gap on aggregate output. This approach has been suggested by Ostry
et al. (2018) who use different levels of analysis (i.e. country, sector, or firm variation) to estimate the
degree of substitutability between male and female labour. Firm data are rarely available for low-income
countries. For instance, Ostry et al.’s simulations for MENA countries hinge on estimations based on
firm data from China. A contribution of the present paper is therefore to provide new estimates for the
country of interest, making the paper one of the rare attempts to elicit the growth potential of a reduction
in the employment gap in the MENA context.

                                                     1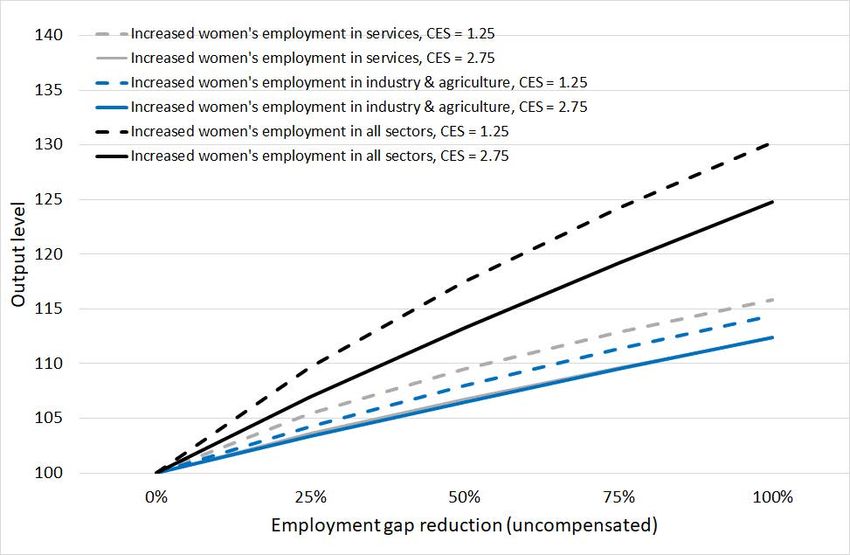
Finally, this micro-founded approach, which exploits firm data, can be compared to a more standard
method based on reduced-form macro estimates. Namely, we use panels of countries—either general
ones or limited to countries similar to Morocco—and relate their economic growth to temporal vari-
ations in key factors (e.g., openness, investment) and to the degree of gender inequality in access to
employment. Despite different temporalities and sources of variation, both approaches convey the same
qualitative results as well as similar magnitude of the gain from increasing female employment. A mod-
est reduction of one-quarter in the difference between men’s and women’s employment rates would be
enough to increase the gross domestic product (GDP) per capita by between 6 per cent and 13 per cent
(depending on the approaches and assumptions used). A complete reduction of the gap (i.e. a female
participation rate raised to 70 per cent and close to the most advanced countries) would correspond to a
gain in output between 22 per cent and 39 per cent. Even if these transformations took several decades,
they would still represent a very substantial contribution to future growth paths in this country. We end
the paper with a critical discussion of the methods used and paths for future research.

2         Female employment in Morocco

In this first section, we provide elements of context regarding women’s employment in Morocco and
MENA countries. They are based on Moroccan employment surveys and ILO data on employment.1

2.1       An international perspective

MENA countries, including Morocco, have some of the lowest female labour force participation rates
in the world (between 20 per cent and 30 per cent in 2019). Women’s employment is not only modest
compared with Western countries but also vis-à-vis the group of low- and middle-income countries (40
per cent in Asia or 55 per cent in Latin America and sub-Saharan Africa). In Morocco, the female
participation rate was 27.5 per cent in 2019 (against 76 per cent for men) according to International
Labour Organization (ILO) estimates. Not only is Morocco lagging behind global levels of female
labour force participation, but it is also showing the opposite trend, with a 24 per cent reduction in
labour force participation since 2000. This trend is only partially attributable to the economic situation
or other structural factors. Over the same period, the employment rate of men has declined by only 4
per cent.

1   See more detailed descriptive analyses in Bargain and Lo Bue (2021) and DEPF and OCP (2017).

                                                            2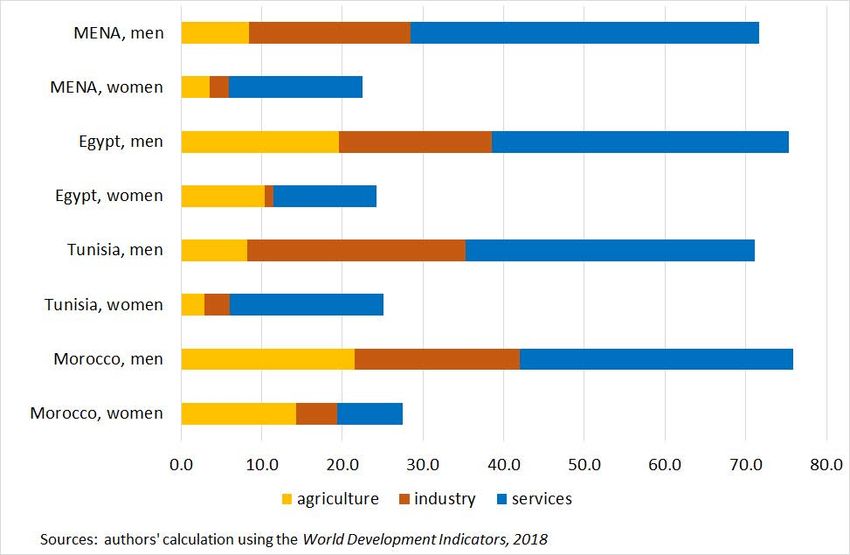
Figure 1: Women’s employment in selected MENA countries

Source: authors’calculation using the World Development Indicators (World Bank n.d.).

As seen in Figure 1, Moroccan women are mostly employed in agriculture, while men are predominantly
employed in the service sector. This sectoral distribution contrasts with that of other countries in the
region. For women, the share of services is higher in neighbor countries, such as Tunisia or Egypt, or
on average in the MENA region. Thus, Morocco combines both a low participation rate for women and
a low representation in services (only 8.1 per cent of the working-age female population is employed
in services compared with 34 per cent for men). Figure 2 additionally shows that the proportion of
women in industry has declined over two decades—mainly because of a decreasing share in the textile
industry—but was not compensated by an equivalent increase in the service sector. If we distinguish
by background, the employment rate of women in urban areas is only 14.5 per cent. Their activity rate
is 18.5 per cent, the difference representing the impact of unemployment, which is high among women
compared to men in the urban environment and therefore symptomatic of women’s difficult access to
formal jobs.2 The employment rate is higher in rural areas and close to the activity rate (around 26–27
per cent).

2 Nevertheless, the issue of unemployment can be seen as a second-order problem compared to the fact that the vast majority
of women are not declared as active, even though many of them can and surely want to work.

                                                             3
Figure 2: Proportion of women in industrial employment

Source: authors’calculation using Morocco National Employment Surveys 2000–19 (HCP n.d.).

2.2      Explanatory factors

There is no single explanation for the low participation of women in the labour market but rather a
set of complementary obstacles: gender norms, the legal framework, the structure of the economy,
the structure of the labour market, and human capital. These factors influence both labour supply and
demand. The supply of labour is affected by social and labour market norms that can severely restrict
career opportunities, particularly caused by the difficulty of reconciling work and family constraints.
These constraints associated with difficult working conditions for women (the arduous nature of some
agricultural or industrial jobs) and wage discrimination can also lead to discouragement for those who
would like to take up paid employment, which confers economic autonomy. Low human capital may
contribute to this discouragement. On the labour demand side, female labour can be seen as additional
labour in the household in times of financial hardship but, under normal circumstances, be constrained
by hiring discrimination (priority given to men in many types of occupations), women’s lower education
levels (although the gaps have narrowed in recent years in Morocco), or a systematic lack of matching
their qualifications with available jobs.

Recent analyses based on the Moroccan Census (General Population and Housing Census) and Employ-
ment surveys confirm the presence of these different factors. In particular, DEPF and OCP (2017) and
Bargain and Lo Bue (2021) point to the role of demographic factors, such as marriage and the socio-
economic status of the spouse, that significantly determine women’s economic participation. Family
constraints, related to marital status and the number of children, appear to be significant barriers to
women’s decision to enter the labour market and influence women’s role as additional workers to a
large extent. Higher education qualification guarantees women a probability of employment close to
European levels and in sectors such as services, administration, and, more generally, in jobs with higher
levels of pay and societal recognition. In international comparison, Morocco is located at the bottom
of the U in the U-shaped relationship between women’s employment levels and GDP per capita (Verme
2015). The rising part of the curve is based on a combination of factors related to declining fertility
and rising education—two factors for which Morocco appears to be well on track (see Bargain and Lo
Bue 2021)—but also on a societal evolution and economic transformation that should leave a growing
place for women, which is not yet the case in MENA countries. The concern is all the stronger as
Morocco appears well below the bottom part of the U. A set of factors means that the female labour

                                                          4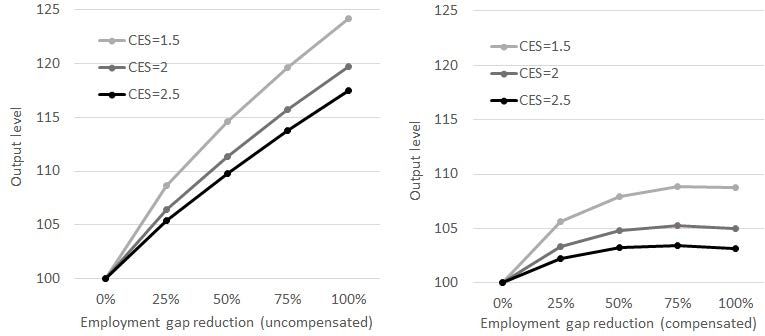
force participation rate in Morocco is much lower than it should be at its level of development.3 These
include social norms (women’s traditional place in society), a relatively slow pace of structural transfor-
mation of the economy, and the lack of expansion in sectors that have proved essential to the expansion
of female employment in other countries, such as manufacturing and services. Given the complexity
and multi-dimensionality of this question, the present study suggests only a modest attempt to illustrate
the potential gains that could derive from changing these different factors and promote and implement
higher rates of women’s participation in the different sectors of the economy.

3        Micro-estimates of gender complementarity in employment and macroeconomic simula-
         tions

We start with simulations based on a simple macroeconomic framework and original estimates of the
complementarity between men’s and women’s labour force. The notion explored by Ostry et al. (2018)
and others (e.g., Acemoglu and Lyle 2004; Pellizzari, Paccagnella, and De Giorgi 2014) is that women
bring different skills and ideas to the economy, so reducing the participation gaps between women and
men is likely to generate significant economic gains. This effect is assumed to work through two mech-
anisms: gender diversity (increasing the gender mix of the labour force) and job reallocation (within and
across sectors). We focus on the first mechanism.4 The potential importance of the economic gains of
a more mixed labour force has been highlighted in the literature, particularly the advantage of gender
diversity but also ethnic and cultural diversity (Alesina and La Ferrara 2005). For gender, the idea is
that women bring new skills, different attitudes towards risk, different social preferences or attitudes
towards a competitive environment and modes of cooperation, and different responses to incentives and
modes of socialization (Alesina and La Ferrara 2005). Therefore, beyond the benefits resulting from
simply having more workers, increasing female participation in the labour market should also increase
the diversity of production factors and thus increase output more strongly than an equivalent increase in
male employment.

3.1      Context

The economic literature has proposed various extensions to the basic macroeconomic model where a
diversity of productive factors is introduced. In particular, a distinction is made between skilled and
unskilled work in order to explain the evolution of wage inequality between the two groups (Katz and
Murphy 1992; Card and Lemieux 2001). Most of these extensions are based on the estimation of a
constant elasticity of substitution (CES) as in the present study. With respect to gender, several papers
attempt to estimate the elasticity of substitution between male and female workers using natural experi-
ments. Acemoglu and Lyle (2004) exploit the American mobilization of World War II, which attracted
a large number of women to the labour market. The variation in the mobilization rate across states is
used as an instrument to explain the relative supply of female labour. Pellizzari, Paccagnella, and De
Giorgi (2014) use the variation between Italian provinces from 1993 to 2006 regarding the phasing out

3 If one considers the average international relationship between female employment and three development indices (GDP
per capita, fertility, and education level) and applies it to Morocco, then the female labour force participation rate should be
between 15–20 percentage points higher than it is (Bargain and Lo Bue 2021). This discrepancy is all the more worrisome
because the level of female employment has stagnated or even declined over the last two decades, as discussed above.
4 The second mechanism concerns the positive aspects of sectoral reallocation. As households become wealthier during the
process of economic development, the demand for services increases and labour is reallocated to this growing sector. The
argument then proceeds on the assumption that services are more egalitarian in terms of employment than other sectors so
that developing economies become mechanically more inclusive (i.e. tertiarization leads to more gender balance in the labour
market). Barriers to female labour market participation, including fiscal distortions, discrimination, and social and cultural
factors, can slow this process and reduce the overall welfare gain.

                                                               5
of military service. These approaches are more causal than the ones based on temporal and spatial varia-
tion (countries, sectors, firms), as in Ostry et al. (2018) or the present study. Unfortunately, there are no
events and corresponding data that could be mobilized for Morocco. Moreover, the articles cited above
focus on rich countries (the United States and Italy) for which wages are measurable for all workers.
In this case, the first-order condition of the firm’s optimal programme leads to equality between wages
and marginal labour output, which provides a direct way to estimate the CES. Some authors also refrain
from using this equality when the assumption that firms pay workers their marginal output is not sus-
tainable (non-competitive markets) or is inconsistent with wage discrimination against women (Altonji
and Blank 1999).
3.2 Framework
As in Ostry et al. (2018), we start with a very simple framework in line with classical growth models
(Solow 1956). A production function is suggested in which one distinguishes between male and female
labour. Denote total production by Y and assume a Cobb-Douglas technology:
Y = AK 1−α Lα (1)
with A being the total factor productivity, K the capital factor, L the labour factor, and α the share of
employment in total output. Labour is specified as a composite factor comprising female employment
F and male employment M according to a CES:
L = (δ F ρ + M ρ )1/ρ . (2)
The elasticity of substitution σ = 1/(1 − ρ) represents the degree of substitutability between women’s
employment and men’s employment as factors of production. It ranges from 0 (ρ → −∞, perfect com-
plementarity) to +∞ (ρ → 1, perfect substitution).
The marginal products of male and female labour are
dY F ρ−1 dY M ρ−1
= αδY ρ and = αY ρ , (3)
dF L dM L
dY dY F −1/σ
respectively. Their ratio is written dF / dM = δ ( M ) , and the marginal product of women is higher
F 1/σ
than that of men as long as δ > ( M ) . This condition requires a high relative productivity of women
δ , a low F/M ratio, and/or a low elasticity of substitution σ . In particular, a low elasticity means a high
complementarity between men’s and women’s work. In this case, the marginal product of additional
female employment is very high relative to that of additional male employment, and female labour
constitutes an important reserve for growth.
The term δ is often equated with female working time relative to male working time for those in em-
ployment. Using the Moroccan National Employment Surveys matching the same period as the firm
data (2007–19), we find δ = 0.85 for industry, i.e. the ratio of women’s working hours (about 43.9
hours/week) to men’s (51.8 hours/week). This is close to the productivity level δ = 0.83 retained in
Ostry et al. (2018). For this level of productivity and a reasonable elasticity value, σ = 2, the female
marginal product is higher than the male marginal product as long as F/M is less than 0.72, which is the
case in all sectors of activity in Morocco. In particular, the relative level of female employment F/M in
the industrial sector, around 42 per cent in 2019, guarantees that women’s marginal output is likely to
be higher than men’s, so the female labour force is an important source of growth.
3.3 Estimating gender complementarity in production
We estimate the CES using data from Moroccan firms of the industrial sector. The reason for this focus
on industry is twofold. On one hand, the economic literature has shown that estimates for a given sector
6are more accurate in characterizing the potential complementarity between men and women in the labour
market (see the discussion in Ostry et al. 2018); on the other hand, we take into account data limitations.
For Morocco, gender-differentiated activity data are available at the level of individual firms only for
industry.
Estimation method
Like Ostry et al. (2018), we opt for a direct estimation of the complete production function AK 1−α (δ F ρ +
M ρ )α/ρ , which we log-linearize to arrive at the following empirical model:
ρ ρ
lnYit = ln Ait + (1 − α) ln Kit + (α/ρ) ln(δ Fit + Mit ) + εit . (4)
The i index represents the unit of observation, which can be a country, sector, or, in our case, firm.
The t index represents the year (2007, 2013, or 2019 in our case). The identification of the coefficients
requires sufficient variation in the dependent variable (output) and the explanatory variables (capital,
female employment, male employment). Because the model is non-linear, we propose a maximum
likelihood (ML) estimation. In the end, estimating the CES simply requires observing the levels of the
four main variables while the total factor productivity Ait is simply treated as an additive term in equation
(3), which will vary with time and the characteristics of the unit of observation.5 As justified above, we
refrain from adopting alternative methods based on wages for the reasons already discussed and simply
because wages are not always observable in Morocco, especially for women who are often observed as
unpaid family workers.6
Data
We use three Enterprise Surveys on the investment climate and business competitiveness in Morocco
(World Bank 2007, 2013, 2019). They were collected by the World Bank in collaboration with the
Kingdom of Morocco and the High Commission for Planning (HCP).7 Available for the years 2007,
2013, and 2019, they cover the entire national territory and target all organized companies (i.e. those with
formal accounting records). In principle, they concern companies operating in the industry, construction,
trade, and services sectors and exclude the financial, agricultural, and informal sectors. However, a
5 Ostry et al. (2018) propose three alternative sources of information to obtain the values of Y, K, F, and M to estimate the
CES. First, they use variation across countries and over time, relying on the World Development Indicators (World Bank n.d.)
for female and male participation and the Penn World Table data (Feenstra et al. 2015) for production and capital stock. As
these authors acknowledge, the CES is not very precisely estimated in this case and leads to surprisingly low values, between
0.2 and 0.6 (which would be interpreted as an extreme complementarity between female and male labour). Their second
approach uses country, sectoral, and temporal variation. They use ECD Structural Analysis data for annual observations of
value added, total employment, and capital stocks for 17 sectors in OECD countries, as well as OECD Labour Force Survey
data for gender-disaggregated employment. The CES obtained is very high, but the estimate is also not very precise (confidence
interval between 2.5 and 12). They indicate that this lack of precision is probably linked to the heterogeneity between sectors
(the share of labour in relation to capital varies greatly: from 30 per cent for the most capital-intensive sectors to 70 per cent for
services such as restaurants or the textile industry). This argument leads Ostry et al. to propose an estimate for a given sector
(services), which gives more precise results of around 1.83 (confidence interval of 0.9–3.8 ). The favourite approach relies
on annual surveys for industrial production in China as used in other firm-level productivity studies (e.g., Hsieh and Klenow
2009). The results are consistent with those obtained with the previous method, as the authors obtain a CES of 1.84, and with
even more precision (confidence interval of 1.2–2.89 for the main model).
6 This approach works as follows. Total employment can be rewritten as L = ((d F F)ρ + (d M M)ρ )1/ρ where female and male
productivity terms d k , for k = F, M, now appear symmetrically. The first-order conditions of profit maximization for the firm
ρ−1
lead to equality between wages and marginal production of labour: wk = α(d k )ρY kLρ , for k = F, M. By log-linearizing, we
obtain the expression:
log wF /wM = ρ log(d F /d M ) + (ρ − 1) log F/M,
which can be directly estimated using average wages and employment levels for men and women (e.g., at the level of firms,
sectors, or provinces; see Pellizzari, Paccagnella, and De Giorgi 2014, for example).
7 See for instance: https://microdata.worldbank.org/index.php/catalog/635
7limitation of the Enterprise Surveys is that gender-differentiated employment is only available at the
firm level for industry.8 We therefore focus on estimating the CES for industrial production. As noted
by Ostry et al. (2018), looking at a particular sector provides more reasonable and accurate estimates.9
The variables selected are as follows. For output (Y ), we use a measure of value added obtained as
the amount of annual sales minus the value of intermediate inputs. Two variables indicate the number
of women permanently employed on a full-time basis (production worker variable and management
variable) to measure the female employment factor (F). The same variables are available for the total
number of permanent full-time employees (F + M), from which we recover male employment (M). The
capital stock (K) is calculated as the net value, after depreciation, of the various assets (machinery, tools,
vehicles, and buildings).10
Estimates
Both time and inter-firm variation is used for identification. We perform three types of ML estimations.
In a basic model, the factor Ait varies only with year fixed effects, to account for time variation in factor
productivity. Then, a similar model is estimated where we remove the top and bottom 1 per cent of
the output distribution. Finally, a last model is estimated where Ait varies with the year and region of
observation of the firm. This eliminates some of the systematic differences caused by location because
manufacturing on the North Atlantic coast is not the same as in the interior regions.11
The estimates of the main coefficients, namely σ = 1/(1 − ρ) and α, are reported in Table 1. They vary
only a little across the three specifications. Estimates of α give a high share of labour in production,
around 88 per cent, which indicates the low capital intensity of the concerned industries, mainly food
and textiles. We obtain an elasticity of substitution around 2. This CES is precisely estimated, as the
95 per cent confidence interval is slightly tighter than in Ostry et al. (2018), namely between 1.6 and
2.4. Studies based on natural experiments also yield similar results, although comparison is not easy.
Acemoglu and Lyle (2004) find a (long-term) elasticity of substitution between 2 and 3 for their entire
sample. Pellizzari, Paccagnella, and De Giorgi (2014) find imperfect substitution between female and
male labour factors, with an elasticity between 1.0 and 1.4, close to the commonly accepted CES values
between high-skilled and low-skilled workers.12
8 The strata for Enterprise Surveys are firm size, business sector, and geographic region within a country. Firm size levels are
5–19 (small), 20–99 (medium), and 100+ employees (large-sized firms). These firms represent 31 per cent, 38 per cent, and 31
per cent of the total Moroccan sample, respectively. Sector breakdown is usually manufacturing, retail, and other services.
9 Note that secondary activities account for 30 per cent of GDP, compared to 14 per cent for agriculture and 56 per cent for
services. Industry accounts for 22 per cent of total employment against 38 per cent for agriculture and 40 per cent for services.
Within the overall industrial production of Morocco, food processing represents 30 per cent in 2019, textiles 11 per cent, and
the rest includes mechanical, metal, and electrical (29 per cent); other manufacturing industries (17 per cent); and chemicals
and parachemicals (14 per cent).
10 All monetary variables are deflated to express levels in volume, using an index provided by the HCP.
11 Unfortunately, the Enterprise Surveys are not panels, which would have made it possible to take into account a firm fixed
effect and obtain a more causal relationship between the level of production and the level of factors.
12 Note, however, that the results of these studies are not very precise and vary greatly with age (e.g., in Acemoglu and Lyle,
the CES increases to 5 for a subsample of 25–34 year olds) or model specification (weak instrument econometric problem in
Pellizzari, Paccagnella, and De Giorgi).
8Table 1: CES estimations
Structural estimates (1) (2) (3)
Constant elast. of substitution σ 1.934*** 1.977*** 2.026***
(0.1625) (0.1493) (0.3821)
Labour share α 0.888 0.886 0.886
(0.0190) (0.0125) (0.0146)
Log-likelihood -1,517.42 -1,433.76 -1,428.21
No. of observations 791 774 774
Trimming extreme percentile No Yes Yes
TFP varying with: time time time ×region
Note: TFP = total factor productivity. Robust standard errors in parentheses. * p < 0.1, ** p < 0.05, *** p < 0.01.
Source: authors’ estimations using the Enterprise Surveys (World Bank 2007, 2013, 2019).
3.4 Simulations
The analysis eventually aims to assess the effect of reducing female underemployment on economic
performance and how this reduction could exceed an equivalent increase in male employment. We
begin by looking in detail at the relative level of female activity in the different branches of industrial
production in Morocco. From the National Employment Surveys (HCP n.d.), we calculate the proportion
of women, F/(F + M), in the total workforce in each branch, as previously reported in Figure 2. Women
are in the majority in textiles, but their share declines over time. Their proportion is more stable in the
other subsectors, around 30 per cent in food processing and 10 per cent in other manufacturing industries.
In total in industry (excluding mining), the share of female labour is 30 per cent.
We then proceed with the simulation of alternative production levels for counterfactual scenarios where
the activity gap between men and women is gradually closed. Thus, we can quantify the impact of a
potential increase in women’s activity on aggregate industrial production. These simulations are carried
out using the empirical model of equation (3): the production level Y is calculated for the estimated
values of parameters A and α, for δ set at 0.85, and for different CES levels around its estimate. The
simulations start from an initial situation based on observed values of F and M, whereby total output is
normalized at Y = 100. In the first graph of Figure 3, we represent the level of output Y for different
scenarios corresponding to a reduction in the gender employment gap whereby increases in female
employment are uncompensated, i.e. male employment does not vary. The results are presented for three
CES values, namely 1.5, 2, and 2.5, surrounding the point estimate and all reflecting a certain degree of
complementarity. It can be seen that the increase in female employment leads to a significant increase
in industrial GDP. In the first scenario, reducing the F-M gap by 25 per cent consists of increasing F by
10 points and F/M from 42 per cent to 57 per cent. This leads to an increase in industrial GDP of 5 per
cent to 9 per cent across values of the CES. Reducing the employment gap by 50 per cent brings F to
50 per cent and F/M to 71 per cent while it would increase industrial GDP by 10–15 per cent. Closing
the gap completely leads to an increase in industrial GDP of 17–24 per cent. These effects reflect the
mechanical impact of an increase in the level of employment in general. However, the important point
is that they are higher than what would be obtained with an equivalent increase in male employment, at
least as long as the marginal product of women is higher than that of men.
9Figure 3: Impact of increasing female employment on industrial output
Source: authors’ simulations using the Enterprise Surveys (World Bank 2007, 2013, 2019) and the Morocco National
Employment Survey 2019 (HCP n.d.).
In the second graph, we propose a similar exercise, but this time with increases in female employment
offset by equivalent decreases in male employment, i.e. total labour input F + M does not change. We
can thus capture the effect of a substitution between female and male work, which should in itself be
a source of growth as long as the marginal product of women is higher than that of men. This is true
as long as F/M is less than (0.85)σ = 0.78 (resp. 0.72, 0.67) for σ = 1.5 (resp. 2, 2.5). This explains
the bell shape of the curves and the more pronounced concavity for higher values of the CES. Industrial
GDP increases for modest substitution between female and male labour. In the first scenario, the F-M
gap is decreased by 25 per cent, and the increase in F is compensated by an equivalent decrease in M.
This leads to an increase in GDP of 2 per cent to 6 per cent depending on the CES value. For a halving
of the F-M gap, the positive impact on output is between 3 per cent and 8 per cent. This impact then
declines as the marginal product of female labour becomes smaller than the male’s.
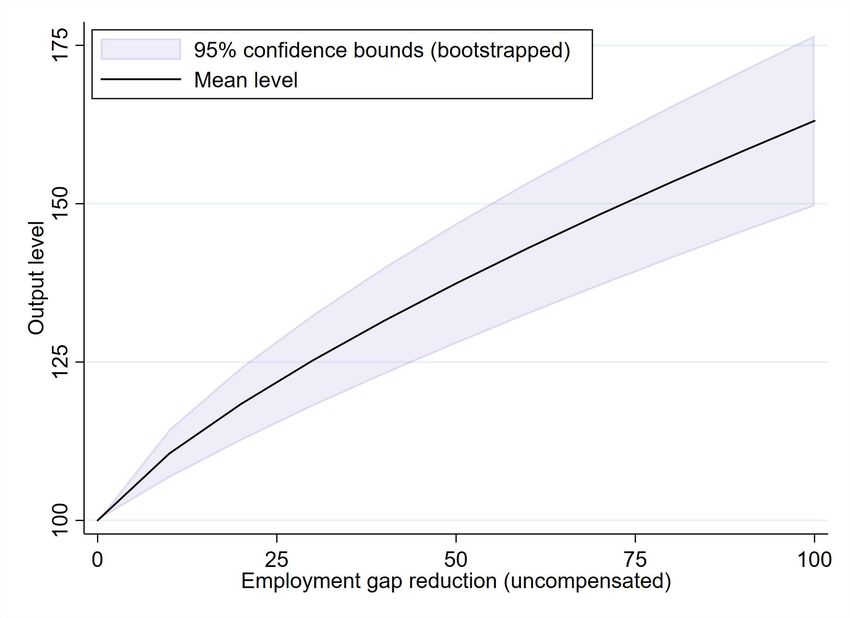
Finally, in Figure 4, we report the effect of uncompensated increases in female employment using a
slightly different strategy. Rather than using mean and extreme values of the CES, we bootstrap all the
coefficients of the model. The confidence bound is naturally larger in this case than when using only
the variability in the CES as we did in the first graph of Figure 3. Nonetheless, we see that the mean
effect is slightly larger and, most importantly, that similar conclusions are reached: the output gain is
also significantly positive. In particular, when the employment gap is reduced by one-quarter, the GDP
per capita increases by 7–17 per cent. When the employment gap is closed completely, it increases by
25–45 per cent.
10Figure 4: Impact of increasing female employment on industrial output (bootstrap)
Source: authors’ simulations using the Enterprise Surveys (World Bank 2007, 2013, 2019) and the Morocco National
Employment Survey 2019 (HCP n.d.).
3.5 Simulations based on a multi-sector model
To simulate a broader impact from increasing female employment in all sectors, we adopt the more
general multi-sector model suggested and calibrated by Ostry et al. (2018). This model is designed to
distinguish between non-market production (domestic work), market production in the service sector,
and market production of goods (industrial and agricultural sectors).13 As before, men’s and women’s
work are complementary in production according to a CES function. The model allows for the number
of women employed in different sectors to be driven by both the presence of barriers—capturing dis-
crimination, cultural differences, social norms, and so on, which can affect either labour demand and/or
supply—and the presence of potential differences in productivity across sectors. Because we extend
to other sectors than the industry, we opt for a broader confidence interval for the sensivity analysis,
namely between 1.25 and 2.75. The complete implementation of the model is explained in detail by
Ostry et al. (2018). Parameters of the utility function are calibrated or taken from reference studies.14
The calibration of other parameters is based on key variables (male and female employment levels, in
total and by major sector, as provided in the World Development Indicators), under the assumptions that
barriers to female employment, modelled as a wedge on female wages, can be normalized to zero in the
most gender-equal country in the data.
Simulations are conducted as before. A reduction of the gender employment gap in the industry leads
to similar results as what we have encountered above. We also simulate a change in different sectors or
in all sectors simultaneously. Results are presented in Figure 5. They point to large effects on GDP per
13 One of the objectives of the model could have been to simulate the effect of a sectoral reallocation of women’s employment
from traditional activities (such as agriculture) to the service sector, often thought of as a more egalitarian sector in terms of the
distribution of the female labour force relative to the male labour force (Weinberg 2000; Borghans, Ter Weel, and Weinberg
2014). This is not the case in Morocco, however. The services sector is marked by very strong gender inequalities in terms of
access to employment. Thus, at least in the short term, the tertiarization of the economy is not synonymous with a mechanical
increase in female employment.
14 The weighting parameter on goods (as opposed to services) is chosen by Ostry et al. (2018) as 1 minus the long-term share
of consumption of services. For the elasticity of substitution between domestic and market consumption of goods (other than
services), the estimate is taken from Ngai and Petrongolo (2017).
11capita. Closing the employment gap by one-quarter in the tertiary sector or industry/agriculture leads to
an overall increase in GDP of around 4–5 per cent. A similar change in all sectors simultaneously leads
to an increase in output of 7–10 per cent. Canceling the gender gap in all sectors leads to an increase in
GDP of about 25–30 per cent.
Figure 5: Impact of increasing female employment on total output
Source: authors’ simulations using the World Development Indicators (World Bank n.d.).
4 Macroeconomic simulations based on reduced-form country panel estimates
We propose an alternative analysis, which takes a longer-term perspective. The relationship between
macroeconomic performances and the gender employment gap is estimated using time and country
variation. Such an analysis has been proposed by Klasen (2002) and Klasen and Lamanna (2009) to
assess the effect of gender gaps in employment and education. Their approach was also in line with
estimates of endogenous long-panel growth models, which aimed to quantify the role of different long-
term determinants of growth (Barro 1991; Barro and Sala-i-Martin 1995; Mankiw, Roemer, and Weil
1992). Compared to the previous section, the approach is based on a reduced form model, as used by
Mankiw, Roemer, and Weil (1992) to test Solow’s model. The empirical model is then set at the actual
values for Morocco in order to simulate the long-term impact of a reduction in the gender employment
gap on growth—in general or with a view of Morocco catching up with other countries or geographical
areas.
4.1 Context
There is a limited number of empirical studies looking at the impact of gender differences in employ-
ment or wages on economic growth.15 Klasen (1999) finds that increases in women’s labour force
participation are associated with higher growth in international comparisons. Two studies, Cavalcanti
and Tavares (2016) and Cuberes and Teignier (2016), estimate the cost to economic growth of discrim-
ination in access to employment. Cavalcanti and Tavares focus on wage gaps, indicating that a 50 per
15 There is more abundant literature documenting the fact that gender disparities in education reduce economic growth. King
and Hill (1993) and Knowles, Lorgelly, and Owen (2002) use Solow’s growth model framework and find that gender differences
in education have a large and statistically significant negative effect on the level of GDP. Dollar and Gatti (1999), Forbes (2000),
Appiah and McMahon (2002), and Klasen (2002) also find a negative impact of gender gaps in education on future economic
growth (a review of the literature is proposed by Minasyan et al. [2017]). They find that the results of Barro and Lee (1994),
showing a negative effect of women’s education on economic growth, do not stand up to in-depth econometric examination.
12cent increase in the wage gap in favour of men reduces per capita income by 35 per cent in the long
run. The authors argue that their results explain the differences in economic growth between the United
States and countries such as India, Saudi Arabia, and Egypt. Cuberes and Teignier find that restrictions
on women’s employment lead to an aggregate income loss of 27 per cent in the Middle East and MENA
countries and 19 per cent in South Asia. If we use their country-by-country extrapolations, the loss
of per capita income caused by gender differences in labour market participation would be 33 per cent
for Morocco in the long run (and more than 40 per cent for the countries with the lowest initial female
labour force participation rates in the MENA region), which is close to the higher bound of our previous
estimates. Klasen and Lamanna (2009) analyse country data over several decades and show that gender
gaps in labour force participation have a negative impact on economic growth.16 With their estimates,
we calculate that gender equality in terms of employment rates would lead to an increase in growth of
3.2 points per year in Morocco. Taking an average growth rate of 4 per cent per year for the 1990s, these
effects on growth correspond to a 52 per cent higher level of output per capita after a decade, which is
large but not inconsistent with the following results.
4.2 Country panel estimation
Data
For the macroeconomic panel estimation, we use a panel of countries drawn from World Development
Indicators (World Bank n.d.). Variables include GDP per capita, population size, labour force size,
education, and trade openness. We also mobilize the Penn World Tables (Feenstra et al. 2015) for the
level of investment (gross fixed capital formation) and ILO data for labour force participation (ratio
of female to male labour force participation rate and male labour force participation rate). We select
countries for which all the key variables are non-missing.
Adjustment, non-parametric relationship, and linear estimation
We adapt the framework of Klasen (2002) and Klasen and Lamanna (2009) to analyse the gender em-
ployment gap and the effect of its time variation on economic growth. Variables of interest are collapsed
by decades in order to use middle-term variation rather than yearly changes, which are more noisy. We
also note that the different macroeconomic variables used (e.g., GDP, population, employment) may
trend over the long run, creating artificial correlations between them. This problem can be reduced by
’detrending’ these variables, i.e. by purging them from a linear trend. In this step, we also eliminate the
country fixed effect, θi . For instance, for the GDP per capita, denoted Yit for country i and decade t, we
estimate the following linear equation:
lnYit = θi + ζ t + yit , (5)
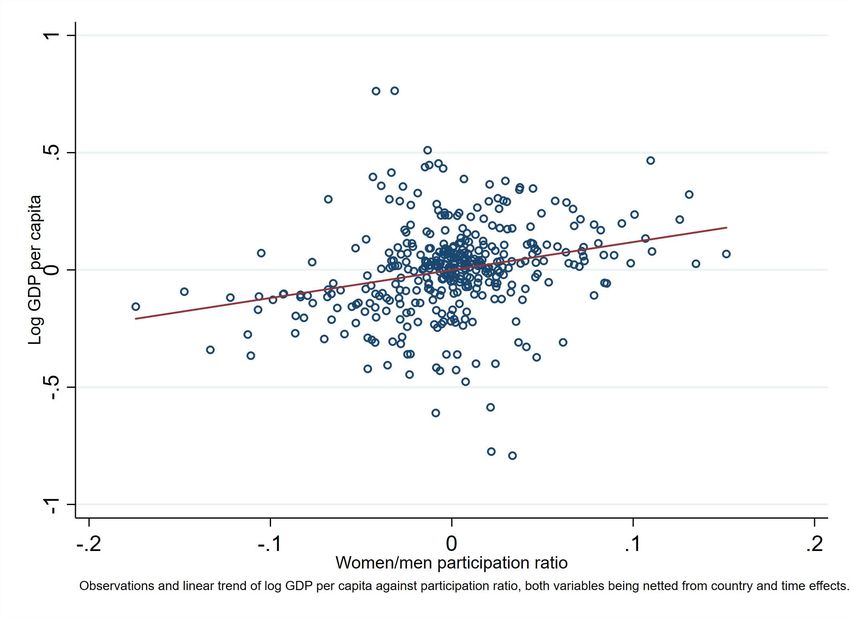
where the decades of observation t correspond to the years 1990, 2000, and 2010. In Figure 6, we
plot the estimated residual, yeit , i.e. the detrended variable purged from country fixed effects against the
gender employment ratio for 127 countries × 3 decades. The relationship is positive and the slope is
close to the estimates obtained hereafter.
16 Applying the results of this study to Europe, Klasen and Minasyan (2017) also found that differences in labour force partici-
pation rates impeded annual per capita income growth by 0.8 percentage points in Ireland in the 1980s and 1990s and in Spain
in the 1970s and 1980s. Cumulatively, these countries lost about 17 percentage points of economic growth over two decades
relative to the best performing countries (Scandinavian countries).
13Figure 6: Log GDP per capita against employment ratio (adjusted)
Note: observations and linear trend of log GDP per capita against participation ratio, both variables being netted from country
and time effects.
Source: authors’ estimations using the World Development Indicators (World Bank n.d.).
We then estimate the adjusted log GDP per capita on key variables as follows:
log yeit = η + β xeit + γ m
e it + ζ rl
e it + uit , (6)
with xeit being a set of (adjusted) determinants of growth (population, labour force, trade openness,
investments, average education level), me it the male participation rate, and rl
e it the relative employment
level of women (ratio of female to male participation rate).
Estimates
Baseline estimations for the period 1990–2018 are presented in Table 2 (column 1). Education levels,
trade openness, and investment levels are positively and significantly correlated with the level of output.
We focus on the ratio of female to male participation rates. Because the GDP per capita is expressed in
log, a change in any variable between two periods is interpreted as the percentage effect on the growth
rate. The coefficient ζ of the employment ratio is positive and statistically significant. This effect of
0.548 means that a change in the employment ratio of +1 is associated with a 54.8 per cent increase in
GDP per capita. Given that the female/male labour force participation ratio averaged about 0.34 over the
recent decade in Morocco (WID data), closing the gender gap entirely could increase GDP per capita by
39 per cent. This calculation is the basis of the simulations presented below. Note that similar results are
obtained when focusing on a subset of less advanced economies (Table 2, column 2). The point estimate
of the employment ratio is larger, but the standard error is also larger, as expected with this smaller panel
of countries.
14Table 2: Country panel estimation of the employment ratio on log GDP per capita
(1) (2)
Population growth -0.0165 0.00115
(0.0228) (0.0278)
Working age population growth -0.553 -2.456
(2.140) (2.726)
Average education level / 100 0.668** 0.952**
(0.288) (0.399)
Trade openness /100 0.419*** 0.297**
(0.103) (0.125)
Investment 0.539*** 0.675***
(0.160) (0.190)
Women/men participation ratio 0.548** 0.708**
(0.225) (0.295)
Male participation rate -1.793*** -1.123**
(0.445) (0.538)
Constant -0.0468** -0.0550**
(0.0219) (0.0255)
Observations 381 270
R-squared 0.249 0.233
Including advanced countries YES NO
Time and country effects YES YES
Note: estimation of GDP per capita for 127 countries in model 1, 90 less advanced countries in model 2, based on average
values by decades (1990s, 2000s, 2010s). R-squared are reported for estimations once time trends and country fixed effects
are netted out. * p < 0.1, ** p < 0.05, *** p < 0.01.
Source: authors’ estimations using the World Development Indicators (World Bank n.d.) and the Penn World Tables (Feenstra
et al. 2015).
4.3 Simulations
From the model estimates, we can produce a series of counterfactual simulations to analyse the impact
on growth of an increase in the relative employment rate of women. In particular, we propose to quantify
a reduction of k = 25, 50, 75, or 100 per cent in the female to male employment ratio as follows:
∆ 1 yeit = ζ (rl
e it + k(1 − rl
e it )). (7)
We also simulate the additional growth that would be obtained by adopting the relative female labour
force participation rate of other regions of the world, such as Latin America, for the most recent decade
available, T = 2010:
∆ 2 yeit = ζ (rl
e Am.Latine,T − rl
e Maroc,T ). (8)
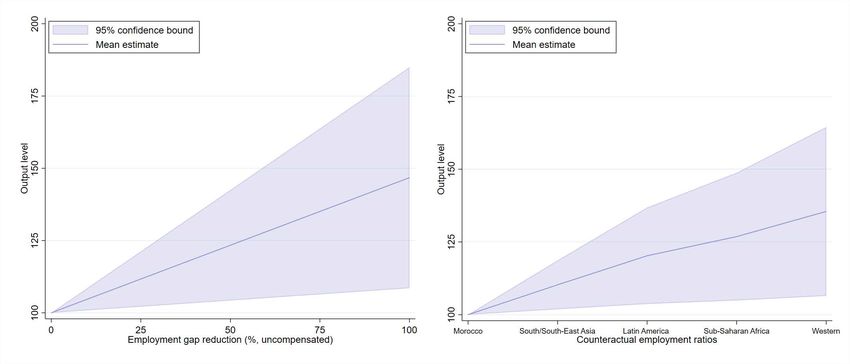
Results are presented in Figure 7. The first graph shows that reducing the gender gap in employment
by one-quarter is associated with an increase in GDP per capita of 10 per cent on average. A complete
closing of the gap leads to an output gain of almost 40 per cent. These effects are large but consistent
with our aforementioned quantifications based on the estimates of studies using similar approaches. In
particular, our results are in between the effects obtained with the estimates of Cuberes and Teignier
(2016) and Klasen and Lamanna (2009), respectively. Standard errors in our estimations are large,
however, and lead to a broad confidence interval of the output gain in Figure 7. The second graph reports
simulation results when the objective is the average gender gap in employment of different regions of
the world. The impact on macroeconomic performances is always positive and substantial when taking
Latin American countries or countries of sub-Saharan Africa as benchmarks.
15Figure 7: Impact of increasing female employment on total output
Source: authors’ elaboration using the World Development Indicators (World Bank n.d.).
5 Conclusion
This paper examines the potential impact of a higher female participation on macroeconomic perfor-
mances in Morocco. We mobilize two different approaches. In the first one, we simulate the effect of
reducing the gender employment gap on aggregate output by estimating on firm data the labour comple-
mentarity between men and women in the labour market. In the second, we use country panel estimations
to relate GDP per capita to a set of factors including the female to male employment ratio. Despite the
differences in implicit temporalities and sources of variation across these approaches, both lead to very
similar results for Morocco and convey that substantial gain in aggregate output are to be expected if the
gender employment gap is partially or fully closed.
There are several limitations to the approaches used in the paper, which should constitute the path to
further research. In the first set of simulations, we rely on simple models, which impose structural as-
sumptions, the fiction of a representative agent approach (Heathcote, Storesletten, and Violante 2009;
Jackson and Leeat 2017), and no account for dynamic aspects. Moreover, the male-female complemen-
tarity we estimate is described as complementarity in productive traits, which raises several questions.
First, this type of complementarity is assumed but not demonstrated.17 Second, some of the gender
differences underlying this complementarity, if it exists, are not necessarily desirable. Rather, some of
these elements tend to disadvantage women by ’sanctioning’ behaviours linked to excessive risk aver-
sion, lack of professional ambition, or taste for competition, for example, which are cited as being part
of the obstacles to women’s economic participation and career (e.g., Heilman and Parks-Stamm 2007).
Third, the degree of complementarity revealed by the CES estimatation may well reflect differences in
productive endowments between men and women, such as differences in education and training levels.
Even if the education gap has been reduced lately in Morocco, differences in skills or educational attain-
17 Croson and Gneezy (2009), Azmat and Petrongolo (2014), and Eswaran (2014) review experimental studies showing
differences—non-systematic—in risk preferences, social preferences, and competitive preferences between men and women,
while Abrevaya and Hamermesh (2012) find no significant differences in actual behaviour, and Sent and van Staveren (2019)
point to the importance of context. Men have been shown to perform better in competitive environments (Gneezy, Niederle, and
Rustichini 2003; Gneezy and Rustichini 2004), although Lavy (2013) has recently challenged this view. Women appear to be
more altruistic (Eckel and Grossman 1998; Andreoni and Vesterlund 2001), more risk-averse (Borghans et al. 2009), and less
comfortable with competition (Harbaugh, Krause, and Liday 2002) and time pressure (Shurchkov 2012; Azmat, Calsamiglia,
and Iriberri 2016).
16ment may explain the degree of complementarity found in our estimates (just as other studies measure
the complementarity of skilled and unskilled labour in the production function). In this case, our source
of growth—here and in Ostry et al (2018)—would itself be rooted in gender inequalities, notably the
discrimination in access to training and education, and would therefore not necessarily correspond to
desirable growth strategy.
In the second set of analyses, the estimates are subject to the risk of reverse causality, which is a strong
limitation of our exercise. It may be that it is economic growth that attracts women to the labour market.
In estimations based on a country panel, it is difficult to establish causality in the desired direction, as
previously noticed by Gaddis and Klasen (2014) and others. Exogenous variation in the female par-
ticipation rate would be necessary, which is not easy to obtain because instruments are either rare or
unconvincing. The problem is also discussed in studies using sub-national variation. For example,
Esteve-Volart (2004) exploits variation between states in India (state fixed effects panel) with instru-
mental variables. In our framework, we can simply hope that the reverse causality explains only a little
of the correlation between growth and women’s relative employment, the overall impact of growth on
activity being partly taken into account by male employment in the estimation.
References
Abrevaya, J., and D. S. Hamermesh (2012): ‘Charity and Favoritism in the Field: Are Female Economists Nicer (to
Each Other)?’ Review of Economics and Statistics, 94(1): 202–7. https://doi.org/10.1162/REST_a_00163
Acemoglu, D.D.H., and D. Lyle (2004). ‘Women, War, and Wages: The Effect of Female Labor Supply on the
Wage Structure at Midcentury’. Journal of Political Economy, 112(3): 497–551. https://doi.org/10.1086/
383100
Alesina, A., and E. La Ferrara (2005). ‘Ethnic Diversity and Economic Performance’. Journal of Economic Liter-
ature, 43(3): 762–800. https://doi.org/10.1257/002205105774431243
Altonji, J.G., and R.M. Blank (1999). ‘Race and Gender in the Labor Market’. Handbook of Labor Economics,
3: 3143–259. https://doi.org/10.1016/S1573-4463(99)30039-0
Andreoni, J., and L. Vesterlund (2001). ‘Which Is the Fair Sex? Gender Differences in Altruism’. The Quarterly
Journal of Economics, 116(1): 293–312. https://doi.org/10.1162/003355301556419
Appiah, E.N., and W.W. McMahon (2002). ‘The Social Outcomes of Education and Feedbacks on Growth in
Africa’. Journal of Development Studies, 38(4): 27–68. https://doi.org/10.1080/00220380412331322411
Azmat, G., C. Calsamiglia, and N. Iriberri (2016). ‘Gender Differences in Response to Big Stakes’. Journal of
the European Economic Association, 14 (6): 1372–400. https://doi.org/10.1111/jeea.12180
Azmat, G., and B. Petrongolo (2014). ‘Gender and the Labor Market: What Have We Learned from Field and Lab
Experiments?’ Labour Economics, 30: 32–40. https://doi.org/10.1016/j.labeco.2014.06.005
Bargain, O., and M. Lo Bue (2021). Coûts Économiques des Inégalités de genre dans le Marché du Travail
au Maroc. Commissioned by ONU Femmes Maroc and Centre d’Excellence pour la Budgétisation Sen-
sible au Genre (CE-BSG). Rabat: Direction des Études et des Prévisions Financières (DEPF) and ONU
Femmes Maroc. Available at: https://morocco.unwomen.org/fr/ressources-medias/publications/2021/02/
couts-economiques-inegalites-genre-travail-maroc (accessed March 2021).
Barro, R. (1991). ‘Economic Growth in a Cross-Section of Countries’. Quarterly Journal of Economics, 106(2):
407–43. https://doi.org/10.2307/2937943=
Barro, R., and J. Lee (1994). “Sources of Economic Growth’. Carnegie-Rochester Series on Public Policy, 40:
1–46. https://doi.org/10.1016/0167-2231(94)90002-7
Barro, R., and X. Sala-i-Martin (1995). Economic Growth. New York: McGraw-Hill. https://doi.org/10.3386/
w5326
Borghans, L., B.H.H. Golsteyn, J.J. Heckman, and H. Meijers (2009). ‘Gender Differences in Risk Aversion and
Ambiguity Aversion’. Journal of the European Economic Association, 7(2–3): 649–58.
Borghans, L., B. Ter Weel, and B.A. Weinberg (2014). ‘People Skills and the Labor-Market Outcomes of Under-
represented Groups’. ILR Review, 67(2): 287–334. https://doi.org/10.1177/001979391406700202
Card, D., and T. Lemieux (2001). ‘Can Falling Supply Explain the Rising Return to College for Younger Men? A
Cohort-Based Analysis’. Quarterly Journal of Economics, 116(2): 705–46. https://doi.org/10.3386/w7655
17You can also read