UFOP Report on Global Market Supply 2019/2020 - European and world demand for biomass for the purpose of biofuel production in relation to supply ...
←
→
Page content transcription
If your browser does not render page correctly, please read the page content below
UNION ZUR FÖRDERUNG VON OEL- UND PROTEINPFLANZEN E.V.

     UFOP Report on
   Global Market Supply
        2019/2020
     European and world demand for biomass for the
    purpose of biofuel production in relation to supply in
              the food and feedstuff markets
                       WWW.UFOP.DE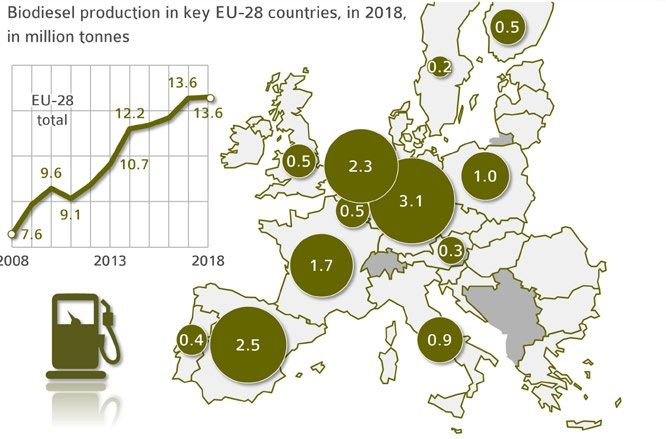
Sustainable intensification of arable farming ensures
food security and climate protection

The Green Deal starts on the land.
The impact of climate change is tangible in many regions of the world, above all in agriculture.        requirements to add biofuels to fuel blends. European policy clearly does not recognise that
Securing supplies of sustainably produced food and renewable feedstocks for material and                internationally binding provisions on a level playing field could be created through the statutory
energetic use is therefore the central challenge and prospect for agriculture. This is UFOP’s           sustainability requirements enshrined in the Renewable Energy Directive - RED II (2018/2001/
conception of a sustainable bioeconomy. Biofuels are the most important value-added option              EU) concerning market access to the European Union for biomass feedstocks and biofuels.
and exemplify the requisite additional options for deployment.
                                                                                                        European agriculture instead finds itself observing as the future of renewable feedstock
A key to sustainable farming lies in accelerating utilization of technological advances in breeding,    cultivation unfolds elsewhere. As a result, Europe is missing out on an opportunity to define
crop protection and digitisation of agricultural production. Funding policy should foster               sustainability requirements vis-à-vis third countries based on statutory provisions.
development of innovations, focusing in particular on maintaining or seeking leadership in export
technology development.                                                                                 Cultivation of oilseeds in the EU is particularly affected because it is also the most important
                                                                                                        non-GM source of protein for animal nutrition. Conversely, large quantities of soya and thus the
The FAO estimates that global grain production (including rice) will reach a new peak of 2.6            corresponding “cultivated areas” are also imported. EU guidelines for calculating the greenhouse
billion tonnes in 2019. On the other hand, in many regions, despite low producer prices, scant          gas balance of feedstocks do not take account of this “substitution effect”, which is unfortunate
purchasing power gives rise to pronounced pressure on supply and prices. In the light of global         as this could boost the competitiveness of biomass feedstocks and biofuels produced in the EU.
harvest volumes, sufficient food supplies can be secured, even with simultaneous biofuel
production from these feedstocks. This is clearly demonstrated in the 4th updated edition of this       Agricultural policy still needs to demonstrate that it can combine the imperatives of economically
UFOP report.                                                                                            viable and sustainable cultivation with appropriate policy on agricultural markets and climate
                                                                                                        protection, as well as opening up sales prospects, inter alia on fuel markets. In this context,
Large harvests and stockpiles in many regions of the world compensate for shortfalls elsewhere.         ambitious sustainability requirements must be factored in, while also ensuring implementation of
Yields are rising in North and South America thanks to technical progress, and in Asia as a             these, in particular in third countries. On this issue in particular, UFOP is counting on the Green
result of replanting with new palm oil varieties but also due to new plantations established in         Deal announced by the new EU Commission and expects policy to be adjusted accordingly.
the wake of deforestation. The report considers legal issues concerning the compatibility of
this phenomenon with international sustainability targets for feedstocks to be counted towards          I am therefore curious to see how the German arable farming strategy will be designed against
quotas for the European biofuel market. The fundamental problem: sustainability is not reflected        the backdrop of these market policy conditions and also setting effective economic incentives
in prices paid to producers.                                                                            for the cultivation practice.

Low or falling prices for cereals, oilseeds, sugar and vegetable oils are caused by global oversupply
in terms of purchasing power. At this price level, sustainable agriculture is impossible, even in
rural regions of Africa. Seen in this light, arable farming is living on its reserves economically.

The European Union did not succeed in adequately integrating this potential into its climate
protection policy when amending the Renewable Energy Directive (RED II). On the contrary,               » Wolfgang Vogel
production of renewable feedstocks from cultivated biomass will be gradually reduced, yet               UFOP Chairman
sales prospects in new markets are not identified in parallel. What remains is a permanent price
pressure recognizable by the negative income trend in agricultural sector.

In contrast, governments from the world’s leading agricultural nations in North and South
America, as well as in Asia, are promoting energetic use of cultivated biomass as part of their
national agricultural, energy and climate protection policies. This becomes apparent in increasing

2    Foreword                                                                                                                                                                              Foreword       3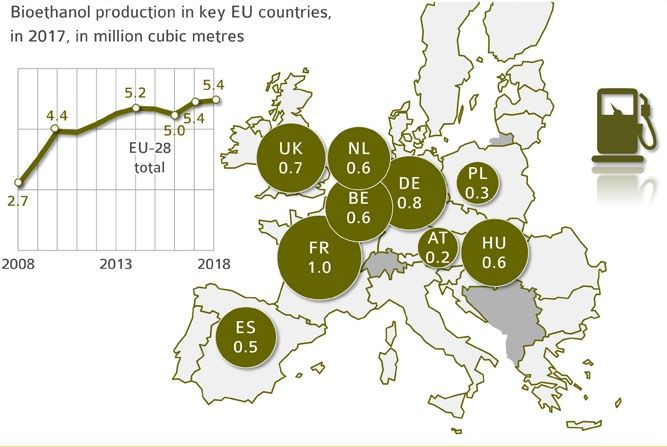
Table of Contents

» 1 Feedstock supply                                                                 » 3 Food security
    1.1 How much grain is produced on a global scale?                                  3.1 Is there sufficient rapeseed in Germany?
        1.1.1 Global grain production                                                      3.1.1 German rapeseed production and level of self-sufficiency
        1.1.2 Global stocks of grains                                                              3.1.1.1 Output of rapeseed meal with and without biodiesel fuel production
        1.1.3 Global grain supply                                                      3.2 Why is demand for oilseeds increasing?
    1.2 How much oilseed and vegetable oil is produced on a global scale?                  3.2.1 Global meat consumption
        1.2.1 Global oilseed production                                                    3.2.2 Blending quotas for biodiesel
               1.2.1.1 Composition of oilseed crops                                   3.3 What is the amount of grain and vegetable oil per person?
        1.2.2 Global vegetable oil production                                              3.3.1 Per capita supply of grain and vegetable oil
               1.2.2.1 Price developement of vegetable oils                           3.4 Is there enough food?
        1.2.3 Global oilseed supply                                                        3.4.1 Use of feedstocks in biofuels production
               1.2.3.1 Global vegetable oil supply                                    3.5 Why do people starve?
    1.3 How much oilseed and grain including rice does each continent produce?             3.5.1 The issue of distribution
        1.3.1 Production of grain                                                          3.5.2 Battle for water
        1.3.2 Production of oilseeds                                                       3.5.3 Food availability and climate change
    1.4 What products are made from grain?
        1.4.1 Global use of grains
    1.5 What products are made from oilseeds?                                        » 4 Use of land
        1.5.1 Global use of oilseeds
               1.5.1.1 Global production of oils and meals                            4.1 Does growing energy crops create a lack of land for food crops?
                                                                                           4.1.1 Shares of land used for global biofuels production
                                                                                           4.1.2 Development of cropland
                                                                                       4.2 Is there a limit to the use of palm oil?
» 2 Production of biofuels                                                                 4.2.1 Global use of palm oil
    2.1 Which countries promote biofuels?
        2.1.1 Global output of bioethanol
               2.1.1.1 Key EU-28 bioethanol producers                               » 5 Development of prices
        2.1.2 Global output of biodiesel
               2.1.2.1 Key EU-28 biodiesel producers                                  5.1 Do biofuels push food prices up?
    2.2 What feedstocks are used in world biofuels production?                             5.1.1 Comparison of prices of bread and grain
        2.2.1 Global resource bases for biodiesel                                          5.1.2 Comparison of prices of bioethanol and grain
    2.3 What feedstocks are used in European biodiesel fuel production?                           5.1.2.1 Comparison of prices of biodiesel and vegetable oil
        2.3.1 Resource bases for biodiesel in the EU-28                              » 6 Statistics
    2.4 What feedstocks are used in the production of biodiesel used in Germany?       6.1 Note on handling statistics
        2.4.1 Shares of feedstock in biodiesel consumed                                    6.1.1 Pitfalls of statistics
        2.4.2 Greenhouse gas savings
    2.5 Where do the feedstocks for biodiesel at German petrol stations come from?
        2.5.1 Origins of feedstocks for biodiesel used in Germany
                                                                                                                     Editorial department, charts and descriptions:
                                                                                                                     Agricultural Market Information Company (AMI)
                                                                                                                     Department plant production
                                                                                                                     In Charge: Wienke von Schenck
                                                                                                                     www.ami-informiert.de
                                                                                                                     Copyright for all charts: AMI GmbH

4     Table of Contents                                                                                                                                     Table of Contents    5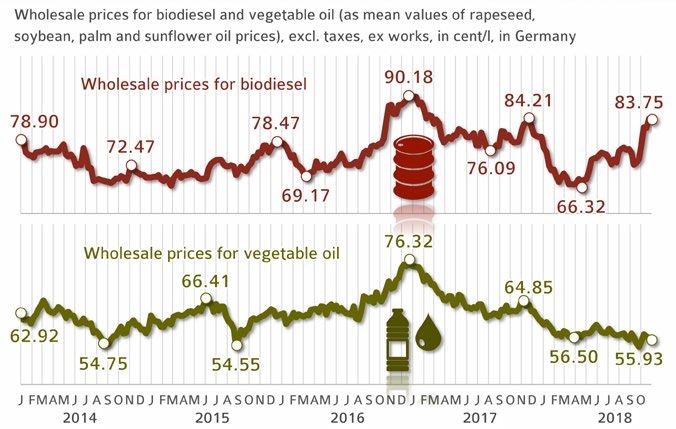
1.1 How much grain is produced on a global scale?
                             » 1.1.1 Global grain production
                             Poor weather conditions occurring both in the northern and southern hemisphere affected
                             global grain production. This especially applies to wheat (-4.2 per cent) and maize (-2.2 per
                             cent). Since these are the world‘s most important kinds of grain, their decline is reflected in the
                             figures for overall grain production. Although production fell short of the previous year‘s
                             by 2.1 per cent, it remained at a level of more than 2.6 billion tonnes. In general, as a
                             result of progress in plant breeding, expansions in overall area and improvement of agricultural
                             production practices (fertiliser applications, pest and disease control, reduced losses at harvest
                             and in storage), world grain production has continuously increased over the past decades. Since
                             1971/72 harvest amounts have tripled (maize) or doubled (wheat and rice). Bumper crops in
                             many production regions have led to oversupply on the markets. Maize is the number one grain,
                             underlining its globally growing importance for supply to the feed sector and (US) bioethanol
                             production. Like maize, barley is mainly used as livestock feed. On the other hand, rice and
                             wheat are predominantly consumed in human diets.

                               Global grain production remains at more than 2.6 billions tonnes

        1 Feedstock supply
                                                                                                             © AMI 2018 | Source: FAO

6   Feedstock supply                                                                                    Feedstock supply           7
1.1 How much grain is produced on a global scale?                                                          1.1 How much grain is produced on a global scale?
» 1.1.2 Global stocks of grains                                                                            » 1.1.3 Global grain supply
Due to significant harvest increases in grain cultivation, world grain stocks have grown                   The ratio of supplies to consumption (also called the stock-to-use ratio) is a key figure in
considerably. In most marketing years, production of wheat and coarse grains exceeded                      estimating supply and, consequently, potential price trends. The decline in grain production in
consumption. These stocks that are left at the end of a marketing year are the ending stocks               2018/19 and the slight rise in consumption lead to a decrease in global ending stocks, with the
that, as beginning stocks, ensure supply at the beginning of the following marketing year.                 result that the stock-to-use ratio will drop. Nevertheless, supply of wheat and coarse grains, at
                                                                                                           35 per cent and 25 per cent respectively of the amounts harvested, is set to remain exceptionally
Based on smaller harvests of wheat and coarse grains (maize, barley and rye) caused by poor                good. This will deter a rise in producer prices right into the following marketing year. To sum up,
weather and the increase in consumption on a global scale, stocks are expected to decline from             from the perspective of farmers grain prices remain too low.
their highest level of 643 million tonnes to 585 million tonnes by the end of the 2018/19 marketing
year. In other words, 2018/19 output will not be sufficient to cover global demand. Although
this will be at the expense of supplies and lead to a drop in stocks of wheat (-4.7 per
cent) and especially coarse grains (-12.3 per cent), overall supply will remain safe with                    Supply and demand estimate based on the stock-to-use ratio
a large surplus into the next crop.
                                                                                                                                                                                          © AMI 2018 | Source: FAO

    Large stocks serve as buffer for small harvest amounts
                                                                                © AMI 2018 | Source: FAO

8     Feedstock supply                                                                                                                                                                Feedstock supply          9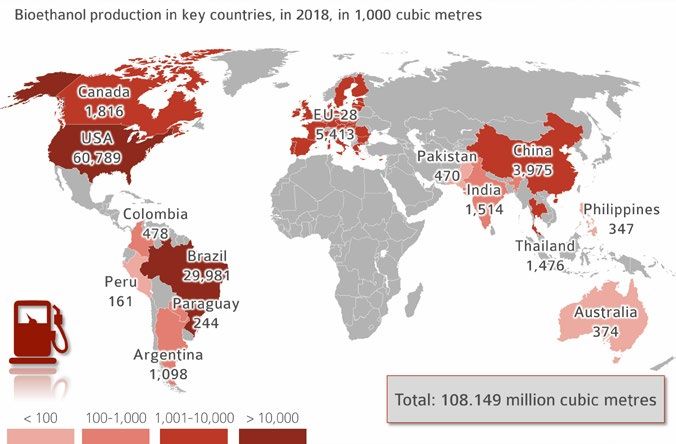
1.2 How much oilseed and vegetable oil is produced                                                         1.2 How much oilseed and vegetable oil is produced
    on a global scale?                                                                                         on a global scale?
» 1.2.1 Global oilseed production                                                                          » 1.2.1 Global oilseed production
In the marketing year 2018/19, production of oilseeds is likely to hit almost 600 million tonnes,              1.2.1.1 Composition of oilseed crops
the largest quantity ever. Global rise in demand for high-quality feed protein has been a key
driver of North and South American soybean production for years now and is the main
reason for the expansion in cultivation area. On a global scale, soybean is the number one
oilseed crop, accounting for more than 60 per cent of world oilseed production.                             Sunflowers have the highest oil content

Oilseed crops differ in oil and protein content as well as fatty acid composition and protein
                                                                                                                                                       © AMI 2018 | Source: Handbuch der Lebensmitteltechnologie
quality, along with their climate and soil requirements. These factors have a determining
influence on the price of the oilseed crop in question. This especially applies to protein quality,
because soybean is also the most valuable source of protein in terms of quality. For this
reason, rapeseed breeders are working intensively on improving the protein quality
of rapeseed.

  Soybeans are the world‘s no. 1 oilseed crop
                                                                                © AMI 2018 | Source: FAO

10   Feedstock supply                                                                                                                                                            Feedstock supply 11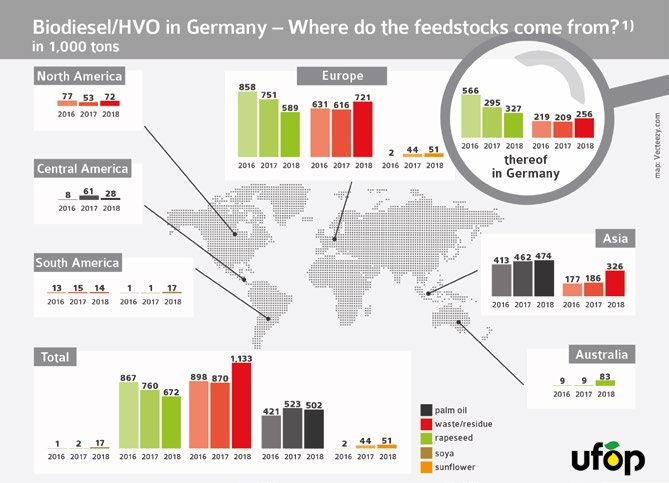
1.2 How much oilseed and vegetable oil is produced                                                    1.2 How much oilseed and vegetable oil is produced
    on a global scale?                                                                                    on a global scale?
» 1.2.2 Global vegetable oil production                                                               » 1.2.2 Global vegetable oil production
Output of vegetable oil increased rapidly over the past decades. Production of vegetable oil              1.2.2.1 Price development of vegetable oils
from the eight key oil-yielding crops amounted to approximately 203 million tonnes in the
2018/19 marketing year. This was more than twice the amount at the turn of the millennium.
Together, palm and soybean oil, the world‘s most important oilseed crops, account for 63.5
per cent of global production. Rapeseed oil occupies third place, accounting for almost 14 per         The price gap between oilseed rape and palm oil is the largest since 10 years
cent, followed by sunflower oil with just over 9 per cent of world output. Vegetable oils are
                                                                                                                                                                      © AMI 2018 | Source: USDA
not only used in human diets, but also as a feedstock for transport fuel production and
other industrial purposes, such as soaps, surfactants for use in detergent production,
operating supplies such as lubricating and hydraulic oils, release agents for industrial
uses or base substance for cosmetic products.

  Palm oil strengthens its top position
                                                                          © AMI 2018 | Source: USDA

12   Feedstock supply                                                                                                                                              Feedstock supply 13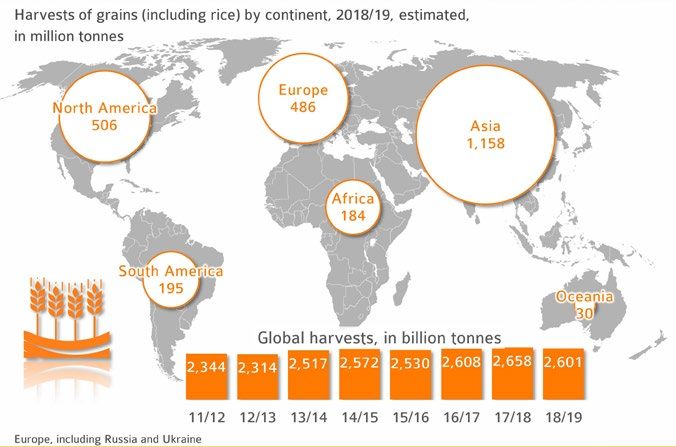
1.2 How much oilseed and vegetable oil is produced                                                        1.2 How much oilseed and vegetable oil is produced
    on a global scale?                                                                                        on a global scale?
» 1.2.3 Global oilseed supply                                                                             » 1.2.3 Global oilseed supply
The ratio of supplies to consumption (also called the stock-to-use ratio) is a key figure in                  1.2.3.1 Global vegetable oil supply
estimating supply and, consequently, potential price trends. The stock-to-use ratio for rapeseed
and sunflowerseed has been in decline for years now. If demand for rapeseed oil for EU biodiesel
production were to continue to decline, this trend would intensify, especially in the case of
rapeseed. The picture is somewhat different for soybeans. Bumper crops are causing supply                  Rapeseed oil in strong demand
and stocks to rise significantly. However, there is also a steady growth in demand for soy protein
                                                                                                                                                               © AMI 2018 | Source: USDA
for animal feed, very especially in China. Due to the positive development of the economy and
income in the world‘s most populous country, purchasing power is increasing and so is demand
for meat and, consequently, oilseed meals to feed the growing numbers of livestock. China‘s
growth in demand for soy coincides with bumper crops in the US and Brazil in 2018/19. This
correlation generates dynamic changes in price. However, the dynamics are weakened
given the good supply to the market.

  Tight supply of rapeseed and sunflower seed
                                                                              © AMI 2018 | Source: USDA

14   Feedstock supply                                                                                                                                     Feedstock supply 15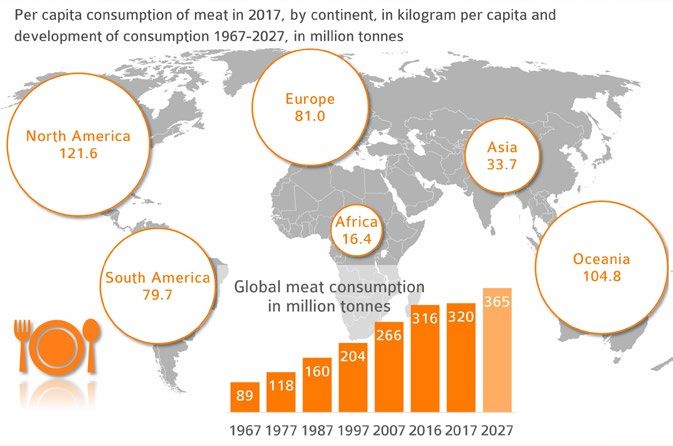
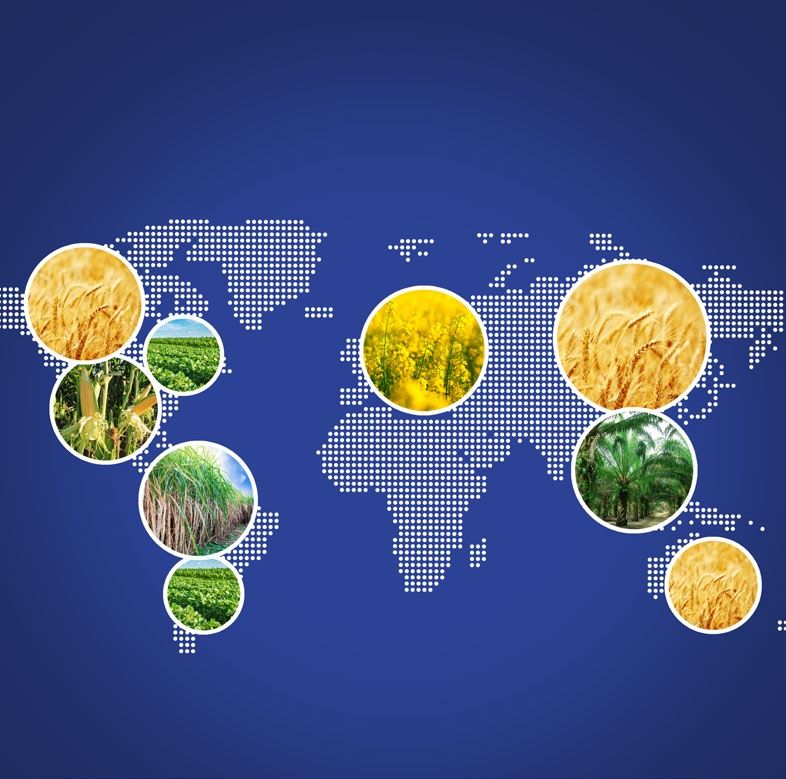
1.3 How much oilseed and grain (including rice)                                                          1.3 How much oilseed and grain (including rice)
    does each continent produce?                                                                             does each continent produce?
» 1.3.1 Production of grain                                                                              » 1.3.2 Production of oilseeds
2018/19 world production of grain (including rice) is set to be slightly lower than it was in the        The output of oilseeds is growing rapidly. The Food and Agriculture Organization FAO estimates
record year of 2017/18. The larger global maize harvest cannot offset the decline in wheat and           global production in 2018/19 at 616 million tonnes. This is up 5 per cent year-on-year and just
barley. The harvest was smaller especially in Europe. The Food and Agriculture Organization              over 50 per cent from 10 years ago. The increase is primarily based on growth of output
FAO forecast is for around 2.6 billion tonnes globally. The majority, around 45 per cent, is             in North and South America (expansion of area planted) and Asia. The world‘s most
produced in Asia. The main reason is that Asia is the home of rice production. China is the main         important oilseed and palm oil producing regions are more evenly distributed than
country of origin for grain and rice. North America holds second position, headed by the US              grain-producing areas are. The difference is not so much in output as in crops grown: whereas
with more than 448 million tonnes. Whereas marketing grain globally is vital for the economy             soybean is the most important oilseed crop in South America and the US, rapeseed prevails in
of countries like the US or Canada, China hardly offers any of its grain on the world market. The        Canada and the EU-28 due to climatic conditions. In eastern Europe sunflowers predominate.
country produces most of its agricultural feedstock to cover domestic demand and also needs              Asian countries such as China and India produce large amounts of both rapeseed and soybeans.
extensive imports.                                                                                       On the other hand, oil palm is the primary oilseed crop in Malaysia and Indonesia.

                                                                                                         The US was the world‘s biggest soybean producer in 2018/19, ahead of Brazil. Canada headed
                                                                                                         for the first time the list of rapeseed producing countries, just ahead of the EU-28. And the
  Asia is the largest grain producer                                                                     Ukraine harvested the largest quantity of sunflowers.
                                                                              © AMI 2018 | Source: FAO

                                                                                                          Oilseed harvests growing steadily
                                                                                                                                                                                     © AMI 2018 | Source: FAO

16   Feedstock supply                                                                                                                                                            Feedstock supply 17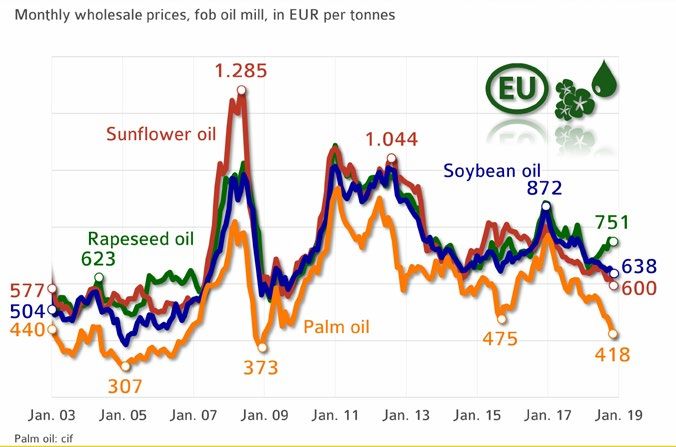
1.4 What products are made from grain?                                                                        1.5 What products are made from oilseeds?
» 1.4.1 Global use of grains                                                                                  » 1.5.1 Global use of oilseeds
Global production of grains (excluding rice) in the 2018/19 marketing year amounted to an estimated           Oilseeds grown worldwide are pressed to make vegetable oils, generating extraction meal and
2 billion tonnes. The produce is intended for human consumption, but also used as a livestock feed            oilseed cake as joint products of pressing. Vegetable oil can be gained by various chemical and
and feedstock in bioethanol production. At 47 per cent, the largest part of the grain harvest goes            physical methods. Before being pressed, the feedstock is heated to increase oil yield. The meal
into feeding troughs, trending upward (up 3 percentage points from the previous year). Although               that remains after pressing is used as a high-protein feed. Consequently, the largest part of the
demand for grain for use in transport fuel production has increased slightly, it accounts for less than       oilseeds – around 60 per cent – goes into feeding troughs and the smaller proportion – around
one tenth of total consumption, the International Grain Council (IGC) has reported. This means that           31 per cent – is used as food. Soybean meal is the number one feed in terms of quantity, with
there is enough grain to meet the growing demand for food and feed.                                           global output amounting to 236 million tonnes. It is followed by rapeseed, which has a share of
                                                                                                              around 36 million tonnes in global protein supply. Farmers in the EU-28 only produce GM-
In the US, bioethanol is mostly made from maize. The process generates Dried Distillers Grains                free rapeseed. Consequently, rapeseed is by far the most important GM-free source of
with Solubles (DDGS), which is used as a protein feed. One tonne of wheat that is processed into              protein for animal feeding. Therefore, EU-rapeseed meal reduces the corresponding
bioethanol produces on average 295 kg of DDGS with a moisture content of 10 per cent. One                     need for soybean imports and the acreage of land that would otherwise be required for
tonne of maize yields 309 kg of DDGS. When grain prices are high, processing is the first activity            soy cultivation. On that note, the EU Commission explicitly acknowledges the importance of
to go down, before farmers begin to save on feed. The high added-value potential in the food                  EU-rapeseed production as the primary domestic source of protein. Output of sunflower meal,
markets ensures that grain mostly goes into the production of food when grain prices                          at 21 million tonnes, is ten times lower than that of soybean meal. Production of oil is much more
are high. The biofuels market serves as a “supply buffer” that ensures grain is constantly                    important with this crop. Any meal produced is also used as animal feed.
available for human consumption and feed.

                                                                                                                Most oilseeds also destined for animal feed
 Grain is mainly used for feed production
                                                                                                                                                                                    © AMI 2018 | Source: USDA, Oil World
                                                                                   © AMI 2018 | Source: IGC

18   Feedstock supply                                                                                                                                                                    Feedstock supply 19
1.5 What products are made from oilseeds?
» 1.5.1 Global use of oilseeds
1.5.1.1 Global production of oils and meals
Practical dual use of oilseeds
© AMI 2018 | Source: Oil World
20 Feedstock supply Feedstock supply 212.1 Which countries promote biofuels?
» 2.1.1 Global output of bioethanol
Over recent years, more and more bioethanol plants have been built to save fossil-energy
sources and cut down on greenhouse gas emissions. Politics is a key factor in this by
defining blending quota requirements, which exercises a direct influence on the amount
of bioethanol produced. For example, in the US the blending rate was raised from 10 per
cent to 15 per cent after the rate of 10 per cent was actually reached. In China, official steps
taken to boost grain processing as a means of curbing local surpluses contributed to an increase
in bioethanol production. The consumption of grain and sugar for the global production of
bioethanol continues to grow, especially outside the US in China and South America. The use of
grain (especially maize) as a feedstock is expected to rise by 1.5 per cent to 172.4 million tonnes
in 2019/20. According to the FAO, global cereal production (including rice) will hit a new high of
2.60 billion tonnes.
Worldwide 108 (2017: 102.4) million m3 of bioethanol were produced in 2018. The main producers
are by far the US, where about 60.8 million m3 were produced in 2018, of which 98 per cent corn
and 2 per cent on other kinds of biomass. The second largest bioethanol-producing country is
2 Production of
Brazil with nearly 30 million m3 based on sugar from sugar cane. In EU-28, about 5.4 million m3
of bioethanol were produced from cereals and sugar beet in 2018.
biofuels Jumping increase in bioethanol production
© AMI 2019
Source: RAF, OECD, national Statistics
22 Feedstock supply Production of biofuels 232.1 Which countries promote biofuels? 2.1 Which countries promote biofuels?
» 2.1.1 Global output of bioethanol » 2.1.2 Global output of biodiesel
2.1.1.1 Key EU-28 bioethanol producers The single most important biodiesel producer is the European Union, which accounted for 34 per
cent of global output of 41 million tonnes in 2018. The term “biodiesel” is used in the statistics to
refer to biodiesel (FAME = fatty acid methyl ester), hydrogenated vegetable oil (HVO) and biofuels
made from vegetable oils in petroleum refineries. Whereas in Europe biodiesel is mainly based
France, Germany and Great Britain account for half of EU bioethanol output on rapeseed oil, soybean oil is the primary source on the American continent. Soybean oil is a by-
product of soybean meal production. It is used in biodiesel production in the wake of the steady
expansion of soybean area and soy processing to cover demand for soybean meal for animal
© AMI 2019
Source: FAS, national statistics feeding. The most important biodiesel producers are the EU-28, the US, Brazil and Argentina.
The Southeast Asian region has gained more and more importance in the biodiesel market. In
the key palm oil producing countries, Indonesia and Malaysia, biodiesel production is
on a steady increase, driven by increasing glut and the associated pressure on prices
in the vegetable oil markets. Contrary to the EU, these countries are raising their domestic
blending quota requirements (Indonesia: B20 / B30) to stabilise producer prices and to reduce
foreign exchange expenses on oil imports. For the second time, global output of vegetable oils
exceeds the level of 200 million tonnes in the 2019/2020 marketing year.
Above-average increase in biodiesel in the EU-28
© AMI 2019 | Source: FAS, Oil World
24 Production of biofuels Production of biofuels 252.1 Which countries promote biofuels? 2.2 What feedstocks are used in world biofuels production?
» 2.1.2 Global output of biodiesel » 2.2.1 Global resource bases for biodiesel
2.1.2.1 Key EU-28 biodiesel producers Production of biodiesel, and, consequently, the use of feedstocks has increased all over the
world. The percentages of feedstocks used remained virtually unchanged from 2017: 35 per
cent palm oil, 26 per cent soybean, 16 per cent rapeseed oil, 11 per cent used cooking fats, 7
per cent animal fats and 6 per cent other fats. Palm, soybean and rapeseed oil remained
Germany produces one fourth of EU biodiesel the most important feedstock sources. This will likely change in 2019, because prices
© AMI 2019 for individual feedstock vary quite considerably over 2018. Rapeseed oil is at a high level
Source: FAS
and cost on average EUR 96 per tonne more in September 2019 than in the previous year.
As a result, the gap to soybean, sunflower and palm oil has widened significantly. Biodiesel
production from soybean and palm oil is expected to increase in North and South America as
well as Southeast Asia. In the EU 28, the share of biodiesel from waste oils and fats is
expected to continue to increase at the expense of rapeseed oil. Rapeseed oil, however,
has the advantage of higher winter quality due to its fatty acid structure. In the winter months,
rapeseed oil is the raw material required if biodiesel is produced for the admixture.
Shares of palm oil and the total amount increased
© AMI 2019 | Source: Oil World
26 Production of biofuels Production of biofuels 272.3 What feedstocks are used in European biodiesel 2.4 What feedstocks go into the production of biodiesel
fuel production? used in Germany?
» 2.3.1 Resource bases for biodiesel in the EU-28 » 2.4.1 Shares of feedstock in biodiesel consumed
Availability and selling prices of vegetable and animal oils and fats have a determining influence In Germany in 2018, just over 2.32 million tonnes of biodiesel were used as a blending component
on the use of these commodities, including in biodiesel fuel production. Rapeseed oil is the in diesel fuel. This was up nearly 5 per cent year-on-year. This figure reflects the raised energy-
primary feedstock source for biodiesel production in the European Union, but its share related cap on greenhouse gas (GHG) emissions. The cap was raised from 3.5 per cent to 4 per
dwindles. In 2018 it fell to 41 per cent, from 48 per cent in 2016. On the other hand, the use cent in January 2017. The mineral oil companies bound by the regulations have geared their
of used cooking oil has increased dramatically as policy continues to promote its use. In the purchasing strategy to comply with the requirement in the most cost and greenhouse
EU, with the exception of Germany, biofuels from waste and residues count double towards gas-efficient manner. Providers of feedstock and biofuels compete for the lowest-cost GHG
national quota obligations (in terms of energy), the purpose being to increase the percentage of efficiency. The resulting shift to biofuels from used cooking oils became apparent in 2016 and has
renewable energy used in the transport sector to 10 per cent by 2020. This requirement is binding intensified since then: the quantity used increased by more than 30 percent in 2018 compared to
on all member states. By contrast, competition from low-price feedstocks from overseas did not the previous year. Therefore, the share of biodiesel from used edible oils is growing, while the
increase in 2018, remaining at 29 per cent. In countries such as Italy, Spain and the Netherlands, share of biodiesel from rapeseed oil has even decreased by 6 percentage points. This is a result
imported palm oil is the number one feedstock in biodiesel fuel production, whereas in Germany of the advantage these oils have when calculating greenhouse gas emission. These feedstocks,
and France, the prime feedstock is rapeseed oil. However, it must be noted that the statistical as waste, are accounted for at a „zero“ CO2 greenhouse gas value, whereas vegetable oils
basis for the share of feedstock is very different depending on the “source” and cannot are accounted for at the GHG value resulting from their production. The transition to the
be adopted uncritically. The new version of the Renewable Energies Directive (2018/2001/EU) green-housegas reduction requirement has led to a higher feedstock efficiency, i.e.
will tighten and specify the reporting and documentation requirements. There is no absolute or manufacturers require less feedstock to meet the obligation. Conversely, the quota
official data on the share of feedstock of biofuels consumed in the EU. on greenhouse gas (GHG) emissions could be raised as a result of the competition
for efficiency, in which case biofuels could make a major contribution immediately towards
reducing GHG in the transport sector. The German biofuels industry is therefore calling for a
widening of the obligation to reduce greenhouse gas emissions.
Rapeseed oil reduced and replaced by used cooking oil
© AMI 2019 | Source: Oil World
Share of uses cooking fats/oils in biodiesel increases
© AMI 2019 | Source: 1Federal Office for Agriculture and Food: Evaluation an Progress Report 2018, October 2019; 2BAFA: Mineral Oil Statistic
28 Production of biofuels Production of biofuels 292.4 What feedstocks go into the production of biodiesel 2.5 Where do the feedstocks for biodiesel at German
used in Germany? petrol stations come from?
» 2.4.2 Greenhouse gas savings » 2.5.1 Origins of feedstocks for biodiesel used in Germany
In 2018, a total of 2.3 million tonnes of feedstocks were used to produce the biodiesel/HVO/
vegetable oil that was placed on the market. More than a half of it (around 57 per cent)
came from Europe, mostly from Germany. The use of rapeseed oil alone amounted to
Greenhouse gas savings increase to 84 per cent
589,000 tonnes, most of which was sourced in Europe, except for a small amount that came
from Australia. The amount of biodiesel from waste oils (used cooking fats, used deep-frying
oils, etc.) has increased by 17 per cent, which is higher than the amount of biodiesel made from
rapeseed oil. The largest amount of imported used cooking oil came from Asia. Imports
of palm oil, mainly from Indonesia and Malaysia, increased slightly, accounting for one fifth of
the commodity mix in 2018. Soybean and sunflower play a minor role.
In Germany the biomass used for biofuel production is systematically recorded in high quality
in the „Nabisy“ database. However, the unique traceability system exclusively centers on
biofuels marketed as transport fuels and heating fuels (CHP plants). These sustainable biofuels
can then be counted towards the quota of greenhouse gas (GHG) emission reduction. The
infographic below, based on data from Nabisy, only shows the part of feedstock origins used
in biodiesel and HVO that was imported to Germany or processed for such use in Germany.
© AMI 2019 | Source: BLE
© AMI 2019 | Source: BLE
30 Production of biofuels Production of biofuels 313.1 Is there sufficient rapeseed in Germany?
» 3.1.1 German rapeseed production and level of self-sufficiency
Supply of rapeseed depends foremost on the domestic harvest volume and consumption. One
of the world‘s largest oilseed-processing countries, Germany needs imported oilseeds, mostly
rapeseed (approximately 60 per cent), in addition to oilseeds from its domestic crop. In 2018/19,
Germany processed 12.6 million tonnes of oilseeds, of which 71 per cent (approximately 8.9
million tonnes) were rapeseed. Like in the previous year, more than 50 per cent of this demand
was covered by rapeseed from abroad. A significant amount – almost 740,000 tonnes, or 10 per
cent more than in 2017 – came from Ukraine. The total amount of rapeseed processed in
Germany yielded 3.8 million tonnes of rapeseed oil and 5.1 million tonnes of Non-GMO
rapeseed meal. The amount of rapeseed oil is more than needed for the production of food and
transport fuels and for uses in the oleochemical industry. About 1 million tonnes of rapeseed oil
went to the German food industry, another 1 million tonnes to the engineering sector. More than
860,000 tonnes (net) of rapeseed oil were exported.
Smaller rapeseed harvest reduces share of processing
© AMI 2019
3 Food security
Sources: Stat. Bundesamt, BLE
32 Feedstock supply Food security 333.1 Is there sufficient rapeseed in Germany? 3.2 Why is demand for oilseeds increasing?
» 3.1.1 German rapeseed production and level of self-sufficiency » 3.2.1 Global consumption of meat by continent
3.1.1.1 Output of rapeseed meal with and without biodiesel fuel production World meat consumption multiplied in the past 60 years to around 320 million tonnes
and is set to increase further in the years to come. The rise is not only a result of the growth
The feed market is one of the main beneficiaries of biodiesel production, because rapeseed meal
in the world’s population. Meat consumption strongly depends on standard of living, eating
is generated as a by-product of rapeseed oil production. And rapeseed meal is a key feedstuff.
habits, and on consumer price levels and macro-economic uncertainties. Compared to other
German rapeseed processing in 2017 amounted to 9.2 million tonnes, yielding just less than 4 million
raw materials, meat involves high production costs and is relatively expensive compared to
tonnes of rapeseed oil and 5.2 million tonnes of rapeseed meal. Since rapeseed is produced in
other staple foods. As a result, demand for meat is related to higher incomes and the associated
Europe without using genetic manipulation (GM), its by-product, rapeseed meal, is also
changes in diets that give preference to eating more protein from animal sources.
classified as GMO-free. This classification promotes the use of rapeseed meal mainly in
dairy feeding, where it can fully replace soybean meal and the corresponding imports
The growing demand for livestock provokes the need to produce more feed. Alongside grains,
from overseas. The key factor is demand for dairy products that qualify as “without GM”. This
soybeans and rapeseed are the main crops used in feeds. Both soybeans and rapeseed are
means that rapeseed meal also significantly reduces the dependence on imports of GMO soy or
used to make protein feed meal. On a global scale, most soybeans are grown from genetically
GMO soybean meal. Only about one third of the 3,8 million tonnes of rapeseed oil were used
modified (GM) seed, as is rapeseed in Canada. Because of the global surge in meat consumption,
for human consumption, whereas 66 per cent were used for technical applications or energy
demand for feed protein from oilseeds is set to rise further in future. The European Union
production. If demand for rapeseed oil for use in biodiesel production were to shrink in the future,
exclusively grows GM-free oilseeds (rapeseed and sunflowers). Since demand for
which would be the case if biodiesel is no longer seen as a contribution towards decarbonising the
produce declared as “without GM” is growing, production of GM-free products is
transport sector, two thirds of today‘s rapeseed meal production would no longer be available.
increasingly based on national or European oilseeds. This aspect will gain more and more
More soybean imports would be required to fill this gap. In purely arithmetic terms, the rapeseed
importance as a result of climate protection policy that gears the cultivation of raw materials
meal gap in the past year would have amounted to 3.4 million tonnes. To offset the gap left
increasingly to sustainability and greenhouse gas reduction.
by rapeseed, soybean meal imports would have had to increase by around 2.7 million
tonnes annually – which would have required an additional soybean production area
of approximately 1 million hectares. Consequently, the situation would reverse the trend of
promoting domestic GM-free protein sources. It has only been since 2012 that rapeseed meal
accounts for half of the meal fed to animals in Germany.
Meat consumption on a steady rise
© AMI 2018
No rapeseed methyl ester – less rapeseed meal Source: FAO, UNO
© AMI 2018 | Source: BLE, AMI
34 Food security Food security 353.2 Why is demand for oilseeds increasing? 3.3 What is the amount of grain/vegetable oil per person?
» 3.2.2 Blending quotas for biodiesel » 3.3.1 Supply per capita
On a global scale, the largest driving force promoting biofuels are statutory blending Over the past 50 years the average per capita supply of the world‘s growing population of
requirements. The motivation of the various countries differs greatly. Whereas US and grain and vegetable oils was subject to fluctuations, but trended upward. Estimates for 2018
Brazilian interests focus on security of supply in the energy sector and reduction of fuel imports, are 344 kg of grain and 26 kg of vegetable oil. These figures exceed the previous year‘s total of 364
the EU places great importance on climate protection and an increase in the overall proportion kg per capita by 6 kg per capita. However, part of this supply is also used in feed production, for
of renewable energy generated. The goals in Asian countries, such as Malaysia, Indonesia and transport fuel blends (based on statutory quotas) or other industrial purposes. In purely arithmetic
China, but also in Argentina and Brazil, are different again. In these countries, the main objective terms, food supply is sufficient to feed the world‘s population. However, there are huge
is to reduce vegetable oil surplus in an effort to stabilise market prices. These countries‘ national differences between regions. The difference in availability of agricultural feedstocks is primarily a
mandates for shares of volume or energy in fossil-energy diesel fuel range from 1 to 30 per cent. result of distribution issues, rather than a result of global undersupply due to competing fuel and feed
uses. Moreover, there are substantial differences in purchasing power in the different countries.
In Germany, the greenhouse gas reduction obligation was introduced for the first time This calculation takes into account both the cost of living and rate of inflation in the countries
worldwide in 2015. Distributors (i.e. the petroleum companies) must provide evidence of included. However, we still need a comparison between specific shopping baskets and habits of
compliance. Bioethanol plays the most important role in the majority of countries that have quota consumption (e.g. cassava, millet in Africa) that would allow us to draw conclusions on per capita
requirements. Again, its use is driven by oversupply in the grain and sugar markets. The biofuel purchasing power. The currency to evaluate purchasing power is the international dollar, which
funding policy‘s aim is not only to contribute to protecting the climate and natural resources, has the same purchasing power as the US dollar. The World Bank put the per capita purchasing
but also to reduce pressure on the market and, consequently, stabilise prices for farmers. The power in Germany in 2017 at around 51,680 international dollars. In contrast, the purchasing power
major exporters of agricultural produce in particular can be expected to continue to pursue their in Liberia was only 710 international dollars. This means that the existing funds are insufficient for
previous biofuels policies in the national action plans for decarbonising the transport sector they people to buy the amounts of food they need in countries with low purchasing power, although
are required to provide by 2020 (Paris climate protection agreement). supply of agricultural products is adequate. Whereas in poorer countries of the world food takes up
the biggest part of people‘s incomes, the population in industrial nations only spends a small part
of their money on food. The UNO estimated the percentages in 2016 at on average 50 per cent for
Africa, 15 per cent for the EU and 6 per cent for the US.
Blending quotas promote use of biofuels
© AMI 2018 | Source: Biofuels Digest,
FAS, Ländermeldungen
Food production increases with world population
© AMI 2018
Source: FAO, USDA
36 Food security Food security 373.4 Is there enough food? 3.5 Why do people starve?
» 3.4.1 Use of feedstocks in biofuels production » 3.5.1 The issue of distribution
Charity organizations and environmental associations, and also politicians, challenge – often very People in many parts of the world starve or are malnourished although in terms of
effectively – the importance and scope of feedstock production for global biofuels production. The figures there is adequate supply of the most important staple foods. Along with climate
ethical question is whether these feedstocks may be grown and processed for energy purposes. change and natural disasters, wars and forced migration are the main factors stoking hunger in
The fact is that in terms of total world production, the share of agricultural feedstock the world. On top of this, international terrorism has become an increasing risk to people‘s lives
used in biofuels production is small. Sugar cane and maize do make up a significant share, and safety in a growing number of countries. The more people are involved in producing food,
but just a small proportion of maize is used in food production. At the same time, the processing the more serious the setbacks in food production caused by political crises or conflicts. It is sadly
of grain into bioethanol yields a considerable amount of Dried Distillers Grains with Solubles true that to this day more money is spent on maintaining and spreading violence than on peace.
(DDGS). This is the equivalent to rapeseed and soybean meal as by-products of processing
of oilseed into oil and biodiesel. Consequently, using agricultural feedstocks for energy There are also other multiple and complex reasons for the shortage of food, such as
purposes can even help to cope with the world‘s current biggest challenge – to reduce climate change, dry spells, unjust distribution and a lack of democratic structures.
the protein deficit. The share of agricultural feedstock used in biofuels production amounts to All these factors prevent economies from booming, farmers from farming in a cost-efficient
only 12 per cent of global use and ranges from 0.2 to 24 per cent for specific feedstocks. Demand manner and countries from establishing democratic structures without maladministration or
for sugar cane and maize as feedstocks for use in bioethanol production by far outstrips that for corruption. It is a striking fact that in past famines, it was almost always a combination of
vegetable oil feedstocks for use in biodiesel production. The share of wheat and sugar beet is war and economic hardship with natural disasters such as dry spells that led to humanitarian
relatively small in terms of quantity. Conversely, this confirms the structural surplus, particularly emergencies. Countries having no structures for a functioning social system run a much higher
of carbon hydrates, that exists in the countries where these crops are grown. risk of famine and malnutrition. Where an appropriate framework is in place, it could be used
as a base on which to intensify locally adapted cultivation systems in a sustained manner and,
by so doing, create the foundation for supply with food that is equally sustained.
Significant use for biofuels production only in the cases of sugar cane and maize
Distribution issue just one of multiple reasons © AMI 2018
© AMI 2018 Source: World Bank, USDA
Source: OECD, USDA, Oil World
38 Food security Food security 393.5 Why do people starve? 3.5 Why do people starve?
» 3.5.2 Battle for water » 3.5.3 Food availability and climate change
Water is indisputably a core essential to life. However, this precious resource is growing scarce. The implications of climate change, which vary locally, will have an impact on agricultural output.
As early as in the 1990s, experts predicted that in the 21st century wars would no longer be
waged for oil but for water. And indeed, there have been repeated conflicts over this most coveted In many regions, the adverse impact of climate change on crop yields and agricultural production
resource, especially where countries are forced to share water from the same sea or river. could be partially offset by intensifying agricultural land management or expanding agricultural
land. At the same time, small family farms have little access to innovative technologies and plant
One of many examples is the political conflict between Israel and its neighbour states, which is production methods, which makes it harder for them to adapt to a changing climate.
exacerbated by disputes over water from the River Jordan. Scientists fear that such conflicts
will become more frequent as the climate changes. Above all, scarce water reserves, high In comparison with the status quo, model calculations project that climate change will cause a falloff
population density, imbalances of political power and climate stressors are the key in agricultural output in many parts of Africa, the Middle East and India and South and Southeast
factors causing water-related tension in these countries. Global warming and demographic Asia. By contrast, for countries in more northern latitudes the forecast is that higher temperatures
growth in particular are set to lead to a growing scarcity of water, consequently toughening will lead to a rise in agricultural output, for example in Canada and the countries of the Russian
competition for the precious resources. This development will inevitably also increase the risk Federation.
of conflicts. Such risk could, however, be minimized if the countries affected are well prepared
and willing to cooperate. Differences in access to markets and technologies within and between countries will
likely enhance the impacts of climate change and could cause the gulf between industrial
The hot spots for water conflicts are located in the water catchment area of the River Nile and and developing countries to widen further.
the areas around the Ganges Delta and Indus River. In Asia the situation is exacerbated by the
fact that a lot of water is required in farming, on which people there are extremely dependent
economically. Countries bordering with the Euphrates and Tigris rivers are also seen to be
particularly vulnerable to water conflicts. The chances are that the Colorado River, which flows Changes in production due to climate change
through the US and Mexico, and whose waters are fiercely contested even now, could also
become another hot spot. © AMI 2018
Source: FAO
Hot spots of future water conflicts
© AMI 2018
Source: EU Commission
40 Food security Food security 414.1 Does growing energy crops create a lack of land
for food crops?
» 4.1.1 Shares of land used for biofuels production
Crop plants are grown on more than 1.56 billion hectares worldwide. These include – among
others – grain, oilseeds, protein, sugar and fibre plants, fruits, vegetables, nuts and others. Most
of this produce is used as food. Only around 5 per cent go into biofuels production.
At the same time, biofuels production is in most cases very obviously located in places where
there is a surplus of feedstock anyway. If the surplus were not used to produce biofuels, it would
have to be placed on the global market, where it would weigh heavily on already low feedstock
prices. The use in biofuel production reduces the production overhang, generates extra value
added and reduces the need for foreign currency for imports of crude or fossil fuels. The latter is
primarily a problem in poorer countries. Another advantage is the amount of high-quality protein
feed that is generated in biofuel production, demand for which is steadily increasing. The amount
and quality of these protein feeds have a strong influence on feedstock prices. Consequently,
they also determine the amount of land dedicated to growing the feedstocks. In other words,
biofuels are by no means the price drivers in the commodities markets. If necessary, the
feedstocks grown for biofuel production are primarily available for food supply. In the
case of politically subsidized extensification, this option for „buffering“ food demand is omitted.
4 Use of land Biofuels take up little space
© AMI 2019
Source: OECD, USDA, Oil World
42 Feedstock supply Use of land 434.1 Does growing energy crops create a lack of land 4.2 Is there a limit to the use of palm oil?
for food crops? » 4.2.1 Global use of palm oil
» 4.1.2 Development of cropland Oil palm is the single most important oleaginous fruit crop in Southeast Asia, but is also grown to
The production of grain and rice more than trippled between 1960 and 2019 from 0,8 billion a considerable extent in Colombia and Nigeria. On a global scale, palm oil is the most important
tonnes to 2.6 billion tonnes, and the output of vegetable oils increased even twenty-fold from vegetable oil with an annual output of more than 70 million tonnes. Like other vegetable oils, it is
17 million tonnes to 206.5 million tonnes. The conversion of primeval forest and other land ideal for a wide range of uses – in food, oleochemical items or as a feedstock for biofuel. Global
required to protect the environment and climate is increasingly meeting with strong public and palm oil consumption in 2018 is estimated at just less than 69 million tonnes. The majority is
political resistance. For this reason, there is a need to create sustainability requirements that used as edible oil in Southeast Asia. Food uses account for 71 per cent, energy uses for 20 per
are binding on all growing areas. Based on these requirements, biomass production must be cent (e.g. biodiesel) and oleochemical uses for 7 per cent of overall consumption. World palm oil
certified to allow it to be traced to its origin. In the southern hemisphere, the implementation of production increases each year due to the expansion in area by clearing primeval forest legally
social standards and the issues of land acquisition and ownership are paramount for sustained and illegally, replantings and the use of new hybrid varieties with a high yield potential. However,
biomass production. A stop must be put to illegal clearings of primeval forest or changes in land the growth in global demand is lagging behind. This has the result that more and more palm oil
use to create new palm oil plantations or expand soybean cultivation. In the revision of the surplus is processed into biodiesel in the main palm oil producing countries and governments are
EU RED II, the EU‘s biofuels policy defines more stringent documentation requirements raising blending quota requirements step by step. In Indonesia, the quota for non-public transport
and greenhouse gas reduction requirements, for the first time also for solid biomass. is already at 20 per cent. By contrast, the EU aims at curbing the use of palm oil in biodiesel.
At the same time, in light of the changes in land use in South America and Asia (clearing Plans are to end counting palm oil in biofuels in the achievement of EU climate targets. However,
primeval forest), there are growing calls to develop these system requirements further fuels at European petrol stations will not be entirely free of palm oil until 2030. The
– irrespective of final use – and lay them down in legislation. The aim should be to create incorporation rate is to be frozen at the level of 2019 and then gradually reduced from
a level playing field for global fair competition without any environmental or social dumping. 2023 onwards. On a global scale, palm oil consumption is likely to increase over the coming
years, especially, it can be assumed, in the food sector. At the same time, the individual sectors
are poised to make increasing use of palm oil that is certified as sustainable. In the EU-28 today,
the percentage of certified palm oil for energy-related uses is one hundred per cent.
Less land in agricultural use in the northern, increasingly more in the
southern hemisphere
© AMI 2019 |Source: FAO Palm oil is primarily food
© AMI 2018 | Source: Oil World, USDA
44 Use of land Use of land 455.1 Do biofuels push food prices up?
» 5.1.1 Comparison of prices of bread and grain
Wheat is used both for food and bioethanol production, with use in transport fuel production
currently stagnating. Many people argue that production of biofuels causes a shortage in this
feedstock for food production and drives wheat prices. Although prices for wheat and rye bread
did increase in the second half of 2018, biofuel production had little to do with the increase. In fact,
the rise was prompted by a significant surge in wheat prices in response to smaller harvests. The
main reason for consumer price increases of soft wheat-based products, e.g. wheat-
rye bread, has been rising costs for labour, rents, energy etc. The explanation is that
raw material only accounts for approximately 15 cents of the costs in a one-kilo loaf of
wheat-rye bread.
The case that the production of biofuels reduces the availability of feedstock for food and drives
prices upwards is not only made in industrial countries. The point is also made as an argument
against the use of renewables in developing countries. However, the real causes of price
increases in these countries are primarily found in government interventions in the markets,
high freight costs, poor infrastructure and inadequate market access.
5 Development of prices
Bread price versus grain price
© AMI 2018 | Quellen: AMI/LK/MIO, AMI Consumer Price Panel
46 Feedstock supply Development of prices 475.1 Do biofuels push food prices up? 5.1 Do biofuels push food prices up?
» 5.1.2 Comparison of prices of bioethanol and grain » 5.1.2 Comparison of prices of bioethanol and grain
Issues surrounding global nutrition continue to be at the centre of intense discussion, especially
5.1.2.1 Comparison of prices of biodiesel and vegetable oil
since prices for agricultural feedstock and staple foods exploded globally in 2007 and 2008
and prices became volatile as a result. Ongoing famine, hunger and poverty have been closely
associated with the way prices for agricultural feedstock have developed in the global market.
More specifically, biofuels are often cited as the explanation for the price situation. Biofuels have little influence on commodities
According to FAO, suppliers have “responded” with intensification and yield increases. For several © AMI 2018
Source: AMI
years now, bumper crops have led to global oversupply and, as a consequence, a build-up of stocks
at high levels. 2018/19 grain harvests are exceptionally small in many parts of the world due to
adverse weather conditions. As a consequence, production is unlikely to cover annual demand.
Nevertheless, overabundant stocks will close the gap – there can be no question of grain
supplies being short. As the charts show, the increase in demand for agricultural feedstocks for
use in biofuels production only has a minor inflationary impact on prices. Although both wheat
and bioethanol prices went up, there is no direct correlation between the two. In the wake of the
trade conflict between the US and China and the associated increase in crude oil prices, bioethanol
prices increased whereas prices of wheat were driven by harvest losses in Europe. To sum up,
bioethanol does not lead to rising prices of wheat; instead, demand for biofuels stabilizes
producer prices, even to the benefit of agriculture in developing countries.
Biofuel demand has little impact on prices
© AMI 2018 | Source: AMI/LK/MIO
48 Development of prices Development of prices 496.1 General notes on handling statistics
» 6.1.1 Pitfalls of statistics
Each case made should be based on reliable figures, especially in the debate on
benchmark decisions about medium and long-term supply with food. However, it isn‘t
as easy as it sounds. Decision-makers frequently act according to the motto: “I don‘t trust
any statistics I didn‘t falsify myself.” How trustworthy is the source? Which intention does the
data provider represent with the information given? And even if the information is neutral, the
question is, is the glass half full or half empty? Figures can often be interpreted in different ways.
And finally, how exact is “exact”? This problem can be seen especially in statements of quantity.
For example, figures relating to production and processing are always fraught with uncertainty.
The maize crop outlook for China is a recent example. For many years it was too low, because
the assumed acreage it was based on was too small. The figures had to be raised following an
agricultural survey. More specifically, the authority in charge revised the ten-year statistics for
maize upwards by up to 40 million tonnes per year. At the same time, adjustments of consumption
figures have been inadequate. This has led to an unexpected swelling of global maize stocks. Not
even the USDA could blind itself to these facts and revised its global supply/demand balance for
maize substantially in November 2018.
6 Statistics All figures are relative
© AMI 2018 | Source: USDA
50 Feedstock supply Statistics 51You can also read