Layers of possibilities - KGHM Group Investor Presentation - KGHM Polska Miedź
←
→
Page content transcription
If your browser does not render page correctly, please read the page content below
Layers of possibilities

                          KGHM Group Investor Presentation
                          November 2020
Cautionary statement

    This presentation was prepared by KGHM Polska Miedź S.A. (KGHM). The presentation is strictly of an informational nature and should
    not be construed as containing investment advice. The users of this presentation are solely responsible for their own analysis and
    assessment of the market situation and of the potential future results of KGHM based on the information contained in this presentation.
    The presentation is not, and should not be construed to be, an offer to sell, or to submit an offer to purchase, any of the securities of
    KGHM. The presentation is also neither in whole nor in part the basis for concluding any agreement or contract whatsoever or for
    undertaking any liabilities whatsoever. Moreover, this presentation does not represent a recommendation to invest in the securities
    of KGHM.
    Neither KGHM nor any of its subsidiaries shall be held liable for the results of any decisions taken based on or utilizing the information
    contained in this presentation or arising from its contents. The market-related information contained within this presentation was
    partially prepared on the basis of data arising from those third parties mentioned in this presentation. Furthermore, certain declarations
    contained in this presentation may be of a forward-looking nature – in particular, such declarations may be in the nature of projections,
    developed based on actual assumptions, reflecting known and unknown types of risk as well as a certain level of uncertainty. The actual
    results, achievements and events which occur in future may significantly differ from the data directly contained or understood to be
    contained within this presentation.

    In no case whatsoever should the information contained within this presentation be considered as a clear or understood declaration,
    or as any type of assertion whatsoever by KGHM or persons acting in its behalf. Neither KGHM nor any of its subsidiaries are required
    or obligated to update this presentation or to provide its users with any additional information whatsoever. KGHM furthermore hereby
    notifies the users of this presentation, that the sole reliable source of data on its financial results, forecasts, events and company
    indicators are the current and periodic reports published by KGHM in performance of the informational obligations arising from Polish
    law.

2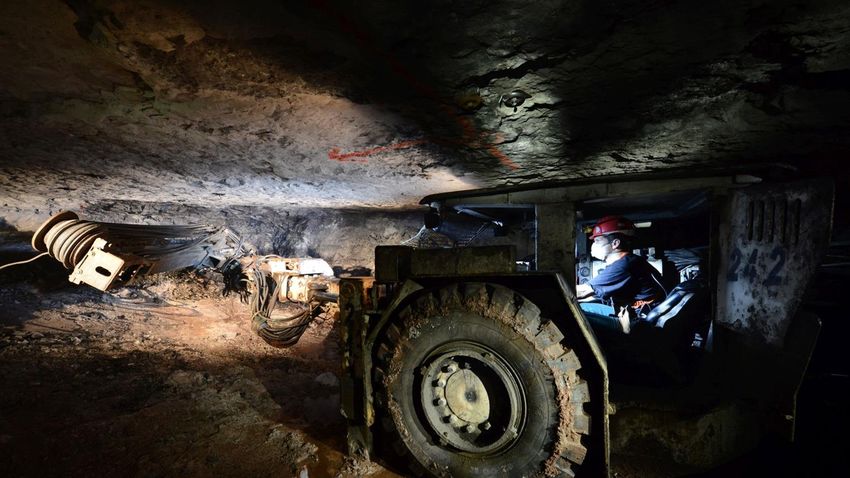
Agenda

      1. Key information about     2. Sustainable development   3. The KGHM Group
          the KGHM Group               of the KGHM Group            vs the sector

     4. Production and financial       5. Advancement of        6. Additional slides,
     results of the KGHM Group        the Group’s Strategy              Q&A

3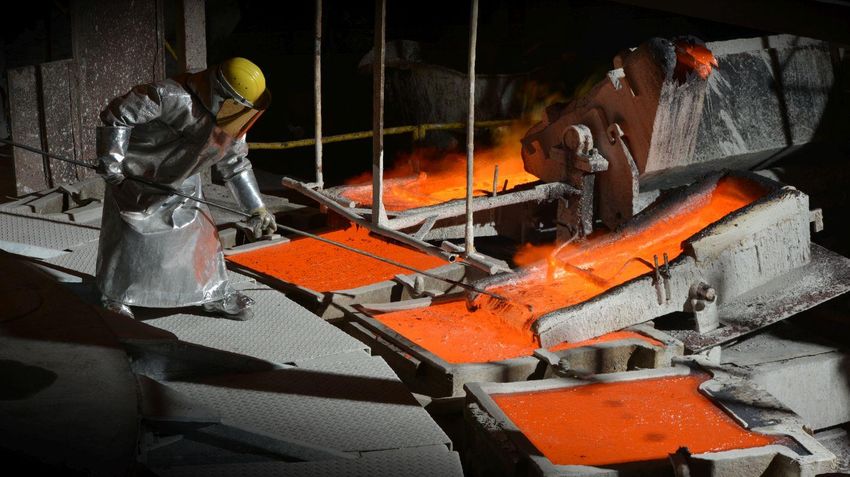
We care,możliwości
Pokłady we act, we protect
Effectively fighting the spread of the coronavirus
Initiatives and Preventative Communication
procedures methods and education
COVID-19 unit at the Thermal cameras Numerous communication
hospital MCZ NITROSEPT disinfectant channels
Help for seniors liquid Continuous announcements
Home office and Disinfection and masks on internal procedures and
restricted contacts in common-use areas sanitary services guidelines
Protective procedures and during transport Billboards, educational films,
Personal safety handouts, newspapers and
measures when company TV
travelling into/out of Special Infolines for
the mines employees
4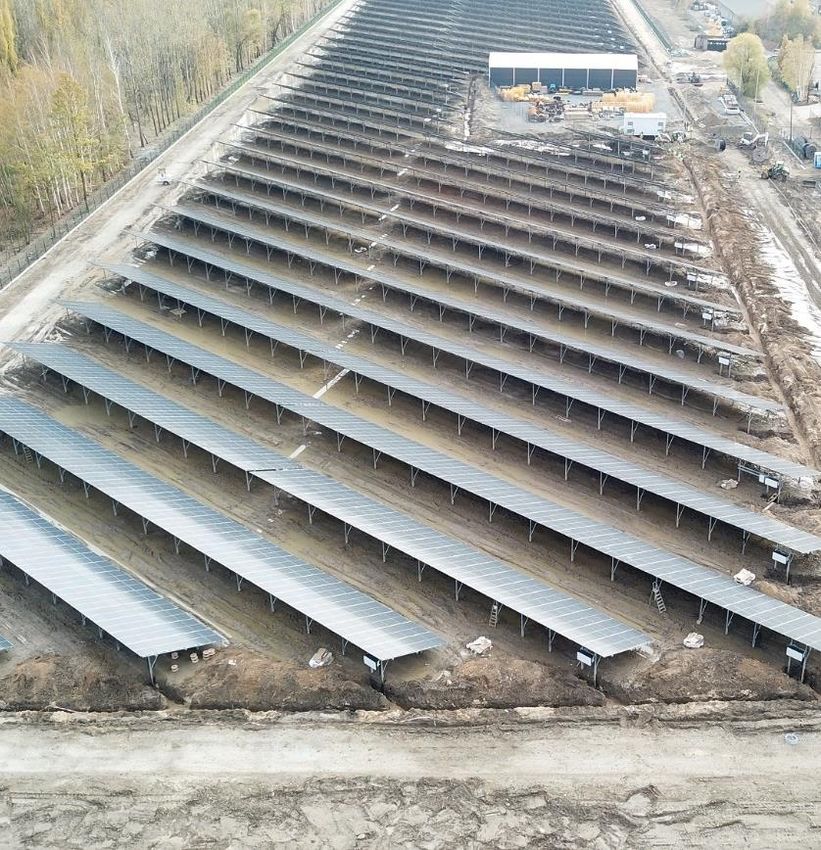
Key information about the KGHM Group
KGHM Group in brief

           One of the world’s largest
           producers of copper and                                           702 thousand tonnes                                             A diversified portfolio of
         silver with nearly 60 years of                                  of payable copper production                                       assets at various stages of
           experience in mining and                                      by the KGHM Group in 2019,                                       development located in mining-
                   metallurgy                                                   (11% higher y/y)                                               friendly jurisdictions

                                                                            A stable and competitive
       Member of the prestigious                                             position in a key sector                                        An organisation with strong
    indices WIG-ESG1) & FTSE4Good                                            for the global economy                                        values-based roots, focused on
     published by the WSE and LSE                                       - copper mining and processing                                      corporate social responsibility

6   1)    The WIG-ESG Index includes 60 of the largest and most-liquid securities trading on WSE, deriving its constituents from the large-cap WIG20 Index and mid-cap mWIG40
          Index. Constituents are assigned ESG scores using insights from Amsterdam-based ESG analytics firm Sustainalytics.
KGHM: a top ten copper producer and a leading Polish exporter
The Group has a global reach and plays a significant role on the global copper and silver markets
Sixth Cu Second Ag
largest largest
copper silver
producer producer
Other KGHM Group products:
Molybdenum Platinum Copper
Lead Rhenium sulphate
Nickel Sulphuric Nickel
Gold acid sulphate
Palladium Selenium
Legend: Mining projects of KGHM Mines of KGHM Metallurgical facilities of KGHM
Geology Mining Metallurgy
Exploration and Smelting and
Ore extraction Ore enrichment Casting
evaluation refining
7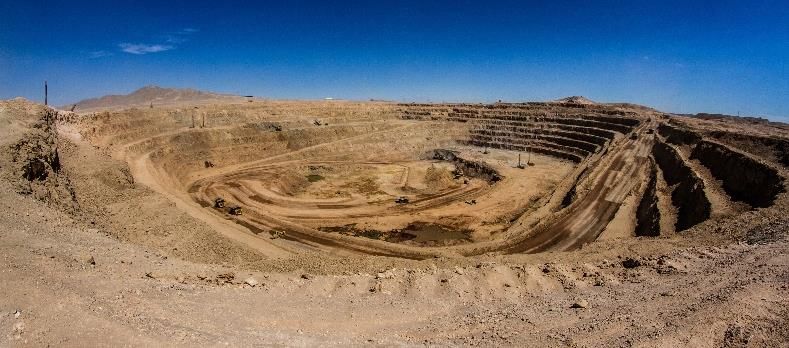
KGHM among the biggest copper and silver producers1)

         Mined Copper production 2019 2)                                                    Silver production 2019 3)

                                                                                    1 706                                                1 610
                                                                            1 371                                                     1 417
                                                                         1 258                                                  996
                                                                       1 170                                                  805
                                                                  994                                                     671
                                                          702                                                            633
                                                          702                                                            631
                                                     557                                                                 625
                                                    520                                                                 556
                                                   499                              [kt]                                523                   [kmt]

    1)    KGHM results as reported in its consolidated financial statement 2019
    2)    Mines and Metals, March 2020
8   3)    World Silver Survey 2020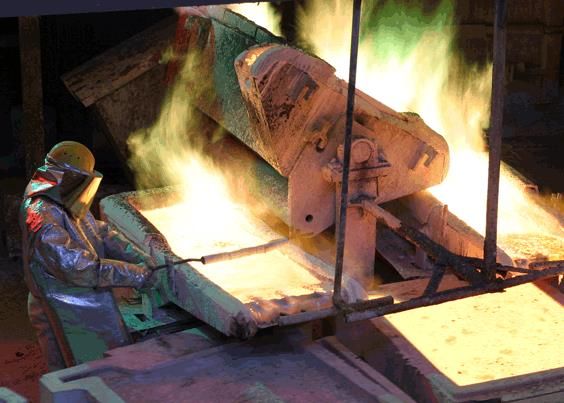
A proud history of mining and metallurgy

     Discovery of the copper deposit brought about a fundamental change in the region’s economy thanks
     to the growth of KGHM Polska Miedź S.A. As a result of M&A activities, capped by the acquisition of
     Quadra FNX, KGHM became a truly global copper producer aimed at continued growth

      1957       1960–70       1968–78        1969–74         1977–80          1993          1997          2012           2014            2015        2018–19

     Discovery   Founding of      Start of    Completion     Construction     Start of     IPO - KGHM    Acquisition      Start of        Level of    Start-up of
       of the     the Lubin    construction   of the Rudna       of the      precious        joins the      of the      production     commercial         flash
      copper         and        of Głogów         mine       Sieroszowice   metals plant      Warsaw      Canadian     by the Sierra    production      furnace
    deposit by    Polkowice       smelter                        mine       – silver and       Stock       mining      Gorda mine       reached by    technology
        Jan         mines        /refinery                                      gold        Exchange      company                      Sierra Gorda      at the
    Wyżykowski                                                                                           Quadra FNX                                    Głogów I
                                                                                                                                                        smelter

9
Core production assets in Poland – stable output and earnings
Underground copper mines, fully integrated production
Polkowice-Sieroszowice Mine Legnica Smelter and Refinery
36 years LOM LME grade A-registered cathodes
Copper production in 2019 (payable): Capacity of ~120 kt electrolytic Cu/year 1)
194.6 kt (-0.6% y/y) Other metals produced: Ag, Au, Pb, Re
Associated metals: silver, lead, rock salt, gold 2019 Cu production: 117.5 kt (+2.6% y/y)
Rudna Mine Głogów I Smelter and Refinery
21 years LOM LME grade A-registered cathodes
Copper production in 2019 (payable): Capacity of ~240 kt electrolytic Cu/year 1)
181.3 kt (-2.6% y/y) Other metals produced: Ag, Au, Pb, Re
Associated metals: silver, lead, gold 2019 Cu production: 218.7 kt
Lubin Mine Głogów II Smelter and Refinery
26 years LOM LME grade A-registered cathodes
Copper production in 2019 (payable): Capacity of ~230 kt electrolytic Cu/year 1)
73.5 kt (+4.9 y/y) Other metals produced: Ag, Au, Pb, Re
Associated metals: silver, lead, gold 2019 Cu production: 229.3 kt
Deep Głogów Project
Extension of Rudna and Polkowice-
Cedynia Copper Wire Rod Plant
Sieroszowice mines Contirod and Upcast technology
DG production figures are included in Rudna Production in 2019: 250.7 kt of copper wire
and Polkowice-Sieroszowice mines’ rod and 15.5 kt of OFE rod (-0.08% y/y)
production stats
10 1) Capacity excluding cyclical planned maintenance shutdownsKey international assets
Existing operations and growth potential from projects
Producing assets Potential growth projects
Sierra Gorda (55% stake), Chile Sierra Gorda Oxide, Chile
24 years LOM 2019 production stats: 11 years LOM
Open-pit mine Cu production The project aims at processing the oxide ore
Porphyry (payable): 59.5 kt The oxide ore is currently stored separately for
(+11.7 y/y) later heap leaching
The ore will be transported to a permanent
heap, where it will be processed via leaching
Robinson Mine, USA
9 years LOM 2019 production stats:
Open-pit mine Cu production Victoria, Canada
Porphyry/ (payable): 48.8 kt
Skarn orebody (+1.7 y/y) 13 years LOM
The projects assumes building an underground
copper-nickel mine
Current development scenario assumes
Sudbury, Canada accessing the deposit via 2 shafts
7 years LOM 2019 production stats: Forecasted annual production: 19 kt Cu p.a.,
Underground mine Cu production 17 kt Ni p.a.
Footwall/ (payable): 4.2 kt
Contact orebody (-43.2% y/y) 1)
Ajax (80% stake), Canada
Franke Mine, Chile 19 years LOM
The project assumes building an open-pit
5 years LOM 2019 production stats:
copper-gold mine and processing plant with
Open-pit mine Cu production
associated infrastructure
IOCG orebody (cathodes: SX-EW):
53 kt Cu p.a., 114 koz t Au p.a.
19.0 kt (-5.9% y/y)
11
1) Morrison/Levack (Sudbury Basin) mine placed into Care & Maintenance in Q2 2019Sierra Gorda
Sierra Gorda is an open pit copper and molybdenum mine
located in Chile’s Antofagasta region in the Atacama desert.
Sierra Gorda is a Joint Venture of:
KGHM Polska Miedź S.A. – 55% share
Sumitomo Metal Mining – 31.5% share
Sumitomo Corporation – 13.5% share
Schedule of Sierra Gorda development
2006 2007 2008 2009 2010 2011 2014 2015 2016 2020
2042
Discovery of mineralization Scoping Study Start of First production Commercial
and start of the exploration completion construction of copper production
program concentrate
Life of mine based on Sierra Gorda end products are Cu production in 2019 108.2 kt 11.2% y/y
documented resources copper concentrate and
is 25 years molybdenum concentrate 1) Mo production in 2019 20.3 mn lbs 24.0% y/y
12 1) Data on a 100% basis for Sierra GordaSustainable development
Copper production:
     Pokłady możliwości emissions and impact on climate transformation

           Copper – a strategic material for a carbon
                   neutral and circular economy in Europe

                                                                                   0.4%
           CIRCULAR ECONOMY
                                                 ENERGY TRANSITION
                                                  AND DIGITISATION                                      -75%
           A circular metal: close to 50%
           of copper produced in the EU is
              obtained through recycling                                          While adding 0.4%  GHG, copper
                                                 22 mn tonnes of copper
                                                 required over 2020 – 2050       contributes to reducing ~75% of

      Carrier of valuable metals: copper
                                                 to shift to a climate-neutral
                                                     European economy
                                                                                    emissions in EU society
        metallurgy is needed to handle and
      recover many other valuable materials
       present in electronics, batteries, etc.

14   Source: International Copper Association
Sustainable
Pokłady development of the raw materials industry
możliwości 09
INNOVATION, INDUSTRY,
INFRASTRUCTURE
– a global challenge of the modern world
08
ECONOMIC GROWTH
AND DECENT WORK
KGHM as a signatory of Agenda 2030 operates on the basis of the 07
CLEAN AND
principles of sustainable development, taking into account in its daily
AVAILABLE ENERGY
commitments such areas as Society, Environment, Economics and Direct
impact
Economy, Security and Resource Efficiency
13
CLIMATE ACTION
In 2018 KGHM joined the FTSE4Good Index Series. Being a member of the
FTSE4Good index series confirms KGHM’s efforts in the field of ESG: 15
LIFE ON LAND
environmental protection, social responsibility and corporate governance.
Moreover, KGHM belongs to the WIG-ESG index (previously RESPECT Index) 06
CLEAN WATER AND
and The European Technology Platform on Sustainable Mineral Resources SANITATION
ETP SMR. In 2020 KGHM for the first time in its history chose to participate in
the CDP Climate questionnaire, while the metallurgical facilities of KGHM
announced their intent to undergo review by the Copper Mark program.
15Sustainable
Pokłady value chain
możliwości
Responsible Supply Chain Policy of the KGHM Group
Extraction Logistics Commerce Responsible Supply Chain Policy
of the KGHM Group
Rational deposits Reduction of emissions, Commerce
management - Intelligent making logistics structures based on Fair Code of Ethics
production solutions - and procedures more Trade principles
KGHM 4.0 efficient
Raw materials Production Stakeholders Tailings
Responsible use of Reduction of the Customers, consumers Product life cycles
raw materials while environmental, and partners as based on the
caring for natural product and guideposts for the Circular Economy
resources organisational Company’s standards and adherence to its
footprint of responsible actions principles at every
stage of the value
chain
16Ethical Standards
Pokłady możliwości
KGHM Polska Miedź S.A.
We follow
We avoid the principle of We take responsibility
conflicts “Zero tolerance for the quality of our
of interests for corruption”. products and services
We care about the We care about
security of information our Company’s property
and personal data and honestly manage
protection the entrusted resources
We act in compliance We take responsibility
with applicable for our impact on
regulations the environment
People’s Company’s Stakeholder’s
good good good
We are all We enter into
responsible for both partnerships
our own and our with numerous
Company’s safety domestic
At KGHM Polska In relations and international
Miedź S.A. we do not with shareholders, organisations
tolerate abuse we follow Best
Practice of the
We create high We build our Warsaw Stock
standards of relations with Exchange
employer/employee external partners
relations At KGHM, we create We are committed based on
an environment We believe that to global sustainable transparency,
and workplaces free cooperation is development honesty, trust and
of discrimination fundamental professionalism
17 for achieving successPeople and the Environment as a strategic area in the KGHM Group
Strategy for 2019 – 2023
LTIFR and TRIR ratios1) TRIR ratio in KGHM INTERNATIONAL LTD.
People and the Environment LTIFR ratio in KGHM Polska Miedź S.A.
10
18.6
Decrease over
20.0
15.4 the last 10 years
Main target – growth based on the idea of 12.1 12.9 12.7
10.4 10.2 10.4 10.3 10.3
sustainable development and safety as well
as enhancing the Group’s image of social LTIFR –45%
10.0
3.1
2.4
1.8
responsibility 0.8 0.8 0.8 0.9 0.8 1 0.8
Selected effectiveness measures with 0 0.0
TRIR –74%
respect to People and the Environment: 2010 2011 2012 2013 2014 2015 2016 2017 2018 2019
- Minimum level of annual improvement of
LTIFR (Polish assets) and TRIR (international In 2019, the Company recorded a slight increase (+0.7%) in the total number of workplace accidents. At the same
assets) time the number of workplace accidents in KGHM Polska Miedź S.A., excl. accidents due to natural causes, was
lower by 11%. Among recorded accidents around 98% were qualified as light injuries, caused mainly by rock falls
- Level of commitment and satisfaction of the
followed by loss of balance by employees, as well as contact (striking) with or by moveable/immoveable objects.
KGHM Group’s employees based on measures
defined during implementation, by 2023 TRIR 2019:
2.8 North America 0.31 KGHM Chile SpA 0.36 Sierra Gorda S.C.
1) LTIFR (Lost Time Injury Frequency Rate); TRIR (Total Recordable Incident Rate) calculated using accepted methodology as the number of accidents at work meeting the
18 conditions of registration as defined in the ICMM (International Council on Mining & Metals) standard, in total for the employees of KGHM INTERNATIONAL LTD., KGHM
Chile SpA and Sierra Gorda SCM and sub-contractors for these entities, per 200 000 worked hoursEmissions by the divisions of KGHM Polska Miedź S.A.
SO2 and dust emissions1)
SO2 emissions by KGHM Polska Miedź S.A. Dust emissions by KGHM Polska Miedź S.A.
[tonnes] [tonnes]
80 000 –81% Reduction of SO2 emissions
over the last 10 years 12 000 –83% Reduction of dust emissions
over the last 10 years
70 000 1 Start-up of 1
sulphuric 10 000
acid plant
60 000
8 000
50 000
40 000 2 6 000 2 SOLINOX – Start-up of flue
gas treatment installation
30 000 3 Start-up of desulphurisation
installation at Głogów 4 000 3
smelter/refinery
20 000 4 Start-up of 4
flash furnace
2 000
10 000
931.8 75.1
0 0
1985 1990 1992 1994 1996 2000 2002 2010 2019 1985 1990 1992 1994 1996 2000 2002 2010 2019
19 1) Other dust (without metals) from the production of non-ferrous metals, including PM 2.5 and PM 10Emissions by the divisions of KGHM Polska Miedź S.A.
Lead and copper emissions
Lead emissions by KGHM Polska Miedź S.A. Copper emissions by KGHM Polska Miedź S.A.
[tonnes] [tonnes]
400 350
350 300
–78% Reduction of lead emissions
–71% Reduction of copper emissions
300
250
over the last 20 years over the last 20 years
250
200
200
150
150
100
100
50 50
3.09 6.13
0 0
1985 1990 1995 2000 2005 2009 2019 1985 1990 1996 2000 2002 2012 2019
20Pro-ecological investments and environmental fees
KGHM Group
Over spent in 2019 by KGHM [incl. the largest expenses of over
PLN 44 million incurred on replacing
229
on investments to
the absorption and drying towers of the
protect the natural sulphuric acid plant at the Legnica Copper
million PLN environment Smelter and Refinery]
Selected actions to reduce environmental impact and environmental fees in 2019
PLN 3.3 million PLN 0.3 million BATAs program
Energetyka sp. z o.o. -13% Y/Y NITROERG S.A. -40% Y/Y Selected environmental investments:
[payments for water intake and waste discharge and [fees due to the specific nature of the products – 22 projects were advanced (16 in HM Głogów and
for emissions to the atmosphere] explosives,initiation systems, fuel additives] 6 in HM Legnica), decision made to exclude six
projects from the BATAs Program
Selected environmental investments1): Selected environmental investments: HM Głogów: work completed on sealing conveyor
belts and belt pulling stations for carrying copper
construction of a gases treatment installation modernization of the sewage treatment plant
concentrate, construction of gas desulphurisation
meeting emission standards compliant with EU continuation of the construction of a new installation for the Kaldo furnace completed
Directives installation for the production of fuel additives,
expanding capacity based on gas-fired boilers which will allow for the re-use of concentrated HM Legnica: a modernised dedusting unit for
acids in the production process three filters behind the shaft furnaces brought
on-line
21 1) Reducing the emission of contaminants to the atmospherePro-ecological investments and environmental fees
KGHM INTERNATIONAL
Activities carried out by the entities of the KGHM INTERNATIONAL Group in 2019 related to
environmental protection
PLN 28 million PLN 1 million
Robinson Mine (USA) Sudbury Basin (Canada)
including PLN 3 million due to environmental
permits held In the Sudbury Basin mines
activities focused on
Activities were aimed at monitoring air and environmental monitoring
water quality, waste management and the IN 2014, KGHM JOINED THE
restoration of mining areas
GLOBAL COMPACT –
PLN 5 million PLN 6 million THE WORLD'S LARGEST UN
Carlota Mine (USA) Franke Mine (Chile) INITIATIVE FOR CORPORATE
SOCIAL RESPONSIBILITY AND
Activities were mainly related to mine Activities focused on acquiring SUPPORT FOR SUSTAINABLE
decommissioning and environmental required permits and environmental
monitoring monitoring DEVELOPMENT
22By 2030 the increase in share of RES will lead to a substantial reduction in CO2
emissions
Share of power source in supplies
2019 2030
3 TWh 3 TWh
Natural Own Natural
Market Own sources Market RES
gas sources gas
82% and RES 50% 49%
100% and RES 51%
18%
50%
Estimated CO2 emissions from electricity consumption
[mn tonnes]
1.9
Reduction
1
by 900 kt
2019 2030
23The KGHM Group vs the sector Macroeconomic environment
Macroeconomic environment
Commodities and currencies prices
The copper price rose substantially in the third quarter, Price (USD/t) Annual av. (USD/t)
approaching the peaks of 2018, while silver remained 8 000 Price (PLN/t) Annual av. (PLN/t) 28 000
at a high level 7 500 26 000
7 000 24 000
The average price of copper in the third quarter of 2020 was more than 6 500 22 000
12% higher, with molybdenum lower by nearly 35% compared to the
6 000 20 000
corresponding prior-year period
The average price of silver in the third quarter of 2020 was nearly 43% 5 500 18 000
higher than a year earlier
5 000 Q3’20 16 000
The average price of copper in PLN was 10% higher than in the third
quarter of 2019, while the impact of the USD-denominated copper 4 500 14 000
price was somewhat offset by the strengthening of the USD/PLN Jan 18 Jul 18 Jan 19 Jul 19 Jan 20 Jul 20
exchange rate
Source: Thomson Reuters, KGHM Polska Miedź S.A.
Copper price Silver price Molybdenum price Exchange rate
[USD/t] [USD/oz t] [USD/lb] [USD/PLN]
3.88 3.80
5 802 6 519 11.82
24.26 7.69
16.98
Q3 2019 Q3 2020 Q3 2019 Q3 2020 Q3 2019 Q3 2020 Q3 2019 Q3 2020
25Precious metals
Pokłady prices rose sharply from the move back to safe haven investments,
możliwości
reaching historic (gold), or multi-year (silver) highs
Silver and gold rose sharply at the start of Q3, thereafter The gold to silver ratio of such importance to markets returned
staying at high levels to its multi-year average
Silver (USD/troz) Annual av. silver (USD/troz) Gold to silver ratio
Gold (USD/troz) Annual av. gold (USD/troz) LT average
35 120
2 000
110
30
1 800
100
25
1 600
90
20
1 400
80
15 1 200 70
10 1 000 60
Nov-19 Jan-20 Mar-20 May-20 Jul-20 Sep-20 Jan-16 Jul-16 Jan-17 Jul-17 Jan-18 Jul-18 Jan-19 Jul-19 Jan-20 Jul-20
The price of silver, which at the start of the Covid-19 pandemic was far behind that of gold, made up for these losses in the third quarter, and in
recent weeks stabilised at below-peak levels, but still at high historic levels
The gold/silver ratio, after reaching record highs in March and April, returned to its average level from recent years
Factors supporting precious metals prices in recent months are mainly the following: negative real interest rates in the main global economies, the
weakening of the USD, and the unconventional monetary policy of the main central banks
26 Source: Bloomberg, KGHM Polska Miedź2020 a rollercoaster
Pokłady możliwości for the copper price
Metal inventories were also quite volatile in recent months
In 2020 copper prices recorded their lowest levels in 4 years Copper inventories in official market warehouses rose in
and their highest since 2018 recent weeks
7 250 1 000
China's record monthly SHFE (139.7)
7 000 import purchases; SRB buys 900
[kt] COMEX (72.5)
6 750 Phase 1 trade material from the market
deal agreement 800 LME (169.6)
6 500 USA-China 700
6 250 COVID-19 China has declared
emerges to the to become carbon 600
6 000 rest of the world neutral before 2060
500
5 750
COVID-19 400
5 500
in China USD weakness 300
5 250
LME 3M Copper price 200
5 000
[USD/t] China re-opens the economy
4 750 100
and follows V-shape recovery
4 500 0
Oct-19 Jan-20 Apr-20 Jul-20 Oct-20 2015 2016 2017 2018 2019 2020
Source: Bloomberg, KGHM Polska Miedź
The closure of economies in the 1st and 2nd quarters lead to a collapse Inventories in official warehouses are at a relatively low level,
in the copper price and to a spurt in metal inventories although recently there has been a clear increase
The opening of the Chinese economy and its rapid return to equilibrium The relatively low physical premiums and high long net positions of
along with subsequent thaws in other parts of the world had a positive investors on COMEX and the LME suggest that prices are supported
impact on the price of the red metal to a large extent by investment demand
In the 3Q the higher demand seen in the record import of copper to
China supported copper prices
27In Q3’20 economic activity improved substantially vs the first half of 2020
Industrial PMI began to improve in June and in most countries continued to grow to the end
of the third quarter
28 Source: Bloomberg, KGHM Polska MiedźEconomic
Pokłady growth forecasts by the IMF in October 2020
możliwości
Canada Eurozone Poland
2019: 1.6% 2019: 1.3% 2019: 4.1%
2020F: -7.1% +1.3 pp 2020F: -8.3% +1.9 pp 2020F: -3.6% +1.0 pp
2021F: 5.2% +0.3 pp 2021F: 5.2% -0.8 pp 2021F: 4.6% +0.4 pp
World
2019: 2.8%
2020F: -4.4% +0.8 pp
2021F: 5.2% -0.2 pp
USA
2019: 2.2% China
2020F: -4.3% +3.7 pp 2019: 6.1%
2021F: 3.1% -1.4 pp Chile 2020F: 1.9% +0.9 pp
2019: 1.1% 2021F: 8.2% 0.0 pp
2020F: -6.0% -1.5 pp
2021F: 4.5% -0.8 pp
29 Forecasts (F) of actual GDP growth – International Monetary Fund - World Economic Outlook; October 2020 compared to June 2020, and in the case of Poland and Chile
October 2020 compared to April 2020The production of miners in Q3 2020, as at the start of the year, was mostly
lower
Copper production by miners, 9M 2020 vs 9M 2019
10%
-2% -3% -3% -4% -7% -8% -8% -12% -21%
0% 0%
3%
-10%
-20%
-30%
Codelco Anglo American KGHM
KGHM GK BHP Freeport KGHMKGHM
PM S.A. Antofagasta Vale Glencore Teck Rio Tinto
Group McMoran Polska Miedź S.A.
Copper production by miners, Q3 2020 vs Q3 2019
10%
-2% -2% -4% -4% -5% -7% -11% -14% -28%
0%
4% 2%
-10%
-20%
-30%
Anglo American Codelco Glencore Freeport KGHM
KGHM GK BHP ANTOFAGASTA
Antofagasta KGHMKGHM
PM S.A. Vale
VALE Teck Rio TINTO
RIO Tinto
McMoran Group Polska Miedź S.A.
30 Source: Financial reports for Q3 2020, Codelco production report; KGHM Polska MiedźProduction and financial results of the KGHM Group Part I: 5 years data
Key production data – 5 years
     KGHM Polska Miedź S.A.

      Ore extraction                 Production of copper                 Production of                        Metallic silver production
      [mn t dry weight]              in concentrate                       electrolytic copper                  [t]
                                     [kt]                                 [kt]

                                                                                 574                     566
                                                                                       536
                                            426   424   419                                  522   502                                           1 400
                                                              401                                                    1 283
          31.6 32.0 31.2 30.3 29.9                                  399
                                                                                                                             1 191 1 218 1 189

         2015 2016 2017 2018 2019       2015 2016 2017 2018 2019                 2015 2016 2017 2018 2019            2015 2016 2017 2018 2019

32
Key production data – 5 years
Sierra Gorda1)
Payable copper production Silver production
[kt] [t]
7.7 14.1 14.0 14.5 14.6
2015 2016 2017 20182 2018
59.5
51.5 53.4 53.3 TPM2) production
46.3 [koz t]
28.0 23.2 31.2
12.8 22.9
2015 2016 2017 2018 2019
Molybdenum production
[mn lbs]
19.7
12.2 14.7 11.2
6.2
2015 2016 2017 2018 2019
2015 2016 2017 2018 2019
1) Pursuant to interest held (55%); production data – 5 years (since production start)
33 2) TPM – Total Precious Metals, comprising gold, platinum and palladiumKey production data – 5 years
KGHM INTERNATIONAL
Payable copper production Silver production
[kt] [t]
1.6 2.4
1.6 1.7 1.6
2015 2016 2017 2018 2019
97.6 TPM production
89.8
81.0 [koz t]
78.8 76.5 95.3 92.1 74.0 67.6 85.2
2015 2016 2017 2018 2019
Molybdenum production
[mn lbs]
1.0 0.9
0.8 0.7 0.6
2015 2016 2017 2018 2019
2015 2016 2017 2018 2019
34Sales revenue and net profit – 5 years
KGHM Group
Revenues Net profit
[mn PLN] [mn PLN]
22 723
20 008 20 358 20 526
19 156
1 658
1 525
1 421
*
1 202 1 225 *
2015 2016 2017 2018 2019 2015 2016 2017 2018 2019
* Net profit of 2015 and 2016 excluding impact of impairment of non-current assets, loans and impairment recognised in the loss from the valuation of joint ventures
35
using the equity methodEBITDA and EBITDA margin – 5 years
KGHM Group
EBITDA by segments 1) EBITDA margin 2)
[mn PLN] [%]
KGHM Polska Miedź S.A. KGHM INTERNATIONAL
Sierra Gorda (55%) Others
5 753
4 972 5 229 26
4 710 4 666 23 23 22 21
2015 2016 2017 2018 2019 2015 2016 2017 2018 2019
1) Sum of segments; adjusted EBITDA = EBITDA (profit/(loss) on sales + depreciation/amortisation) adjusted by impairment losses on non-current assets
36 2) Adjusted EBITDA to revenues from sales. For the purposes of calculating the Group’s EBITDA margin, the consolidated revenues from sales were increased by revenues
from sales of the segment Sierra Gorda S.C.M. e.g. for 2019: [5 229 / (22 723 + 2 002) * 100]Net debt and net debt/EBITDA ratio – 5 years
KGHM Group
Net debt Net debt/adjusted EBITDA
[mn PLN] [ratio]
7 262
7 000 6 891
6 554 6 577
1.6 1.6
1.5
1.4
1.3
2015 2016 2017 2018 2019 2015 2016 2017 2018 2019
37Basic items of the consolidated financial statements
KGHM Group
KGHM Group – consolidated data 2015 2016 2017 2018 2019
Sales revenue [mn PLN] 20 008 19 156 20 358 20 526 22 723
Profit/(loss) for the period [mn PLN] -5 009 -4 449 1 525 1 658 1 421
Total assets [mn PLN] 36 764 33 442 34 122 37 237 39 409
Liabilities and provisions [mn PLN] 16 350 17 531 16 337 18 012 19 207
1)
Earnings per share (EPS) [PLN] -25.06 -21.86 7.84 8.29 7.11
Share price of the Company 2) [PLN] 63.49 92.48 111.20 88.88 95.58
3)
Net debt/EBITDA 1.4 1.6 1.3 1.6 1.5
Payable copper production 4) [kt] 718 677 656 634 702
4)
Payable silver production [t] 1 299 1 207 1 234 1 205 1 417
Concentrate production cost C1 4) [USD/lb] 1.59 1.41 1.59 1.81 1.70
Cash expenditures on property, plant and equipment & intangible assets [mn PLN] 3 939 3 251 2 796 2 875 3 232
1) Attributable to shareholders of the Parent Entity
2) At the end of the period
3) Adjusted EBITDA for the year, excluding EBITDA of the joint venture Sierra Gorda S.C.M.
38 4) Comprises Sierra Gorda S.C.M. pursuant to interest held (55%)Production and financial results of the KGHM Group Part II: 9M 2020
Summation of the first 9 months of 2020 in the KGHM Group
     Main macroeconomic factors and aspects of the Group in the age of the COVID-19 pandemic
     compared to the first 9 months of 2019

     Macroeconomic environment1)                        Production and C1 cost   Financial results

               -3%                                           -1.7%                     -2%
               Copper price                                  Copper production
                                                                                       Change in revenues to
                                                                                       PLN 16 580 mn
               +22%                                          -3%
                                                                                       +7%
               Silver price                                  Silver production

               +3%                                           -6%                       Change in EBITDA to
                                                                                       PLN 4 418 mn
               Stronger USD vs the PLN                       C1 cost

40   1)   Macroeconomic data – average for the period
Metals production
KGHM Group
Slightly lower production of electrolytic Payable copper production Silver production
[kt] [t]
copper by KGHM Polska Miedź S.A. due to a -3% 9M/9M
restricted supply of copper scrap in the first 1 031 997
half of 2020 and due to the maintenance -1.7% 9M/9M
shutdown at the Głogów I Smelter/Refinery
Lower copper production by KGHM 530 521
9M 2019 9M 2020
INTERNATIONAL due to lower production by 44 60
the Sudbury Basin mainly due to the 58 TPM production1)
49
production suspension at Morrison after Q1 [koz t]
2019, and by the Robinson and Franke mines 157 -8% 9M/9M
145
due to the processing of lower quality ore (a
transition zone in Robinson, higher
428 412
carbonates content in Franke)
Higher copper production by the Sierra 9M 2019 9M 2020
Gorda mine due to extracting higher copper
grade ore and higher extraction Molybdenum production
[mn lbs]
9M 2019 9M 2020
Lower molybdenum production both by -17% 9M/9M
Sierra Gorda (extraction of ore with a lower 8.8 7.3
Mo grade and lower recovery), and by Sierra Gorda (55%)
Robinson (extraction from a low-quality KGHM INTERNATIONAL
transitional zone) KGHM Polska Miedź S.A. 9M 2019 9M 2020
41 1) TPM – Total Precious Metals, comprising gold, platinum and palladiumProduction results
KGHM Polska Miedź S.A.
Ore extraction Production of copper Electrolytic copper Metallic silver
[mn t dry weight] in concentrate [kt] production [kt] production [t]
–1.8% 9M/9M –2.7% 9M/9M -3.7% 9M/9M -4.2% 9M/9M
22.8 22.4 428 412
305 297 1 018 975
48.7 47.9 From
115 125 purchased
Ag grade metal-bearing
in ore [g/t] materials
1.507 1.497 22.7 22.6 313 287
Cu content in
Cu grade concentrate [%] From own
in ore [%] concentrate
9M 2019 9M 2020
9M 2019 9M 2020 9M 2019 9M 2020 9M 2019 9M 2020
7.7 7.5 7.6 141 138 141 140 382 366
7.1 7.4 131 313 329
105 99 100 98 280
94
35 33 38 37
50
Q3'19 Q4'19 Q1'20 Q2'20 Q3'20 Q3'19 Q4'19 Q1'20 Q2'20 Q3'20 Q3'19 Q4'19 Q1'20 Q2'20 Q3'20 Q3'19 Q4'19 Q1'20 Q2'20 Q3'20
Ore extraction results from areas Mined copper production Lower production due to a restricted Lower production due to
selected for mining supply of copper scrap in the first lower silver content in charge
half of 2020 and to the several- materials
weeks’ maintenance shutdown at
the Głogów I Smelter/Refinery
42Change in inventories
KGHM Polska Miedź S.A.
Inventories of copper in concentrate at the smelters
amount of Cu [t]
+140% Q3/Q2
36 323
An increase in concentrate inventories at the copper smelters
14 886 15 153
due to the maintenance shutdown at the Głogów I smelter
In subsequent quarters these concentrate inventories will be
successively consumed
Q1 2020 Q2 2020 Q3 2020
Inventories of copper anodes at the smelters
amount of Cu [t] -66% Q3/Q2
34 359 29 069
The decrease in copper anode inventories results from their
9 740
consumption in the third quarter of 2020 during the maintenance
shutdown at the Głogów I smelter
Q1 2020 Q2 2020 Q3 2020
43Production results
Sierra Gorda1)
Payable copper production Silver production
+83% 9M/9M
[kt] [t]
+35% 9M/9M
20.0 Higher extraction by the
59.9 7.6 10.9
3.5 Sierra Gorda mine lead
44.4 to higher production of
Q3 2019 Q3 2020 9M 2019 9M 2020 copper, silver and gold
20.7
15.1 in the first 9M of 2020
TPM production versus the corresponding
+4% 9M/9M
[koz t] period of 2019
Q3 2019 Q3 2020 9M 2019 9M 2020
Lower molybdenum
22.8 23.8
8.3 7.5 production due
to extraction in
Higher than expected copper production Q3 2019 Q3 2020 9M 2019 9M 2020 areas with lower
after the first 9M of 2020 molybdenum
content compared
Molybdenum production
Higher payable copper production after the first [mn lbs]
-16% 9M/9M to ore extracted in prior
9M of 2020 versus the corresponding period of 8.2 periods; this factor was
6.9
2019 due to higher processing of ore partially offset by higher
2.6 1.9 ore throughput
During the first 9 months of 2020 ore with a
higher copper content was extracted compared
Q3 2019 Q3 2020 9M 2019 9M 2020
to the same period of 2019
44 1) On a 55% basisProduction results
KGHM INTERNATIONAL
Payable copper production Silver production
-29% 9M/9M
[kt] [t]
Lower silver production
-14% 9M/9M 1.7 in the Sudbury Basin due
1.2
-12% 9M/9M
0.6 to lower extraction and
excl. Morrison mine 0.4
lower silver content in
57.5 ore
excl. Morrison mine
49.2 Q3 2019 Q3 2020 9M 2019 9M 2020
55.9
Lower gold production by
-14% 9M/9M the Robinson mine
TPM production
21.6 18.6 [koz t] excl. Morrison
-5% 9M/9M
excl. Morrison mine (mining from a poor-
mine 62.9 54.4 quality transitional zone
57.3
24.0 until Q1 2021) and lower
16.2
TPM production in the
Q3 2019 Q3 2020 9M 2019 9M 2020 Sudbury Basin (lower
Q3 2019 Q3 2020 9M 2019 9M 2020 extraction, lower gold
and platinum content)
Lower production in the Sudbury Basin (lower Molybdenum production
extraction mainly due to the production suspension -33% 9M/9M Lower molybdenum
[mn lbs]
production by the
at Morrison after Q1 2019, and lower copper 0.6
0.4 Robinson mine due to
content in ore), in the Robinson mine (extraction
0.1 0.1 mining from a poor-
from a low-copper-grade transitional zone, lower
quality transitional zone
equipment availability) and in the Franke mine
Q3 2019 Q3 2020 9M 2019 9M 2020
(lower copper content in ore and lower recovery)
45Sales revenue
KGHM Group
Revenues from contracts with Revenues from contracts with
-2% 9M/9M
customers customers
[mn PLN] [mn PLN]
16 869 +397 16 580
+107 16 869 16 580
-254 -539 1 508 1 194
2 311 2 026
Revenues in first Change in sales Change in prices Change in Other Revenues in first
9M of 2019 volumes of basic of basic products USD/PLN 9M of 2020
13 050 13 360
products exchange rate
Lower revenues by PLN 289 mn (-2%) versus the corresponding prior period of 2019, 9M 2019 9M 2020
including due to lower revenues in KGHM INTERNATIONAL LTD. by PLN 285 mn due
to the suspension of work by DMC on the Woodsmith (formerly Sirius) project,
partially offset by higher revenues from sales of metals versus the corresponding KGHM INTERNATIONAL Other segments and
period of 2019 KGHM Polska Miedź S.A.
consolidation adjustments
46Sales revenue
KGHM Polska Miedź S.A.
Higher revenues from sales by PLN 310 mn (+2%) in the first 9M of 2020
compared to the first 9M of 2019, due to:
Sales revenue
[mn PLN] a higher adjustment to revenues from hedging by PLN 160 million
+2% 9M/9M
a more favourable USD/PLN exchange rate (+3%) and
13 360
higher prices of silver (+22%) and gold (+27%)
13 050
Other 1 001 1 137 alongside less favourable copper prices (-3%) and lower sales volumes of copper
Silver 2 004 2 326 (-2%), silver (-4%) and gold (-2%)
Sales of copper Silver sales
10 046 9 897 and copper products [t]
Copper and
[kt] -2% 9M/9M -4% 9M/9M
copper 415 405
products
1 029 990
9M 2019 9M 2020 wire rod
and OFE rod 202 192
9M 2019 9M 2020 9M 2019 9M 2020
4 633 4 225 4 672 4 463
4 219
135 142 132 145 128 364 345 364
323 281
Q3 2019 Q4 2019 Q1 2020 Q2 2020 Q3 2020 Q3 2019 Q4 2019 Q1 2020 Q2 2020 Q3 2020 Q3 2019 Q4 2019 Q1 2020 Q2 2020 Q3 2020
47The financial situation of the KGHM Group remains stable and safe
2020
Budget
Total unit production cost
of electrolytic copper from own concentrate
KGHM Polska Miedź S.A.1) 19.3
[k PLN/t] 17.2
Investments
Capital expenditures 1 663 2 250
KGHM Polska Miedź S.A.2)
[mn PLN] 3)
Other expenditures, including loans 351 365
0% 10% 20% 30% 40% 50% 60% 70% 80% 90% 100%
Financial leverage of the
KGHM Group ≤ ×2
5)
[net debt / adjusted EBITDA] 4)
1.4
1) Sum of costs of extraction, floatation and metallurgical processing per cathode, together with support functions and cathode selling costs, adjusted by the value of inventories of
half-finished products and work in progress, less the value of anode slimes and divided by the volume of electrolytic copper production from own concentrates
2) Capital expenditures – excluding development work – uncompleted; Other expenditures – acquisition of shares and investment certificates of subsidiaries and associates and
loans granted
3) Reflects an adjustment of assumptions pursuant to regulatory filing 9/2020 dated 12 May 2020
48 4) Adjusted EBITDA for 12 months, to the end of the reporting period, excluding EBITDA of the joint venture Sierra Gorda S.C.M.
5) Level of net debt/EBITDA ≤ 2 related to the Financial Liquidity Policy adopted by the Company and is not part of the budget assumptions of KGHM for 2020C1 unit cost1)
KGHM Group
C1 – KGHM Polska Miedź S.A. The decrease in C1 cost versus the
C1 – Group [USD/lb] first 9M of 2019 was due to the
[USD/lb] incl.the
-7% 9M/9M minerals
savings program, the weakening of
1.71 1.60 extraction
tax
0.49 0.43
the PLN vs the USD and to a lower
-6% 9M/9M minerals extraction tax charge
1.23 1.16
The increase in C1 by 5% in KGHM
9M 2019 9M 2020 INTERNATIONAL was due to higher
1.69 mine operating costs, which was
1.59 C1 – KGHM INTERNATIONAL partially offset by a higher copper
[USD/lb]
0.37 +5% 9M/9M
sales volume and by higher revenues
0.33
1.79 1.87 from sales of associated metals
incl. the
minerals
extraction The decrease in C1 cost in Sierra
tax
Gorda by 11% was due to a higher
9M 2019 9M 2020
copper sales volume, lower fuel and
C1 – Sierra Gorda energy prices and to reduction of
[USD/lb] certain categories of costs, including
1.32 1.26 -11% 9M/9M external services (improvement was
1.39 1.24 achieved with lower revenues from
sales of associated metals), and to
advancement of the CAPEX and OPEX
9M 2019 9M 2020
9M 2019 9M 2020 savings program
49 1) C1 cost - cash cost of concentrate production reflecting the minerals extraction tax, plus administrative expenses and smelter treatment and refining charges (TC/RC), less
depreciation/amortisation and the value of by-product premiums, calculated for payable copper in concentrateExpenses by nature
KGHM Polska Miedź S.A.
Expenses by nature
[mn PLN]
Expenses by nature decreased by
-0.3% 9M/9M
PLN 35 million y/y
11 125 11 090
Minerals extraction tax
recognised in expenses
1 192 1 120 by nature
Minerals
3 941 extraction
Purchased metal- 3 692 3 771 tax recognised in
2 888 2 874 3 636 3 513
bearing materials expenses by
nature
Other taxes, 7 045 7 096
charges & costs 375 361 +1% 9M/9M
Depreciation
/amortisation … … Purchased metal-
bearing materials
External services
1 281 1 259 Expenses by nature
excluding purchased
Other materials Expenses by
metal-bearing
and energy 1 768 1 746 materials and the nature excl.
minerals extraction tax 2 466 2 354 purchased
metal-bearing
Labour costs
materials and
the minerals
2 658 2 774 extraction tax
9M 2019 9M 2020 Q3 2019 Q4 2019 Q1 2020 Q2 2020 Q3 2020
50Operating results
KGHM Group
Change in adjusted EBITDA1) Adjusted EBITDA
[mn PLN]
[mn PLN]
+7% 9M/9M
+184 +257 4 418 4 418
4 112
4 112
-15 192
-120 207
779
522
395
515
2 868 3 052
9M 2019 KGHM KGHM Sierra Other 9M 2020
Polska Miedź S.A. INTERNATIONAL Gorda
9M 2019 9M 2020
Record quarterly adjusted Group EBITDA (+PLN 306 mn) due to higher results of
KGHM INTERNATIONAL Other segments
Sierra Gorda (+PLN 257 mn; +49%) and KGHM Polska Miedź (+PLN 184 mn; +6%)
KGHM Polska Miedź S.A. Sierra Gorda (55%)
51 1) Sum of segments; adjusted EBITDA = EBITDA (profit/(loss) on sales + depreciation/amortisation) adjusted by impairment losses on non-current assetsFinancial results
KGHM Group
1172
Profit for the period -30% 9M/9M
[mn PLN] consolidated net profit for the first 9 months of 2020
Group profit for the period lower by PLN 494 million (-30%)
mainly due to:
[PLN mn]
a lower result on operating activities
a lower result on exchange differences
a lower result on the measurement and realisation of derivatives
alongside a lower tax charge
1 666 + 338
- 66 1 172
- 105 -8 + 51
- 289 - 218
- 60
- 137
A deterioration in the operating result
by PLN 122 million
Profit for Change in Change in Change in Other operating Profit/loss on Exchange Measurement Change in CIT Other Profit for
9M 2019 revenues expenses by inventories, work costs involvement in differences and realisation 9M 2020
nature in progress joint ventures of derivatives
52EBITDA and profit for the period
KGHM Polska Miedź S.A.
Adjusted EBITDA Profit for the period
Higher EBITDA with [mn PLN] [mn PLN]
lower net standalone +6% 9M/9M -30% 9M/9M
profit 2 868
3 052
EBITDA higher by 6% vs the
1 663
corresponding period of 1 156
2019
Lower net profit of PLN 494
mn (-30%) than in the first 9M 2019 9M 2020 9M 2019 9M 2020
9M of 2019 mainly due to a
436
change in the measurement 949
751 900 1 031 1 121 399 348 409
of financial assets -399
Q3 2019 Q4 2019 Q1 2020 Q2 2020 Q3 2020 Q3 2019 Q4 2019 Q1 2020 Q2 2020 Q3 2020
53Cash flow
KGHM Group
[mn PLN]
+ 519
+1 300
- 444
+1 879
-2 487 1 119
1 016 - 207
- 248
- 149 - 60
Cash as at Profit/loss before Exclusion of Income tax paid Change in working Acquisition of Acquisition of Proceeds Interest paid Other Cash as at
31 Dec 2019 income tax income and costs capital property, plant shares in joint from/repayments 30 Sept 2020
and equipment ventures of borrowings
and intangible
assets
54Net debt of the KGHM Group
As at the end of Q3 2020
Net debt / adjusted EBITDA Main factors affecting interest-bearing debt in the first
9 months of 2020
1.8 (Increases in debt)
1.5 1.4
Cash expenditures on property, plant and equipment (PLN 2 487 mn)
The minerals extraction tax (PLN 1 120 mn)
30-09-2019 31-12-2019 30-09-2020 Equity increase in Sierra Gorda (PLN 216 mn)
Borrowing costs recognised in cash flow (PLN 149 mn)
An increase in inventories (higher by PLN 76 mn)
KGHM Group net debt
An increase in trade and other receivables (higher by PLN 16 mn)
[mn USD] [mn PLN]
(Decreases in debt)
2 102 1 815 1 796 1 752 8 407 6 891 7 449 6 976 Positive cash flow from operating activities, excluding the change
1 659 6 413
in working capital and the minerals extraction tax (PLN 3 795 mn)
An increase in trade and other payables, incl. trade liabilities transferred to the
30-09-19 31-12-19 31-03-20 30-06-20 30-09-20 30-09-19 31-12-19 31-03-20 30-06-20 30-09-20 factor (higher by PLN 671 mn)
Positive exchange differences (a decrease in PLN-denominated debt by PLN 73 mn)
Change in net debt
[mn PLN]
+230 +36
6 891 -102 -569 -73 6 413
31-12-2019 Impact of change in cash Cash flows Exchange differences Accrued interest Other 30-09-2020
on net debt
55Advancement of the KGHM Group’s strategy
4 strategic
     Pokłady     directions for KGHM’s development
              możliwości
     The review of the Strategy of KGHM Polska Miedź S.A. for 2019-2023

            #        4E
                                                          ELASTICITY,          EFFICIENCY
                                                            FLEXIBILITY

                                                          ECOLOGY,
                                                      SAFETY AND SUSTAINABLE   E-INDUSTRY
                                                           DEVELOPMENT

57
Strategicmożliwości
Pokłady priorities
#1 Higher #2 Energy #3 International
assets 2.0
#4 Long-term
production independence financial
strategy
#5 Ecosystem #6 Technologies #7 New quality
innovation of the future Safety and
for KGHM development
58Strategy możliwości
Pokłady in practice
Selected key operating initiatives (1)
AREA MAIN TARGET SELECTED EFFECTIVENESS MEASURES
Maintenance of
cost-effective
domestic and foreign
production Level of production in Poland of Average yearly Yearly average of daily ore
mined Cu in ore with an annual C1 metallurgical production in processing in Sierra Gorda
cost not higher than 3,800 USD/t in the years 2019-2023 from 2020
the years 2019-2023
Increased efficiency
and flexibility of the
KGHM Group in
managing its Polish Level of metallurgical An increase in the share of Amount by which the needs of
and international production from highly processed copper KGHM Polska Miedź for
assets purchased products in the Group’s electricity from its own
copper-bearing materials, total sales by the end of 2030 sources of energy generation
including scrap, to 2030 and renewable energy sources
will be satisfied by the end of 2030
59Strategy możliwości
Pokłady in practice
Selected key operating initiatives (2)
AREA MAIN TARGET SELECTED EFFECTIVENESS MEASURES
Increase the efficiency
of the KGHM Group
through innovation Increase expenditures on Ensure that all of the innovation Level of funds for R&D and
innovation and R&D work projects are realised, pursuant to the innovation in the years
to the level of 1% of KGHM rules of a coherent model of 2019-2023 to meet the
Polska Miedź S.A.’s innovation management and research challenges faced by KGHM
revenues by 2023 and development work (R&D) in the Polska Miedź S.A. in the
KGHM Group, in the years 2019-2023 Core Business
Ensure long-term
financial stability and
the development of
mechanisms Basing of the Group’s Shorter cash Efficient management
supporting financing on long-term conversion cycle of market and credit
instruments risk by the KGHM Group
further development
60Strategy możliwości
Pokłady in practice
Selected key operating initiatives (3)
AREA MAIN TARGET SELECTED EFFECTIVENESS MEASURES
Implementation
of systemic solutions
aimed at increasing Ensure financial stability of Increase in the efficiency of Minimum level of achievement
the KGHM Group’s the Polish-based Group support functions as a result of key strategic targets and of
value companies, on the basis of of centralisation and the yearly goals assigned to
their own activities digitalisation of key them, in each of the years the
back-office processes by 2023 strategy is in force
Growth based on the
idea of sustainable
development and
safety as well as
enhancing the Minimum level of annual Maintain a participation Level of commitment and
Group’s image of improvement of LTIFR (Polish budget at the level of 20% of satisfaction of the KGHM
social responsibility assets) and TRiR (International the amount of deductions for Group’s employees based on
assets) donations from the minerals measures defined during
extraction tax by 2020 implementation, by 2023
61Consistent advancement of the strategy
Key areas – 4E
Rational management of the Company’s resources
Adaptation of the operating Optimisation of metallurgical production
Elasticity/
model for the KGHM Group Exploration projects in Poland
Flexibility
to market conditions Optimisation of the international assets portfolio
Higher financial security
Improved efficiency Programs to reduce energy consumption
Efficiency Replacement and availability of mining machinery
in the use of resources Innovative solutions to optimise production processes; CuBR program
and production processes Work on increasing the use of factoring
Compliance with BAT conclusions
Integration of the KGHM Group Program to Improve Occupational Health and Safety
Ecology
around the idea of sustainable Circular Economy Program
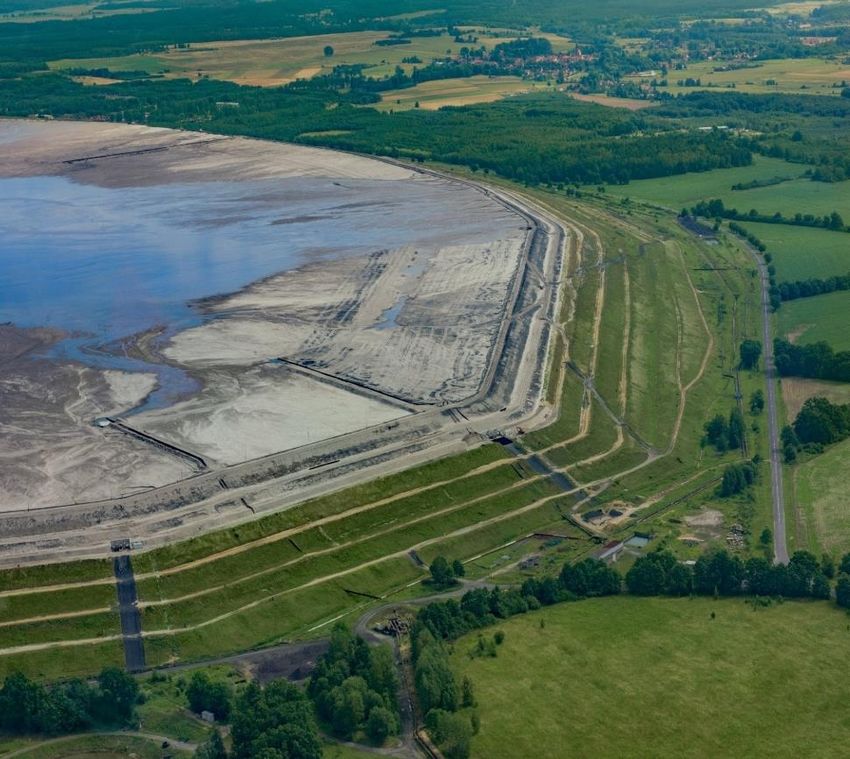
development Development of the Żelazny Most Tailings Storage Facility
Electromobility and RES investments development program
Transformation of Work on projects comprising the KGHM 4.0 Program
E-Industry
technology under the Advancement of projects related to automation of the production line in
the mining and metallurgical divisions
KGHM 4.0 Program
62A consistent and responsible investment program
Capital expenditures by KGHM Polska Miedź S.A. for the first 9 months of 2020
CAPEX execution in 9M 2020
by area by category
Mining (66%) Replacement (33%)
Metallurgy (30%) Maintaining mine production (34%)
Other activities (1%) Mine development (33%)
Leasing IFRS 16 (3%)
Development - uncompleted
1663
33%
1 099
56 1 1 663* 1 608
mn PLN 14 PLN mn PLN mn 34%
33%
CAPEX execution in 9M 2020
493
*incl. Leasing IFRS 16
2 250 mn PLN
CAPEX and budget after the first 9 months of 2019
CAPEX target for 2020 1 611 mn PLN 2 516 mn PLN
CAPEX execution in 9M 2019 CAPEX budget target for 2019
63Selected development projects
CAPEX execution for the first 9 months of 2020
PLN 328 mn PLN 8.6 mn PLN 14.2 mn
Deposit Access Program KGHM 4.0 Program Exploration projects
30.1 km of tunneling were excavated CRM system implemented – system handed over for – in the following concessions:
The GG-1 shaft reached a depth of 1 210.1 m use
„RETKÓW-ŚCINAWA”: geological documentation being
GG-2 „Odra” shaft – changes made to Phase II of implementation of the CMMS system developed for a section separated from the Retków-Ścinawa
commenced and Głogów concession
planning documentation, talks carried out
with property owner For projects related to the National Cyber Security „GŁOGÓW”: terrain restoration underway after final drillings
System and enhancing IT security in the KGHM
Gaworzyce shaft – the spatial plan was „PUCK”: work carried out to prepare for sinking of another
Group, the scope of integration of the SIEM system
handed over; actions continue regarding drillhole
with the IT systems of the industrial infrastructure in
siting of the shaft
all of the divisions of KGHM was increased
PLN 242 mn PLN 76 mn New Development Programs
Development of Żelazny Most Tailings Program to adapt the technological installations
Work carried out on Investment Phase of new
Storage Facility – Southern Quarter to BAT Conclusions
development projects under Strategic Programs:
Southern Quarter – work advancing on Głogów Smelter/Refinery: construction and start-up of the Construction of a Solar Power Plant – Energy Development
schedule, 85% of the planned work has been de-leaded slag transport installation completed, enabling its Program – two projects begun – a terrain use concept developed
completed processing by the flash furnace and of bypass gases in the
Construction of a CuOFE+alloy production line - Program to
Tailings Segregation and Thickening piping system of the flash furnace; in other projects,
Extend the Value Chain,
Station – work continues on building internal construction/assembly work is underway
under the program to Intensify Production of Oxygen-Free
installations for the hall, 73% of the planned Legnica Smelter/Refinery: design work performed, pre- Copper at Cedynia – project documentation prepared for the
work has been completed fabricated parts received, executory documentation, work installation
underway to obtain administrative decisions
64Energy Development Program, including RES
Activities in 9M 2020
Development of renewable Energy sources Optimisation and development of
conventional sources
A contractor was selected for the project „Design for a PV power plant together with
obtaining a construction permit” for the Obora Sandpit and HM Głogów I-III sites1) The simultaneous pilot start-up of two gas-
The terrain use concept adopted foresees an increase in installed capacity to: fired turbines at the gas-steam block in
– 8 MWp from 5 MWp for the Obora Sandpit Głogów by 19 July 2020
– 6.5 MWp from 4 MWp for the HM Głogów I-III site This increase in electricity production by
Applications were submitted to alter the urban planning documentation to enable approx. 16 GWh, resulted in:
the siting of a PV installation with a capacity of over 100 kW on terrain belonging to – A lower cost to obtain power by
KGHM in: approx. PLN 1.8 mn
– The Lubin municipality with a potential installed capacity of approx. 20 MWp – Avoiding CO2 emissions by more than
– The Warta Bolesławiecka municipality for a site with a potential of over 50 4 kt
MWp
65 The numerical designation HM Głogów I-III refers to the plot numbersPokłady
The first możliwości
photovoltaic power plants
projects
PVPP Piaskownia Obora
Installed power 8 MW Projected avoided emissions
Estimated production 8.5 GWh over 25 years:
CO2 more than 80 kt
SOx more than 70 tonnes
NOx more than 70 tonnes
CO more than 30 tonnes
PM more than 4 tonnes
PVPP HMG I-III complex
Installed power 6.5 MW Projected avoided emissions
Estimated production 6.9 GWh over 25 years:
CO2 more than 70 kt
SOx more than 60 tonnes
NOx nearly 60 tonnes
CO more than 25 tonnes
PM more than 3 tonnes KGHM ZANAM has begun construction of
the only solar power plant in Poland based
66 on Industry 4.0 technology in LegnicaSupporting slides
Reasons to invest in KGHM

       A leading player on the copper                                                  A reliable producer,
     and silver market in terms of mine   A diversified portfolio of assets at     a trusted business partner
      output and size of documented       various stages of development to        and a company committed to
        resources, in mining-friendly     guarantee continued operations            sustainable development
                jurisdictions

                                                                                    A rational leveraging policy
         Experienced management                      A solid outlook                 with a safe level of the net
         with a proven track record              for the copper market           debt/EBITDA ratio and long-term
                 of success                  in the medium-to-long term           financing ensured through the
                                                                                        Bond Issue Program

68
Transparent Group structure
General Shareholders Meeting
Supervisory Board
Management Board
KGHM Polska Miedź S.A.
(Lubin, Poland)
(Listed on Warsaw Stock Exchange since 1997)
KGHM International Ltd.
Production Development Group of subsidiaries
(Vancouver, Canada)
Development
divisions projects
Operations Role in KGHM Group
projects
Robinson Mine Victoria (Ontario) Lubin Mine Deep Głogów Core-Services
(Nevada) Ajax (BC) Polkowice-Sieroszowice Mine Exploration Projects Multi Utilities
Carlota Mine Exploration Rudna Mine Knowledge (R&D)
(Arizona) Projects CSR
Concentrators Division
McCreedy West Sierra Gorda Non-core
(Ontario) Oxide Głogów I Smelter/Refinery
Sierra Gorda Głogów II Smelter/Refinery
(Chile) Legnica Smelter
Franke (Chile) Cedynia Wire-Rod Plant
69Committed to solid corporate governance
Independent directors on the board KGHM’s Corporate Governance is guided by
international standards and follows best practices:
All members of KGHM’s Supervisory Board are appointed by
2 Independent Directors
the General Shareholders Meeting
Other Directors
All of KGHM’s shares have equal voting rights (no preferred stock)
Employee Elected
1 5 5 independent members of the Supervisory Board 1)
Committees of the Supervisory Board:
– Strategy Committee
– Audit Committee
– Remuneration Committee
KGHM meets the top quality Corporate Governance Internal audit structure implemented across the KGHM Group -
standards of the Warsaw Stock Exchange consistent with the best international practices
(compliant with EU/OECD guidance) Code of Ethics – implemented in 2015
In 2018 KGHM joined the FTSE4Good index. Being a member of the FTSE4Good index series confirms
KGHM’s efforts in the field of environmental protection, social responsibility and corporate governance. KGHM perceives joining
the FTSE4Good index as an award for its solid performance in complying with demanding ESG standards.
70 1) According to criteria for independence set forth in point II.Z.4. of the Code of Best Practice for 11 WSE Listed Companies 2016You can also read