SECTORAL OUTLOOK BANKING SECTOR INSIGHTS - Weathering the Headwinds - Malaysian Rating Corporation ...
←
→
Page content transcription
If your browser does not render page correctly, please read the page content below

BANKING INSIGHTS

SECTORAL OUTLOOK

BANKING SECTOR INSIGHTS
Weathering the Headwinds

September 2019

Contacts
Mohd Izazee Ismail
Senior Vice President, Ratings
izazee@marc.com.my
(603) 2717 2947

Douglas De Alwis
Analyst, Ratings
douglas@marc.com.my
(603) 2717 2965

BANKING REPORT

                    TABLE OF CONTENTS

Page

 2     MARC’S BANKING OUTLOOK

 3     INTRODUCTION

 4     LOWER LOAN GROWTH

 4     •    Days of rapid growth are over
 5     •    Plateauing demand for loans from businesses enterprises
 6     •    Loan growth is driven by household segment
 8     •    Potential asset quality pressures from property market

 8     STABLE ASSET QUALITY

 9     •    High household debt poses headwind for retail-denominated loan books
 9     •    Regulatory and reporting requirements drive improved provisioning

 10    MODERATING PROFITABILITY

 11    REGULATORY CAPITAL BUFFERS REMAIN SIZEABLE

 12    •   Retails banks have stronger capital position relative to impairments

 13    SOUND FUNDING AND LIQUIDITY PROFILE

 13    •    Moderating CASA growth, but still sound funding profile

 14    THE NEXT WAVE FOR THE FUTURE

 14    •   Room for consolidation and restructuring
 14    •   Digitalisation in bank strategies
 15    •   Sustainability a key growth driver going forward

 16    MARC’S BANK ANALYSIS

 17    •    Malayan Banking Berhad
 19    •    CIMB Bank Berhad
 21    •    Public Bank Berhad
 23    •    RHB Bank Berhad
 25    •    Hong Leong Bank Berhad
 27    •    AmBank (M) Berhad
 29    •    United Overseas Bank (Malaysia) Berhad
 31    •    OCBC Bank Malaysia Berhad
 33    •    HSBC Bank Malaysia Berhad

                                                               www.marc.com.my     1
BANKING REPORT

MARC’S BANKING OUTLOOK

                     www.marc.com.my   2
BANKING REPORT

INTRODUCTION
•   Despite the challenging and uncertain economic environment, domestic commercial banks’ performance
    has thus far remained on a good footing by all measures, from earnings and revenues to capital levels,
    asset quality and performance ratios. Overall impaired loans and delinquencies for banks have remained
    low. Banks have also strengthened loan loss provisioning requirements pursuant to their adoption of
    MFRS 9 Financial Instruments in 2018. The provisioning practice requires additional provisions to be set
    aside at the initiation of a financing to cover expected losses. Banks’ burden of adjustment is expected
    to be relatively moderate based on available quantitative estimates of the corresponding decrease in
    regulatory capital.

•   Economic growth, while moderating, remains healthy and should help keep credit quality for the banking
    sector within predictable boundaries. Overall, we expect asset quality to remain reasonably well
    controlled. MARC expects system-wide profitability to remain relatively healthy despite moderating
    earnings momentum on account of slowing loan growth and compressing net interest margins (NIMs).
    Pressure on profits has also come from the rising cost of risk management and compliance. Banks’
    operational risk management and compliance burden have increased significantly following the
    introduction of new regulations and financial reporting requirements since the global financial crisis.

•   Crucial to the near-term outlook will be the supportiveness of the fiscal and monetary policy mix in the
    months ahead. We see the rate cut in the overnight policy rate (OPR) by Bank Negara Malaysia (BNM)
    in May 2019 as a pre-emptive move to provide support to the domestic economy amidst signs of
    tightening financial conditions.

                                                                                 www.marc.com.my        3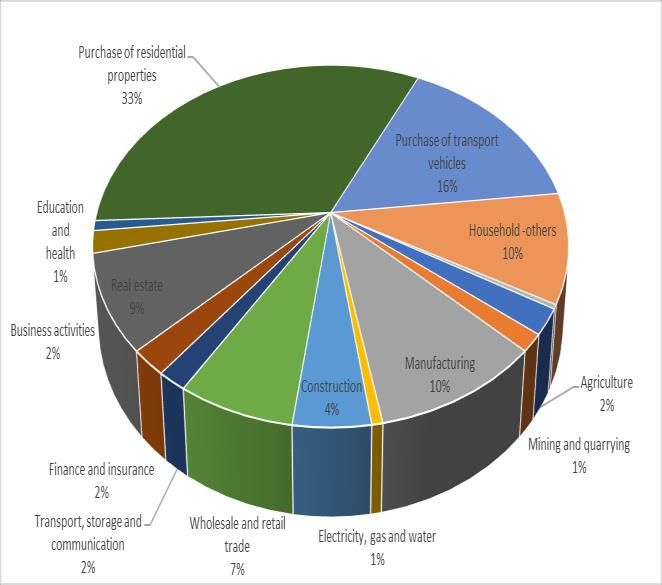
BANKING REPORT

LOWER LOAN GROWTH

Days of rapid growth are over

    Exhibit 1: Loans growth (y-o-y)
    18.0%                                                                        16.0%
    16.0%                                                                        14.0%
    14.0%                                                                        12.0%
    12.0%
                                                                                 10.0%
    10.0%
                                                                                 8.0%
     8.0%
                                                                                 6.0%
     6.0%
     4.0%                                                                        4.0%

     2.0%                                                                        2.0%
     0.0%                                                                        0.0%
             2008 2009 2010 2011 2012 2013 2014 2015 2016 2017 2018
                            Household            Non-household   Total (RHS)

    Source: BNM, MARC

As shown in Exhibit 1, the banking system’s loan growth has steadily declined since its last peak in 2011. In
2018, the banking system registered loan growth of 5.6% y-o-y. Even though this was higher than the 4.1%
registered in 2017, the loan growth was lower than its 2011 peak of 13.6%, as well as the 7.8% recorded in
the last cycle in 2009. The half-year numbers ended June 2019 showed a further decline in loan growth to
4.2% y-o-y. We believe banks could be showing greater credit risk aversion because of uncertainty over the
economy, among other factors. MARC expects loan growth of around 4%-5% for the whole of 2019.

The slowing pace of household loan growth has also occurred against the backdrop of BNM’s responsible
lending measures. With household debt as a percentage of income still high and not expected to reduce
meaningfully in the near term, a loosening of macroprudential measures to ease household leverage in relation
to household financing products is unlikely to happen any time soon. Elevated non-financial corporate sector
debt levels are also expected to put a dampener on the demand for funds among borrowers. The business
sector’s debt-to-equity ratio stood higher at 49.3% in 2018 from 39.1% in 2013 1. The main takeaway from
recent past defaults in the oil and gas sector is that at elevated debt levels, substantial stress events can very
quickly render debt much less affordable and potentially exert abrupt pressure on credit quality.

1
    BNM’s Financial Stability and Payments System reports

                                                                                        www.marc.com.my       4
BANKING REPORT

Exhibit 2: Credit-to-GDP growth (y-o-y)
    20.0%                                                                                                 160.0%

                                                                                                          140.0%
    15.0%
                                                                                                          120.0%
    10.0%
                                                                                                          100.0%

     5.0%                                                                                                 80.0%

                                                                                                          60.0%
     0.0%
                                                                                                          40.0%
    -5.0%
                                                                                                          20.0%

-10.0%                                                                                                    0.0%
                               GDP                                    Credit-to-GDP (RHS)

     Sources: Department of Statistics Malaysia, Bank for International Settlements

Rapid credit growth in previous years has steadily increased the ratio of the country’s credit-to-gross-domestic
product (GDP) (Exhibit 2). As at end-2018, Malaysia’s credit-to-GDP (defined as total credit to the private non-
financial sector as a percentage to GDP) stood at 134.0%, approaching those of high-income countries
(Singapore: 171.0%; US: 150.6%: UK: 170.7%)2. While high debt ratios can be more easily sustained in a low
interest rate environment, as is currently the case, what also counts is whether debt service can also be
sustainable as the banking sector adapts to an environment of lower growth. In this context, MARC considers
the recent trend of lower loan growth and macroprudential measures put into place to curb a debt surge to
be encouraging.

Malaysia’s total household debt-to-GDP ratio eased further for the fourth consecutive year to a still-high 83.0%
at end-2018 (2017: 83.8%) on the back of moderating housing and motor vehicle loan growths. Reduced
housing affordability, particularly among low- to middle-income households, points to slower growth in housing
loans in the months ahead.

Plateauing demand for loans from business enterprises

Exhibit 3: Loan growth by sector (y-o-y)
     25.0%

     20.0%

     15.0%

     10.0%

      5.0%

      0.0%
                 2013         2014             2015            2016            2017            2018
      -5.0%

              Manufacturing   Wholesale, retail, restaurants and hotels    Construction     Real estate

Sources : BNM, MARC

In 2018, construction activities in the civil engineering sub-sector remained active, underpinned by the steady
progress of ongoing transportation, petrochemical and power plant projects (Exhibit 3). Construction activity
is expected to benefit from the recently announced revival of the East Coast Rail Link and Bandar Malaysia

2
    Bank for International Settlements

                                                                                                                   www.marc.com.my   5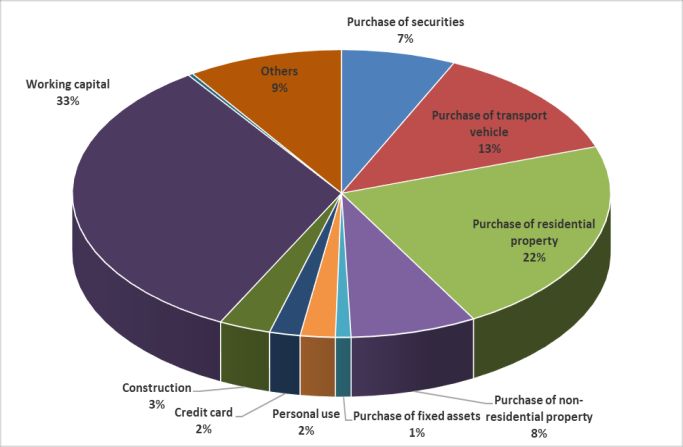
BANKING REPORT

projects. Last year’s post-election review of mega construction projects by the government resulted in a lower
order book replenishment of domestic contractors. Correspondingly, loans applied and approved for the sector
were also lower during the year (Exhibits 4 and 5).

  Exhibit 4: Loans applied by sector (RM mil)                                                                                Exhibit 5: Loans approved by sector (RM mil)

                      40,000.0                                                                                                                20,000.0
                      35,000.0                                                                                                                18,000.0
                                                                                                                                              16,000.0
                      30,000.0
                                                                                                                                              14,000.0
                      25,000.0
         RM million

                                                                                                                                 RM million
                                                                                                                                              12,000.0
                      20,000.0                                                                                                                10,000.0
                      15,000.0                                                                                                                 8,000.0

                      10,000.0                                                                                                                 6,000.0
                                                                                                                                               4,000.0
                       5,000.0
                                                                                                                                               2,000.0
                           0.0                                                                                                                     0.0

                      Manufacturing      Wholesale trade              Construction           Real estate                               Manufacturing                  Wholesale trade             Construction   Real estate

  Source BNM, MARC                                                                                                           Source BNM, MARC
             rce: BNM, MARC

The manufacturing and wholesale trade sectors picked up the slack from the moderation in construction
financing growth in 2018, evidenced by the increasing loan applications and approvals from these sectors.
Global frontloading activities, in anticipation of higher trade tariffs between the US and China, have supported
manufacturing activities, particularly in electrical and electronics production. However, this could be short-
lived as headwinds posed by the US-China trade war test the resilience of the mainly export-oriented
manufacturing sector in the months ahead.

Loan growth is driven by household segment

Exhibit 6: Household and non-household loans/financing of conventional and Islamic banks (RM mil)
             1,200,000.0

             1,000,000.0

                      800,000.0
RM million

                      600,000.0

                      400,000.0

                      200,000.0

                            0.0
                                                1999
                                  1997
                                         1998

                                                       2000
                                                              2001
                                                                     2002
                                                                            2003
                                                                                   2004
                                                                                          2005
                                                                                                 2006
                                                                                                        2007
                                                                                                               2008
                                                                                                                      2009
                                                                                                                              2010
                                                                                                                                        2011
                                                                                                                                                 2012
                                                                                                                                                        2013
                                                                                                                                                               2014
                                                                                                                                                                      2015
                                                                                                                                                                             2016
                                                                                                                                                                                    2017
                                                                                                                                                                                           2018

                                                          Household                                                          Non-Household

Sources: BNM, MARC

To date, loans to households continue to be the largest driver of banking sector loan growth, overtaking non-
financial corporate sector financing after the turn of the millennium (Exhibit 6). The increasing importance of
retail loan books to domestic banks coincided with rising household incomes and the expansion of the middle-
income population segment. Banks with strong market presence and extensive branch network continue
to possess competitive advantages at this juncture although the landscape could still change considerably in

                                                                                                                                                                                           www.marc.com.my                     6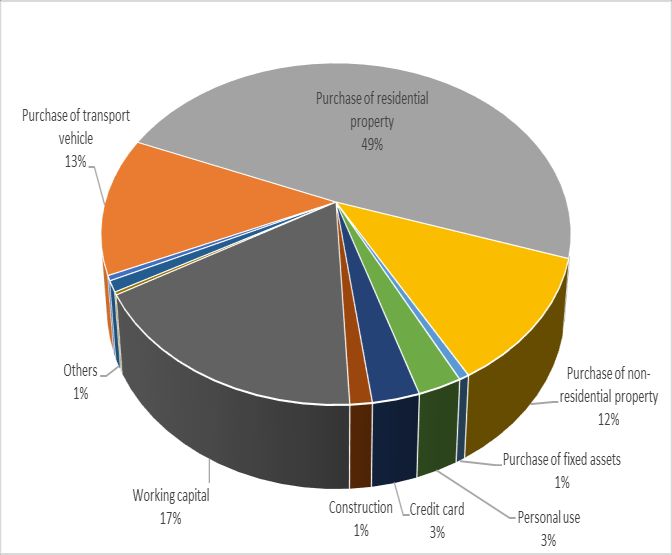
BANKING REPORT

response to the country’s changing demography, customer expectations, regulation and technology. Banks’
retail loan books provide greater loan diversification compared to corporates and about two-thirds of household
borrowing is secured by properties or securities, which is beneficial from a credit loss exposure perspective.
Support for this view comes from residential mortgages’ historically low write-off ratios relative to other loan
portfolio segments.

Exhibit 7: Loan growth by purpose (y-o-y)

  25.0%                                                                       16.0%
                                                                              14.0%
  20.0%
                                                                              12.0%
  15.0%                                                                       10.0%
                                                                              8.0%
  10.0%                                                                       6.0%
                                                                              4.0%
        5.0%
                                                                              2.0%
        0.0%                                                                  0.0%
                     2012       2013 2014 2015 2016 2017              2018
                                   Residential property
                                   Non-residential property
Sources : BNM, Marc

A significant portion of household loan growth came from residential lending, which contributed 44% of the
loan growth in 2018. Loans for residential property grew in line with the higher volume of residential property
transactions prior to 2015. This has since moderated mainly due to tighter lending criteria (Exhibit 7). In 2018,
lending applications and approvals for purchase of residential property were sustained at levels that should
keep the residential lending pipeline healthy for 2019 (Exhibits 8 and 9). Reduced housing affordability,
however, will continue to weigh on the growth of the banking system’s major loan portfolio.

Exhibit 8: Loan applied by purpose (RM mil)                           Exhibit 9: Loan approved by purpose (RM mil)
             140,000.0                                                                        60,000.0
             120,000.0
                                                                                              50,000.0
             100,000.0
RM million

                                                                                              40,000.0
                                                                                 RM million

              80,000.0
              60,000.0                                                                        30,000.0

              40,000.0                                                                        20,000.0
              20,000.0
                                                                                              10,000.0
                   0.0
                                                                                                   0.0

                 Residential property      Non-residential property                                 Residential property      Non-residential property
                 Construction              Working capital                                          Construction              Working capital

Sources : BNM, MARC                                                             Sources : BNM, MARC

                                                                                                                           www.marc.com.my               7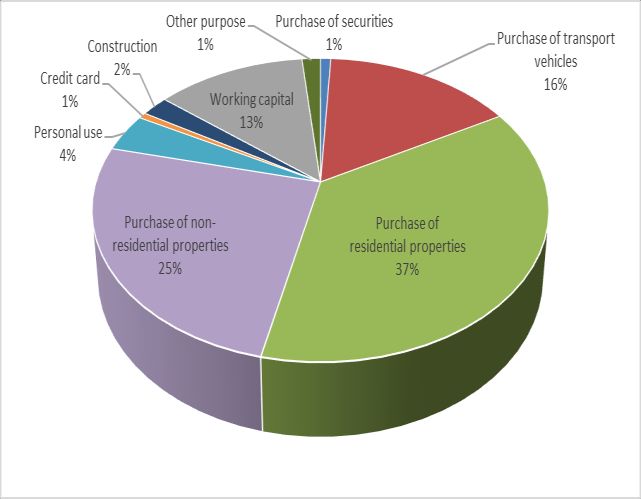
BANKING REPORT

Potential asset quality pressures from property market

Property sector financing growth has slowed since 2016 as a consequence of macroprudential measures
implemented to cool the property market. In 2018, Malaysian banks’ total exposure to the domestic property
market grew at a slower pace of 6.0% (2015-2017 average: 8.9%). Growth in applied and approved loans for
residential properties was somewhat muted at -0.1% and 1.2% in 2018 compared to the double-digit growth
recorded the year before. At over 33% of their total lending in 2018, residential mortgages remain a substantial
part of commercial banks’ (including Islamic banks) retail lending. Potential areas of credit risk that warrant
monitoring are commercial real estate credit exposures in the oversupplied luxury high-rise residential, office
space and shopping complex segments. Given the current property overhang levels across the residential and
commercial sectors, asset quality could noticeably decline for banks with exposures at the weaker end of the
credit quality spectrum if the economic environment weakens. Overall, we believe that there is no near-term
recovery in sight for the property market given the affordability issues, rising unsold units and the challenging
economic outlook. Moreover, the banking system has not been tested by a housing downturn since 1998.
Nevertheless, the cooling measures instituted by the government to curb property market speculation have,
in our view, helped contain the risk of a potential housing bubble to some extent.

STABLE ASSET QUALITY
    Exhibit 10: Gross impaired loan ratio (%)                    Exhibit 11: Impaired loans (RM mil)
     5.00%                                                                      20,000.0
     4.50%                                                                      18,000.0
     4.00%                                                                      16,000.0
     3.50%                                                                      14,000.0
     3.00%
                                                                   RM million

                                                                                12,000.0
     2.50%                                                                      10,000.0
     2.00%                                                                       8,000.0
     1.50%                                                                       6,000.0
     1.00%                                                                       4,000.0
     0.50%                                                                       2,000.0
     0.00%                                                                            -
             2009 2010 2011 2012 2013 2014 2015 2016 2017 2018                             2009 2010 2011 2012 2013 2014 2015 2016 2017 2018

                        Household         Non-household                                          Household         Non-household

    Sources: BNM, MARC

Exhibit 10 shows that the quality of banks’ loan portfolio remains stable, as measured by the gross impaired
loans (GIL) ratio which stood at 1.45% as at end-2018 (end-2017: 1.55%). The GIL ratio stood at 1.57% as
at end-June 2019. The stable asset quality can be attributed to interest rates which remain relatively low by
historical standards, sustained economic growth, stable employment and adequate credit risk management.
The level of impaired financing in banks’ corporate loan books declined following a sharp increase in impaired
oil and gas sector (O&G) lending exposures in the immediately preceding four-year period (Exhibit 11). Most
business sectors exhibited either broadly stable or improved credit performance as at end-2018, as measured
by gross delinquency rates, with the exception of the wholesale & retail trade and transport & storage services
segments. The gross impaired loans ratio of small and medium enterprises (SMEs) remained stable at 2.7%
as at end-June 20193 (2018 GIL: 2.4%). Accounting for more than a third of Malaysia’s GDP and 50% of total
commercial loans in the banking system, the SME financing segment is typically a significant component of a
commercial bank’s loan portfolio. Looking ahead, we expect banks to uphold underwriting standards for SME
financing to offset asset quality pressure.

3
    Source: BNM

                                                                                                              www.marc.com.my                  8
BANKING REPORT
High household debt poses headwind for retail-dominated loan books
Household debt burdens remain high, at 83.0% of GDP (2017: 84.2%) in 2018. Strong household spending
has been a factor behind the increase in household debt, which in turn makes households sensitive to increased
unemployment and higher interest rates. As a share of GDP, the total banking system loans to households
excluding lending by non-banks was 69.1% (2017: 69.3%). For now, employment trends, real wage growth
and low interest rates continue to support expansion in housing residential property lending. However, given
the high levels of household debt, a sharp increase in benchmark interest rates could lead to increased loan
repayment delinquency, although this is an unlikely prospect at this juncture. If the interest rate rise were to
be gradual rather than sharp, the impact on banking sector asset quality would be less severe.
We note that the GIL ratios actually dropped for the motor vehicles, personal financing and credit cards
segments of household financing in 2018 for both the banking system and non-bank financial institutions while
delinquencies trended down for all segments, including residential and non-residential property financing. Still,
higher incidents of impairment exhibited by banks’ personal and higher-valued residential property financing
portfolios suggest that these exposures continue to warrant proactive monitoring. We believe that the high
level of household indebtedness and the sensitivity of GIL ratio to economic growth warrant a more cautious
view of banking system asset quality.
Regulatory and reporting requirements drive improved provisioning
Provisioning against loan losses has, to a large extent, been driven by regulatory directives on collective
impairment allowances (CA) and regulatory reserves (RR) for unidentified expected future loan losses. In early
2014, BNM had directed all banks to maintain minimum CA in combination with RR amounting to 1.2% of total
loans, net of individual impairment allowances (IA) by end-2015. This ensured impairment provisions could
keep pace with strong credit growth notwithstanding accounting conventions which encouraged laxity in the
building of loan loss absorption buffers. Banks’ loss allowances for non-credit impaired exposures had declined
significantly following the full adoption of MFRS 139 Financial Instruments: Recognition and Measurement,
which commenced in 2012. The CA were left to the discretion of the banks whereas previously the central
bank had set a minimum general provisions requirement at 1.5% of total loans.
Under MFRS 9, reserving for potential losses begins when loans are first booked, reducing the need for rapid
additions when delinquencies and defaults soar as is typically observed leading up to and during a recession.
MFRS 9 increases the convergence of reporting and regulatory standards (Basel II/III) with its two-stage (12
month and lifetime) recognition of expected credit losses. Banks using the advanced internal ratings-based
approach will be able to leverage some of the data used by the Basel model to calculate IFRS 9 expected
credit loss. Our broad view is that the adoption of an expected loss framework for the recognition of impairment
allows for a more accurate assessment of banks’ financial positions and should engender financial system
stability by promoting prudent risk taking.
Under the more recent financial reporting guidelines issued by BNM in February 2018, the minimum two-stage
loss allowances for non-credit impaired exposures and RR to be set aside by banks under MFRS 9 is 1.0% of
total credit exposures, net of IA. The minimum requirement also extends to banks’ securities holdings.
Importantly, the MFRS 9 pre-migration increases in CA and RR help lower the risk of any sudden adverse
impact on banks' capital ratios caused by transitioning to the new approach. The longer-term effects of MFRS
9 on loan origination will become clearer in time, among which it is expected to lessen the procyclicality of
bank lending.
Detailed analysis of loan loss reserve coverage across banks shows that there is notable dispersion in banks’
loan loss reserve levels with some banks having far stronger loss reserve coverage than others. When
assessing the strength of banks’ capital buffers, we also consider how well their loan loss reserves position
them for a credit cycle downturn. Being mindful that in all likelihood, loan losses will trend up from current
www.marc.com.my 9BANKING REPORT
levels, we remain concerned that banks with loan loss reserve coverage ratios of below 100% may be entering
the late stages of the credit cycle with a low loan loss reserve cushion relative to their loan portfolio.
MODERATING PROFITABILITY
Exhibit 12: Interest rate spread – weighted average lending rates and fixed deposit rates (%)
3.50%
3.00%
2.50%
2.00%
1.50%
1.00%
0.50%
0.00%
2009 2010 2011 2012 2013 2014 2015 2016 2017 2018
3-months 6-months 9-months 12-months
Sources: BNM, MARC
In 2018, we saw lower profit growth for the banking system mainly due to higher funding costs and an increase
in MFRS 9-related provisions. Major domestic banks saw their bank-level pre-tax profit increase 3.95% y-o-y,
significantly lower than the 14.11% growth registered in 2017. While the higher cost of funds and lower non-
interest income had pressured earnings growth (Exhibit 12), the lower operating costs from cost-saving
initiatives have provided some reprieve to the overall profitability. Banks also benefitted from higher trading
and investment income. Overall, returns on assets and equity of the banking system for 2018 came in lower
compared to the year before (Exhibit 13).
Exhibit 13: Return on equity and cost-to-income ratio (%)
50.0% 18.0%
49.0% 16.0%
48.0% 14.0%
12.0%
47.0%
10.0%
46.0%
8.0%
45.0%
6.0%
44.0% 4.0%
43.0% 2.0%
42.0% 0.0%
2013 2014 2015 2016 2017 2018
Cost-to-income ROE (RHS)
Sources: BNM, MARC
www.marc.com.my 10BANKING REPORT
For 2019, we believe that the banking sector’s ability to grow revenue will be challenged by lower credit
growth, the competitive squeeze on NIM and increased credit risks across the board. Spread-related income
growth is likely to become more of a challenge as the year wears on if spreads remain compressed and growth
in earning assets provides an insufficient offset. The impact will most likely be felt hardest by smaller banks
with limited branch network and undifferentiated franchises. Following BNM’s 25 basis points cut in the OPR
to 3.0% in May 2019, we expect banks’ NIMs to remain relatively stagnant or decrease in the months ahead.
This is because we anticipate deposit rates to display downward stickiness which, in turn, will limit the room
to cut lending rates.
Unlike past years in which profitability was boosted by high loan loss reserve releases and unusually low credit
costs, there are now noticeably fewer earnings sources to sustain a strong earnings momentum. Meanwhile,
domestic banks that have been reliant on market-sensitive treasury income in recent years to bolster their
bottom lines amid slower credit offtake and the benign interest rate environment would show higher earnings
volatility. Overall, our view is that revenue growth rather than credit costs poses the greatest risk to earnings
for domestic banks in 2019. The revenue growth challenges are likely to result in a continued focus on cost
efficiency, which has been aided in some respects by increased digitalisation in banking. Additionally, banks
also have to contend with higher regulatory and compliance costs. On this note, we believe that a focus on
long-term value by banks’ boards and executive management will be important to avoid across-the-board cuts
that might result in underinvestment in their future.
REGULATORY CAPITAL BUFFERS REMAIN SIZEABLE
Exhibit 14: Capital base (RM mil) Exhibit 15: Risk weighted asset and CEI1 capital growth
(y-o-y)
350,000.0 20.0%
300,000.0
250,000.0 15.0%
RM million
200,000.0
10.0%
150,000.0
100,000.0 5.0%
50,000.0
0.0%
0.0
Jul-16
Jun-14
Nov-14
Apr-15
May-17
Jan-14
Sep-15
Feb-16
Dec-16
Mar-18
Aug-18
Oct-17
Jan-13
May-16
Mar-17
Jan-18
Sep-14
Feb-15
Nov-13
Apr-14
Jul-15
Dec-15
Nov-18
Jun-13
Oct-16
Aug-17
Jun-18
-5.0%
CET1 Capital Tier 1 and Tier 2 Capiral Total Capital
RWA CET1 capital
Banks remained well-capitalised with common equity tier 1 (CET1) and total capital adequacy ratios standing
at 13.1% and 17.4% as at end-2018. While a significant portion of the capital base is currently contributed by
high quality CET1 capital (Exhibit 14 and 15), we expect banks to increasingly rely on issuances of capital
securities to support asset growth going forward. At the same time, we believe that Basel III’s regulatory
capital reforms raise important questions on banks’ sustainable dividend-paying capability in a lower growth,
low interest rate environment. As such, dividend payout ratios can no longer purely be a function of accounting
earnings. Accordingly, dividend policies must now address banks’ risk profiles and projected growth rates.
www.marc.com.my 11BANKING REPORT
Banks have been building their CET1 capital by retaining earnings and raising new capital, while also increasing
their reliance on capital securities. Banks with strong earnings generation capacity and capital market access
generally have greater capital raising flexibility. Given that high dividend payouts have been a norm for the
banking sector, the impact of the Basel III regulatory capital rules on individual banks’ future dividend-paying
capacity will be an increasing source of equity holders’ focus. On a related note, the banking system’s ROE
has been steadily declining to 13.1% in 2017 and 12.6% in 2018 from 15.9% in 2013.
Retail banks have stronger capital position relative to impairments
Exhibit 16: Selected banks’ net impairment-to-core capital, core capital-to-RWA and allowance-to-impairment ratios
Sources: Banks’ financials, MARC
The dispersion in banks’ loan loss reserve coverage sufficiency (Exhibit 16) suggests that the regulatory capital
ratios of some banks have stronger underpinnings than others. MARC notes that the capital position of banks
with a strong presence in the retail loan segment such as Public Bank and Hong Leong Bank is less susceptible
to credit quality issues given their relatively low impairments and higher provisions. On the other hand, the
forward-looking provisions for loan losses set aside under MFRS 9 provide increased assurance that banks
have the required reserves for future loss potential for new financing bookings.
www.marc.com.my 12BANKING REPORT
SOUND FUNDING AND LIQUIDITY PROFILE
Moderating CASA growth, but still sound funding profile
Banks’ funding profiles remain sound overall with a loan-to-fund ratio of 82.7% as at end-2018. Low-cost core
deposit growth has not kept up with the pace of loan growth, as reflected in the rise of loans-to-customer
deposit (LDR) in the last 10 years (Exhibit 17). Retail deposits from households, both savings as well as fixed
deposits, have been charting slower y-o-y growth. Apart from searching for yield in equities, unit trusts and
other high-yielding assets, we suspect that deposits could also be growing at a slower clip because of higher
spending of disposable income, especially on housing. Additionally, the growing presence of digital wallets
would also provide some competition for deposits for banks. Hence, we believe that it will be challenging,
amid the increased competition for retail deposits, to reprice these deposits with the 25 basis points cut in the
OPR in May 2019.
With loan growth outstripping deposit growth, banks have been increasingly diversifying their funding sources
(Exhibit 18). Shifts in banks’ funding composition towards hybrid capital instruments, issued to comply with
BNM’s Basel III regulatory capital requirements and a higher level of medium-term debt, would mitigate
funding vulnerabilities otherwise emerging from a high sustained LDR.
Exhibit 17: Loans-to-customer deposits (%) Exhibit 18: Funding composition (%)
18.0% 120.0%
16.0%
100.0%
14.0%
12.0% 80.0%
10.0%
60.0%
8.0%
6.0% 40.0%
4.0%
20.0%
2.0%
0.0% 0.0%
2008 2009 2010 2011 2012 2013 2014 2015 2016 2017 2018
Loans-to-customer deposits Loan growth
Customer deposit growth
Sources: BNM, MARC Sources: BNM, MARC
Banks have notably become more aggressive about competing for retail deposits during the period of transition
towards full implementation of Basel III’s liquidity coverage ratio (LCR) requirements on January 1, 2019, with
the lower run-off rate that retail deposits attract in computation being a key consideration. While customer
deposits grew 6.7% in 2018 y-o-y driven by higher growth in deposits from individuals (Exhibit 19), low-cost
deposit growth has generally become harder to achieve. Most new deposits were in the form of fixed and
investment deposits (Exhibit 20).
www.marc.com.my 13BANKING REPORT
Exhibit 19: Deposit growth by source (y-o-y) Exhibit 20: Deposit growth by type (y-o-y)
Sources: BNM, MARC Sources: BNM, MARC
Going forward, apart from adding to NIM pressures, falling current and savings account (CASA) growth will
also impinge on banks’ ability to grow their loan books. The banking system’s LDR, despite falling in 2018, is
hovering close to its 10-year high. While we note that BNM has extended the observation period for net stable
funding ratio (NSFR) requirements by another year to 2020, competition for retail deposits is not likely to
abate, hence we believe that the redeeming factor here will be the expected moderation in loan growth in
2019. More importantly, the cost of funds is rising faster than loan yields.
THE NEXT WAVE FOR THE FUTURE
Room for consolidation and restructuring
The merger and acquisition (M&A) scene has been rather quiet this year. The last consolidation exercise
between Malaysia Building Society Berhad and Asian Finance Bank (forming MBSB Bank Berhad) was
completed in February 2018, creating the second-largest standalone Islamic bank after Bank Islam Malaysia
Berhad. Meanwhile, merger talks between Al Rajhi Banking & Investment Corp (M) Berhad and Malaysian
Industrial Development Finance Berhad are ongoing. In view of the increasingly competitive financial
landscape, it is important for banks to proactively enhance their capacities and capabilities. MARC believes
that besides charting out internal growth strategies, banks would also be carrying out rationalisation and
consolidation activities that would increase their scale and potentially reduce overall cost in the long run.
Although consolidation is not an immediate necessity given the banks’ resilient performance last year and up
to 1H2019, mergers would enhance the scale of a bank’s operations that may provide better synergies in
operations and cost efficiencies. Nevertheless, the main question for potential M&As remains the pricing and
valuation, which are often the main stumbling blocks.
Digitalisation in bank strategies
MARC has seen positive developments in Malaysia’s digital banking journey thus far. Most domestic banks are
embracing fintech, realising its importance in the fast-moving digital landscape. Some banks have made steady
headway by creating their own internal specialised fintech team, while others have sought collaborations with
fintech companies both locally as well as regionally. The major banks have made bigger strides in this area
which includes setting-up fully-digital banks as well as developing their own digital wallet platforms.
BNM and the Securities Commission Malaysia (SC) have in recent times issued regulations and consultative
papers to facilitate the growth of digital banking. The facilitative environment has been a catalyst to attract
fintech innovators to the country, creating stronger talent growth and promoting innovation.
www.marc.com.my 14BANKING REPORT
An example is the push towards mobile and internet banking to enhance the overall competitiveness of the
industry as digital banking is seen as more cost effective. The high mobile phone penetration in Malaysia has
also meant that mobile phones can readily serve as a means of making and accepting payments with no
additional infrastructure costs. While this has provided new opportunities at the industry level, the greater
usage of digital payments will see shifts in banks’ business model and consumer behaviour as well as lead to
new risks, particularly cyber security. Additionally, the growth of mobile banking will reduce reliance on the
‘brick and mortar’ banking model.
Nevertheless, as the challenge for banks going forward is revenue growth, it is important that banks balance
their fintech investments accordingly so as not to overburden their overall financial performance. The larger
banks will stand to benefit as they have deeper pockets to absorb the cost of fintech-related investments.
Sustainability a key growth driver going forward
Sustainability is becoming a competitive imperative with a growing awareness and acceptance among
businesses that growth opportunities lie in solving key sustainability challenges. More and more businesses
are stepping up to manage their total impact as an enterprise across the triple bottom line of profit, people
and planet. The emergence of sustainable banking provides new growth opportunities for banks and helps
address slowing growth rates.
Against the backdrop of the current climate and environmental concerns, green technology is emerging as a
winning proposition for the domestic banking sector as well as capital market activities. We have seen financing
for solar power plants take off in a big way. These efforts have been supported by the government which has
set a target of 20% of the country's electricity to be generated from renewable sources by 2030, an increase
from 2% currently.
On this note, MARC introduced the Impact Bonds Assessment Framework in July 2018 which assesses green
bonds, social bonds or sustainability bonds including sukuk issued under Malaysia’s Sustainable and
Responsible Investment (SRI) Sukuk Framework. MARC continues to play its role in supporting the growth of
the Islamic financial industry and is optimistic of the Impact Bond assessments’ long-term potential in
becoming a mainstay of fixed-income portfolios.
www.marc.com.my 15BANKING REPORT
MARC’S BANK ANALYSIS
www.marc.com.my 16BANKING REPORT
MALAYAN BANKING BERHAD
Background
Malayan Banking Berhad (Maybank) is the largest banking group in Malaysia and the fourth largest in
ASEAN, with total consolidated assets of RM807.0 billion as at end-2018. It has established branches in
all ten ASEAN countries as well as a presence in China, Hong Kong, The United Kingdom, the United States
and Pakistan, among others. Maybank’s key markets are Malaysia, Singapore and Indonesia, which
accounted for 58.3%, 25.2% and 7.7% of its consolidated gross loans as at end-2018. The group boasts
a well-diversified loan book and has a strong domestic retail presence.
Key Highlights
➢ Record earnings for the banking group
Maybank saw record pre-tax profit of RM10.9 billion in 2018 (2017: RM10.1 billion), largely behind a
reduction in net impairment losses. Earnings were also supported by better cost management, with the
cost-to-income ratio marginally improving to 47.6% during the year (2017: 48.8%), in addition to higher
loan growth. This was moderated by NIM compression behind stiff deposit competition in 2018. Going
forward, earnings growth is expected to be impacted by sustained margin pressure in addition to the
cut in the OPR rate by BNM in 2019.
➢ Higher loan growth although net interest margins were pressured
Maybank registered higher y-o-y loan growth of 4.8% in 2018 (2017: 1.7%), driven by working capital
and residential mortgage loans, the two largest segments of the group’s loan portfolio. Loan growth in
the near term will likely be driven by the retail and SME segments. Geographically, while loan growth
from Malaysia and Singapore moderated, Indonesia recorded higher growth of 7% in 2018 (2017:
3.1%). Positively, although the loan growth was higher at 4.8%, Maybank’s RWA declined by 1.7%
which reflects a more cautious risk appetite.
➢ Asset quality weakened behind Singapore exposure
Maybank’s GIL ratio increased to 2.41% as at end-2018 (2017: 2.34%) after reclassifying exposure to
Hyflux Ltd in Singapore as non-performing in 2Q2018. The Singapore exposure made up 35.4% of the
group’s impairments, although loans in Singapore constituted just 25.2% of Maybank’s loan portfolio.
The adoption of MFRS139 contributed to the higher GIL of RM12.5 billion in 2018 (2017: RM11.5 billion).
Loan loss coverage increased to 82.1% as at end-2018 (2017: 71.5%) as the adoption of MFRS 9 led
to higher provision buffers being set aside. Going forward, the banking group’s asset quality could face
moderate downside risk amid external uncertainties.
➢ Comfortable capital and liquidity position
Maybank remained well capitalised with CET1 and total capital ratios of 15.0% and 19.0% in 2018. Its
funding and liquidity profile is sound, underpinned by a substantial retail deposit base and easy access
to the capital markets. The group’s LCR stood at 132.4% as at end-2018, above BNM’s minimum
requirement of 100% in 2019. Its sizeable deposits from individuals which accounted for 39.2% of total
customer deposits (2017: 40.9%) and CASA ratio of 34.6% (2017: 36.6%) are key factors in providing
group funding stability.
www.marc.com.my 17BANKING REPORT
MALAYAN BANKING BERHAD
Table 1: Key financial indicators
Fye 31 December 2018 2017 2016
Total assets (RM bil) 807.0 765.3 736.0
Gross loans (RM bil) 517.3 493.8 485.7
Loan growth y-o-y (%) 4.8 1.7 5.7
Gross impaired loans (RM bil) 12.5 11.5 11.1
Customer deposits (RM bil) 532.7 502.0 485.5
Profit before tax (RM bil) 10.9 10.1 8.8
Shareholders’ funds (RM bil) 77.7 75.2 70.5
Return on assets (%) 1.06 1.04 0.96
Return on equity (%) 10.93 10.71 10.39
Net interest margin (%) 2.18 2.25 2.16
Cost/income ratio (%) 47.6 48.8 47.3
Gross impaired loan ratio (%) 2.41 2.34 2.28
Loan loss reserve coverage (%) 82.1 71.5 72.0
CET1 capital ratio (%) 15.0 14.8 14.0
Tier 1 capital ratio (%) 16.0 16.5 15.7
Total capital ratio (%) 19.0 19.4 19.3
Loan-to-funds ratio (%) 86.9 87.0 88.1
Gross loans/Customer deposits (%) 86.9 87.0 88.1
CASA deposits/Customer deposits (%) 34.6 36.6 36.4
Figure 1 : Total loan exposure by segment Figure 2: Loans and Impairment trend
Figure 3 : Profitability trend Figure 4 : Capital Adequacy Indicators
Sources: Company, MARC
www.marc.com.my 18BANKING REPORT
CIMB BANK BERHAD
Background
CIMB Bank Berhad (CIMB Bank) is the second-largest banking group in Malaysia, with well-established
banking franchise and strong domestic market position in loans and deposits. CIMB Bank is an ASEAN
focused bank with primary exposure in retail banking, commercial banking, investment banking and Islamic
banking. CIMB Bank is a core component of the CIMB Group, whose major shareholders are Khazanah
Nasional Berhad and the Employees’ Provident Fund.
Key Highlights
➢ Pressure on profitability from higher cost of funds and soft capital market conditions
CIMB Bank recorded pre-tax profit of RM5.1 billion in 2018, supported by higher net interest income
and lower impairment charges. These were moderated by higher cost of funds during the year. Non-
interest income declined due to soft capital market conditions in Malaysia which affected the Group’s
trading income. Looking ahead, the group’s earnings are expected to improve from the current level
underpinned by sustained loan growth momentum. Moderating this expectation is the continued
pressure on NIM due to the competition in the banking industry.
➢ Higher loan growth
CIMB Bank registered a higher loan growth of 8.9% (2017: 2.1%), following subdued growth in the last
two years as the bank undertook portfolio realignment in its key overseas markets. The group’s focus
remains on the retail segment with loans to individual and SME businesses.
➢ Stable asset quality
CIMB Bank’s GIL ratio eased to 2.2% as at end-2018 amid an expanding loan base. However, its GIL
increased slightly to RM6.3 billion from RM6.2 billion due to its Thai operations. Asset quality weaknesses
in Thailand continued to be driven by the SME segment; as at end-2018, the GIL ratio in the country
stood at 5.4% (2017: 6.0%). The adoption of MFRS 9 in January 2018 had boosted its loan loss reserve
coverage ratio to 80.1%.
➢ Strong capital adequacy and liquidity position
The group’s capitalisation remained comfortable, with a CET1 capital ratio of 12.9%. Its capital position
continues to be supported by dividend reinvestment and good earnings accretion. MARC views that the
group’s strong capital buffer above the minimum regulatory requirement remains supportive of credit
expansion. CIMB Bank’s liquidity is strong, with a high LCR of 164% as at end-2018, well above the
required 100%.
➢ Rethinking the way forward
Having achieved the key targets its T18 strategic plan, CIMB Group recently announced its next five-
year blueprint, “Forward 23”, as it prepares for new challenges ahead. The Group has raised the bar
through three key financial targets to be achieved by 2023, i.e. an ROE of more than 12%, a CET1 ratio
of over 13% and a cost-to-income ratio of below 45%. CIMB Group also expects higher contribution
from its overseas markets within the planning period. The success of T18 reflects well on the
management’s credibility in executing its business strategies. Nevertheless, given the more challenging
outlook and moderating economic growth, it remains to be seen whether it can deliver its set targets.
www.marc.com.my 19BANKING REPORT
CIMB BANK BERHAD
Table 1: Key financial indicators
FYE 31 December 2018 2017 2016
Total assets (RM bil) 451.9 417.1 395.5
Gross loans (RM bil) 289.5 265.9 260.4
Loan growth y-o-y (%) 8.9 2.1 8.9
Gross impaired loans (RM bil) 6.3 6.2 5.6
Customer deposits (RM bil) 238.2 224.1 208.7
Profit before tax (RM bil) 5.1 4.9 4.2
Shareholders’ funds (RM bil) 41.1 38.1 34.9
Return on assets (%) 0.91 0.96 0.84
Return on equity (%) 10.0 10.7 9.6
Net interest margin (%) 2.08 2.22 2.17
Cost/income ratio (%) 49.9 48.0 50.0
Gross impaired loan ratio (%) 2.18 2.33 2.15
Loan loss reserve coverage (%) 80.1 68.5 77.5
CET1 capital ratio (%) 12.9 12.2 11.6
Tier 1 capital ratio (%) 14.0 13.4 12.8
Total capital ratio (%) 17.8 17.0 16.4
Loan-to-funds ratio (%) 81.9 81.0 86.1
Gross loans/ Customer deposits (%) 89.7 89.0 92.7
CASA deposits / Customer deposits (%) 29.7 32.2 32.6
Figure 1 : Total loan exposure by segment Figure 2 : Loans and impairment trend
Figure 1: Total loan exposure by segment
Figure 3 : Profitability trend Figure 4 : Capital adequacy indicators
Sources: Company, MARC
www.marc.com.my 20BANKING REPORT
PUBLIC BANK BERHAD
Background
Public Bank Berhad (Public Bank) is the third-largest banking group in Malaysia in terms of assets. The
Group’s founder and chairman, Tan Sri Dato’ Sri Dr Teh Hong Piow, remains its largest shareholder with
an effective 23.5% stake, followed by the Employees’ Provident Fund with a 14.1% shareholding. Public
Bank is a market leader in residential mortgage financing and vehicle financing as well as in the private
unit trust business. Its exposure is mainly in the domestic market.
Key Highlights
➢ Superior asset quality metrics
Public Bank’s prudent underwriting standards and sound risk management continue to support its
excellent asset quality position. Its GIL ratio remained relatively stable at 0.5%, which is superior to
that of its domestic peers. Additionally, its loan loss reserve coverage of 126.0% remained robust. Given
its strong credit culture, MARC expects the group’s asset quality to remain strong in 2019 despite the
challenging environment.
➢ Healthy profitability may come under pressure
The Group’s pre-tax profit remained flat at RM7.1 billion in 2018 compared to the previous year.
Operating performance was supported by higher net interest income and lower impairment charges
during the year. These were partially offset by higher operating expenses. The Group’s cost-to-income
ratio increased slightly to 33.4%, despite remaining as the lowest in the industry. MARC expects further
margin compression for the Group with the recent 25 basis points OPR cut.
➢ Loan growth slowing down
The banking group is known for its above-industry loan growth with the exception of the last few years.
Amid weak consumer sentiment, the Group’s loan growth remains subdued, registering 4.2% as at end-
2018. In terms of lending exposure, Public Bank’s loan book continues to be retail-centric. Residential
properties, non-residential properties and transport vehicles collectively accounted for 77.9% of the
loan book as at end-2018. Although it has a sizeable exposure to the properties sector, we are comforted
by the robust asset quality of the sector, with GIL of 0.5% and 0.3% for residential properties and non-
residential properties. Loan growth is expected to remain resilient although muted at the mid-single
digit level.
➢ Healthy capitalisation, with sound liquidity and funding profile
Its CET1 and total capital ratios increased to 13.6% and 16.8% due to good internal capital generation.
These capital ratios remained above the minimum regulatory requirement. In terms of funding, the
Group recorded a 5.2% growth in its core customer deposits, outpacing loan growth. Although the
Group has a high gross loan-to-customer deposit ratio of 93.6%, we draw comfort from its sound
liquidity and funding position, as reflected by its high LCR and NSRF - both stood well above 100% in
2018.
Sources: Company, MARC
www.marc.com.my 21BANKING REPORT
PUBLIC BANK BERHAD
Table 1 : Key financial indicators
FYE 31 December 2018 2017 2016
Total assets (RM bil) 419.7 395.3 380.1
Gross loans (RM bil) 317.3 304.5 294.0
Loan growth y-o-y (%) 4.2 3.6 7.5
Gross impaired loans (RM bil) 1.6 1.5 1.5
Customer deposits (RM bil) 283.8 269.7 258.2
Profit before tax (RM bil) 7.1 7.1 6.6
Shareholders’ funds (RM bil) 42.1 38.4 35.4
Return on assets (%) 1.39 1.43 1.39
Return on equity (%) 14.1 15.0 14.9
Net interest margin (%) 1.94 2.00 1.91
Cost/income ratio (%) 33.4 32.4 32.9
Gross impaired loan ratio (%) 0.51 0.48 0.51
Loan loss reserve coverage (%) 126.0 95.5 102.7
CET1 capital ratio (%) 13.6 12.8 11.9
Tier 1 capital ratio (%) 14.3 13.5 12.7
Total capital ratio (%) 16.8 16.5 16.0
Loan-to-funds ratio (%) 90.0 91.8 91.4
Gross loans/Customer deposits (%) 93.6 95.4 94.8
CASA deposits/Customer deposits (%) 25.7 26.0 25.2
Figure 1: Total loan exposure by segment Figure 2: Loans and impairment trend
Figure 3: Profitability trend Figure 4: Capital adequacy indicators
RHB BANK
Sources: Company, MARC
www.marc.com.my 22BANKING REPORT
RHB BANK BERHAD
Background
RHB Bank Berhad (RHB Bank) is the fourth-largest bank in Malaysia, with well-established banking franchise
and strong domestic market position in loans and deposits. Other than Malaysia, the Group operates in
Singapore, Laos, Cambodia and Thailand.
Key Highlights
➢ Strong earnings growth
RHB Bank recorded higher pre-tax profit of RM3.1 billion in 2018 (2017: RM2.6 billion), mainly due to a
larger loan base as well as lower net impairments for the year. The Group has been able to avoid margin
compression by improving its funding mix, and has been able to manage costs well despite the ongoing
investments in its digital systems, in line with its five-year transformation programme, FIT22. This can
be seen in its improved cost-to-income ratio of 49.3% for the year (2017: 49.9%). Over the near term,
earnings growth will likely be driven by loan expansion in the retail and SME segments, both of which
are targeted under FIT22.
➢ Loan growth driven by the retail and SME segments
RHB Bank registered a higher y-o-y loan growth of 5.5% in 2018 (2017: 3.7%). Its transformation plan
has outlined strategies to continue strengthening the Group’s presence in the domestic market, which
accounts for 89.0% of its loan portfolio. Domestic loans grew 5.9% behind resilient growth in residential
mortgages, though this was moderated by corporate repayments. Retail and SME made up 72% of its
total domestic financing in 2018, up from 69% in 2017.
➢ Improved asset quality
RHB Bank’s asset quality has continued to improve, with the GIL ratio dropping to 2.06% as at end-
2018 (2017: 2.23%). This was primarily due to improvements in impaired loans to the construction
segment. The Group’s loan loss coverage stood at 93.3%. Problematic loans particularly in the oil and
gas segment in Singapore, have largely been provided for, though an existing exposure of around 3%
of the loan book could potentially pressure impairment ratios given the uncertainty that remains in the
sector in 2019.
➢ Capital ratios continue to strengthen
RHB Bank remains well capitalised, with consolidated CET1 and total capital ratios rising to 15.5% and
18.8% as at end-2018 (2017: 13.9%, 17.2%). The Group’s capital ratios remained well above the
minimum regulatory requirements of 7.0% and 10.5% (including the capital conservation buffer) upon
full implementation of BNM’s Basel III in 2019. RHB Bank’s capital position improved behind strong
profitability which offset the capital reduction of over 6% arising from the adoption of MFRS 9 at the
start of the 2018. This was further supported by capital optimisation measures which resulted in lower
RWA despite a larger loan base in 2018. Liquidity and funding position remained sound, with a loans-
to-customer deposit ratio of 94.4% and CASA ratio of 25.9% as at end-2018.
www.marc.com.my 23BANKING REPORT
RHB BANK BERHAD
Table 1: Key financial indicators
FYE 31 December 2018 2017 2016
Total assets (RM bil) 245.8 230.2 236.7
Gross loans (RM bil) 168.9 160.1 154.5
Loan growth y-o-y (%) 5.5 3.7 2.0
Gross impaired loans (RM bil) 3.5 3.6 3.7
Customer deposits (RM bil) 177.7 166.3 165.7
Profit before tax (RM bil) 3.1 2.6 2.2
Shareholders’ funds (RM bil) 23.4 23.2 21.8
Return on assets (%) 0.97 0.84 0.73
Return on equity (%) 9.91 8.70 8.55
Net interest margin (%) 2.08 2.08 2.07
Cost/income ratio (%) 49.3 49.9 50.0
Gross impaired loan ratio (%) 2.06 2.23 2.43
Loan loss reserve coverage (%) 93.3 51.2 56.9
CET1 capital ratio (%) 15.5 13.9 13.1
Tier 1 capital ratio (%) 15.7 14.2 13.4
Total capital ratio (%) 18.8 17.2 17.2
Loan-to-funds ratio (%) 87.5 90.3 84.7
Gross loans/Customer deposits (%) 94.4 96.0 93.2
CASA deposits/Customer deposits (%) 25.9 30.2 25.6
Figure 1: Total loan exposure by segment Figure 2: Loans and impairment trend
Figure 3: Profitability trend Figure 4: Capital adequacy indicators
Sources: Company, MARC
www.marc.com.my 24BANKING REPORT
HONG LEONG BANK BERHAD
Background
Hong Leong Bank (HLB) is currently Malaysia’s fifth-largest banking group and has regional presence in
Singapore, Hong Kong, Vietnam, Cambodia and China. It went through a series of consolidation exercises,
the last being with EON Capital Berhad in 2011. The domestic market is the main driver of its business.
The Group has a strong market presence in mortgage financing, vehicle financing and credit cards.
Exposure to mortgage financing formed about 60% of its total loan exposure in 2018.
Key Highlights
➢ Superior asset quality supported by solid impaired loans coverage
HLB maintained strong asset quality with a GIL ratio of 0.80% as at 1H2019 and has consistently kept
the ratio healthier than the industry average. Impairment level declined during the period, mainly from
lower impairment from loans for working capital. Loan loss coverage inclusive of regulatory reserves
stood at 201%. Given its conservative risk appetite and prudent underwriting, we do not anticipate any
major deterioration in its loan portfolio.
➢ Moderate earnings growth behind write-backs
HLB’s earnings rose 5.5% to RM1.4 billion during its financial year ended June 2019, largely driven
write-backs of impairment losses on loans. While margins have come under pressure, with the
annualised NIM dropping to 2.01% in 1HFY2019 (FY2018: 2.12%) amid keen deposit competition, HLB
remains among the more cost-efficient banks, with a cost-to-income ratio of 43.9%. Its conservative
liquidity position allows the Group the flexibility to expand at a faster pace if necessary and achieve
stronger NIM and earnings, moving forward.
➢ Residential mortgage segment continued to dominate the loan book
HLB registered a higher y-o-y loan growth of 4.8% as at end-December 2018 (FY2018: 3.1%). Growth
was evident in most segments, though the most notable would be residential mortgage financing, which
recorded an 8.8% y-o-y growth and accounted for 48.9% of the loan portfolio as at end-2018. Loan
growth moving forward is expected to be driven by the retail and business banking segments.
➢ Capital ratios continue to strengthen
HLB’s consolidated CET1 and total capital ratios stood at 12.7% and 16.3% as at end-2018 (FY2018:
12.6%, 16.3%). The group’s capital ratios remained well above the minimum regulatory requirements
of 7.0% and 10.5% (including the capital conservation buffer) upon full implementation of BNM’s Basel
III in 2019. HLB continues to demonstrate prudent liquidity policy with a loans-to-funds ratio of 79.0%,
allowing it room to scale up and expand its loan growth if needed. The group’s CASA ratio stood at
24.8% as at end-2018.
www.marc.com.my 25BANKING REPORT
HONG LEONG BANK BERHAD
Table 1: Key financial indicators
FYE 30 June 1H2019 2018 2017
Total assets (RM bil) 212.0 202.9 195.6
Gross loans (RM bil) 131.6 129.1 125.1
Loan growth y-o-y (%) 4.8 3.1 3.8
Gross impaired loans (RM bil) 1.0 1.1 1.2
Customer deposits (RM bil) 162.6 157.4 155.2
Profit before tax (RM bil) 24.5 3.2 2.7
Shareholders’ funds (RM bil) 212.0 23.9 22.7
Return on assets (%) 1.34* 1.32 1.11
Return on equity (%) 11.5* 11.3 9.8
Net interest margin (%) 2.01* 2.12 2.12
Cost/income ratio (%) 43.3 42.6 44.1
Gross impaired loan ratio (%) 0.80 0.87 0.96
Loan loss reserve coverage (%) 121.8 89.5 96.0
CET1 capital ratio (%) 12.7 12.6 13.3
Tier 1 capital ratio (%) 13.3 13.3 13.7
Total capital ratio (%) 16.3 16.3 15.8
Loan-to-funds ratio (%) 79.0 80.0 79.0
Gross loans/Customer deposits (%) 81.0 82.0 80.6
CASA deposits/Customer deposits (%) 24.8 26.2 25.0
*annualised
Figure 1: Total loan exposure by segment Figure 2: Loans and impairment trend
*annualised
Figure 3: Profitability trend Figure 4: Capital adequacy indicators
*annualised
Sources: Company, MARC
www.marc.com.my 26BANKING REPORT
AMBANK (M) BERHAD
Background
Ambank (M) Berhad (Ambank) is the core subsidiary of AMMB Holdings Berhad (AMMB), which is the sixth-
largest banking group in Malaysia by assets. The bank is involved in commercial banking, investment
banking and general and life insurance, and its exposure is mainly in the domestic market. AMMB’s major
shareholders are ANZ Funds Pty Limited, Tan Sri Azman Hashim (via Amcorp Group Berhad) and the
Employees’ Provident Fund.
Key Highlights
➢ Stable operating performance despite challenging environment
Ambank recorded 28.1% y-o-y growth in pre-tax profit to RM972.5 million for 9MFY2019 (9MFY2018:
RM759.4 million). This was mainly due to higher net interest income as loans grew 4.1% y-o-y, as well
as write-backs on allowances for impairments on loans and advances. Although there was some margin
compression, with the annualised NIM for 9MFY2019 standing at 2.3%, Ambank’s operating performance
was supported by better cost management during the period. Its cost-to-income ratio improved to 51.7%
in 9MFY2019 (FY2018: 62.3%).
➢ Loan growth driven by residential mortgages and SME lending
Ambank has gone through a rebalancing of its potfolio over the past few years, reducing its auto loan
exposure to the vulnerable income group. Ambank registered y-o-y loan growth of 6.1% as at end-
9MFY2019, faster than the industry’s 5.6% growth. SME and residential mortgage loans were the main
growth catalysts, increasing by 21.2% and 13.2% over the same period. As residential mortgage loan
growth is expected to ease in 2019 on the back of a cautious outlook on the property sector, the key
driver of net interest income expansion in the near term is likely to be a sustained SME loan growth.
➢ Superior asset quality supported by solid impaired loans coverage: Ambank’s GIL ratio improved
marginally to 1.52% as at end-9MFY2019 (FY2018: 1.55%) as the loan base grew faster than impairment
levels. Loan loss coverage inclusive of regulatory reserves rose to 122%. Given the high growth in the
SME segment, a deterioration in the Malaysian economy could have a more pronounced impact on
Ambank’s asset quality.
➢ Comfortable capital and liquidity position
Ambank’s capital ratios remain above minimum requirements with CET1 and total capital ratios of 11.4%
and 17.0% for 9MFY2019. The group’s funding and liquidity profile remained healthy, underpinned by a
high proportion of individual depositors at 46.8% of its total customer deposits as at end-December 2018,
as well as a loan-to-customer deposit ratio of 91.0%. Ambank’s relatively low CASA ratio of 19.2% will
continue to pressure its cost of funds and as such NIMs going forward.
➢ M&A talks back in the fray?
The Australia and New Zealand Banking Group (ANZ) previously stated its intention to exit from its
investment in Ambank, in line with ANZ’s divestment plans from the Asian region. Tan Sri Azman Hashim
also plans to retire and eventually sell his stake in Ambank. We do not rule out the possibility of M&A
talks resurfacing in the near future.
www.marc.com.my 27You can also read