GOULBURN INDUSTRY PROFILE - FINAL - Infrastructure Victoria
←
→
Page content transcription
If your browser does not render page correctly, please read the page content below
REPORT TO
INFRASTRUCTURE VICTORIA
22 JULY 2019

GOULBURN
 INDUSTRY PROFILE
 FINAL
ACIL ALLEN CONSULTING PTY LTD
ABN 68 102 652 148

LEVEL NINE
60 COLLINS STREET
MELBOURNE VIC 3000
AUSTRALIA
T+61 3 8650 6000
F+61 3 9654 6363

LEVEL ONE
50 PITT STREET
SYDNEY NSW 2000
AUSTRALIA
T+61 2 8272 5100
F+61 2 9247 2455

LEVEL FIFTEEN
127 CREEK STREET
BRISBANE QLD 4000
AUSTRALIA
T+61 7 3009 8700
F+61 7 3009 8799

LEVEL SIX
54 MARCUS CLARKE STREET
CANBERRA ACT 2601
AUSTRALIA
T+61 2 6103 8200
F+61 2 6103 8233

LEVEL TWELVE, BGC CENTRE
28 THE ESPLANADE
PERTH WA 6000
AUSTRALIA
T+61 8 9449 9600
F+61 8 9322 3955

167 FLINDERS STREET
ADELAIDE SA 5000
AUSTRALIA
T +61 8 8122 4965

ACILALLEN.COM.AU
C O N T E N T S
      EXECUTIVE SUMMARY                                              I
      1
       BACKGROUND                                                    1
1.1    Overview of the Goulburn region                               1
1.2    Sub-regions of Goulburn                                       4
1.3    Industry composition                                          5

      2
       REVEALED COMPARATIVE ADVANTAGE                                 8
2.1    Revealed comparative advantage index                           8
2.2    Goulburn (Level 1 ANZSIC analysis)                             9
2.3    Goulburn LGA analysis (Level 2 ANZSIC analysis)               11
2.4    Summary (Level 2 ANZSIC analysis)                             21

      3
       ANALYSIS OF REVEALED INDUSTRIES                               24
3.1    SWOT analysis of the region and revealed industries           24
3.2    Needs analysis of the region and relevant industries          31

      FIGURES
      FIGURE 1.1      SUB-REGION MAP, GOULBURN REGION, 2019           2
      FIGURE 1.2      TRANSPORT INFRASTRUCTURE, GOULBURN REGION,
                      2019                                            4
      FIGURE 1.3      GVA SHARE OF KEY INDUSTRIES IN THE GOULBURN,
                      2017-18                                         6
      FIGURE 1.4      GVA SHARE OF KEY INDUSTRIES IN THE GOULBURN
                      REGION 1991-92 TO 2017-18                       7
      FIGURE 2.1      REVEALED COMPARATIVE ADVANTAGE INDEX –
                      GOULBURN 2017-18, LEVEL 1 ANZSIC               10
      FIGURE 2.2      COMPARATIVE ADVANTAGE INDEX FOR GREATER
                      SHEPPARTON, 2017-18, LEVEL 2 ANZSIC            12
      FIGURE 2.3      COMPARATIVE ADVANTAGE INDEX FOR MITCHELL,
                      2017-18, LEVEL 2 ANZSIC                        14
      FIGURE 2.4      COMPARATIVE ADVANTAGE INDEX FOR MOIRA, 2017-
                      18, LEVEL 2 ANZSIC                             16
      FIGURE 2.5      COMPARATIVE ADVANTAGE INDEX FOR MURRINDINDI,
                      2017-18, LEVEL 2 ANZSIC                        18
      FIGURE 2.6      COMPARATIVE ADVANTAGE INDEX FOR STRATHBOGIE,
                      2017-18, LEVEL 2 ANZSIC                        20
      FIGURE 2.7      COMPOSITION OF LEVEL 2 ANZSIC INDUSTRY,
                      AGRICULTURE, BY LGA                            23

      TABLES
      TABLE ES 1      TOP 20 HIGHEST REVEALED COMPARATIVE
                      ADVANTAGE BY LGA, GOULBURN                   II
      TABLE ES 2      WHAT ARE THE INFRASTRUCTURE INVESTMENT
                      OPPORTUNITIES AND CONSTRAINTS FOR GOULBURN? IV
C O N T E N T S
TABLE 1.1 POPULATION AND AREA BY LGA, OVENS MURRAY
REGION, 2018 1
TABLE 2.1 TOP 10 REVEALED COMPARATIVE ADVANTAGE
INDUSTRIES FOR GOULBURN, LEVEL 1 ANZSIC 11
TABLE 2.2 TOP 10 REVEALED COMPARATIVE ADVANTAGE
INDUSTRIES FOR GREATER SHEPPARTON 12
TABLE 2.3 TOP 10 LARGEST INDUSTRIES FOR GREATER
SHEPPARTON 13
TABLE 2.4 TOP 10 REVEALED COMPARATIVE ADVANTAGE
INDUSTRIES FOR MITCHELL 14
TABLE 2.5 TOP 10 LARGEST INDUSTRIES FOR MITCHELL 15
TABLE 2.6 TOP 10 REVEALED COMPARATIVE ADVANTAGE
INDUSTRIES FOR MOIRA 16
TABLE 2.7 TOP 10 LARGEST INDUSTRIES FOR MOIRA 17
TABLE 2.8 TOP 10 REVEALED COMPARATIVE ADVANTAGE
INDUSTRIES FOR MURRINDINDI 18
TABLE 2.9 TOP 10 LARGEST INDUSTRIES FOR MURRINDINDI 19
TABLE 2.10 TOP 10 REVEALED COMPARATIVE ADVANTAGE
INDUSTRIES FOR STRATHBOGIE 20
TABLE 2.11 TOP 10 LARGEST INDUSTRIES FOR STRATHBOGIE 21
TABLE 2.12 TOP 20 HIGHEST REVEALED COMPARATIVE
ADVANTAGE BY LGA, GOULBURN 22
TABLE 3.1 SWOT ANALYSIS FOR THE REVEALED INDUSTRIES OF
GOULBURN 25
TABLE 3.2 WHAT ARE THE INFRASTRUCTURE INVESTMENT
OPPORTUNITIES AND CONSTRAINTS FOR GOULBURN? 33
BOXES
BOX 1.1 KEY INFRASTRUCTURE, GOULBURN REGION, 2019 3
BOX 1.2 OTHER REGIONAL ATTRIBUTES, GOULBURN REGION,
2019 4
BOX 2.1 EXPLANATION UNDERPINNING ACIL ALLEN’S USE OF
VICTORIAN AND NATIONAL CAI COMPARISONS 9EXECUTIVE
SUMMARY
Overview of region
The Goulburn region is situated in the north of Victoria. The region is bounded by Loddon Campaspe
to the west; New South Wales to the north; Ovens Murray to the east and metropolitan Melbourne to
the south. Goulburn’s proximity to southern New South Wales means that the region also provides
services to, and receives services from New South Wales, as well as drawing considerable freight
movements between the two areas.
Being located in the peri-urban fringe, Goulburn has major road infrastructure that keeps the region
well-connected to metropolitan Melbourne and Sydney via the Hume Freeway as well as the Goulburn
Valley Freeway/Highway. These are supplemented with rail and small regional airports, both capable
of carrying passengers and freight. Goulburn is also home to significant water storages of the Murray
Darling Basin such as the Goulburn Weir, as well as a major irrigation district being sourced from
Lake Eildon.
Goulburn’s economy is mainly focused on agriculture, manufacturing and health care. Greater
Shepparton, serving as the regional hub, provides economic diversity, services and employment
opportunities for the region. The Goulburn region is also abundant in natural resources such as
timber, sand and stone, gold, coal, other mineral resources as well as solar and wind energy. As
energy policy heads towards renewables, the region could also benefit from heavier investment in
renewable energy sources.
Revealed comparative advantage (RCA) index methodology
Using the theories and approaches of revealed comparative advantage (RCA) outlined in the
accompanying assessment framework report, an analysis of the comparative advantage of Goulburn
is provided below.
A revealed comparative advantage index (CAI) assumes that the historical economic performance of a
region can serve as a good indicator of the industries which have a comparative advantage in that
region. The revealed CAI measures the concentration of industries in a particular region compared to
the Victorian or Australian economy (that is, it compares the proportion of an industry’s contribution to
the region’s gross value added (GVA), relative to the proportion at the State and National level).
Specifically, industries with a CAI above 1 have a higher proportion of GVA in that region compared to
the state or national economy and can indicate a potential strength and comparative advantage within
the region.
Additional explanation about the RCA and CAI approach used in this profile (including the limitations
of the approach) are provided in the body of the report at Chapter 2.
i
GOULBURN INDUSTRY PROFILETop 20 highest RCA industries
Table ES1 summarises the highest revealed comparative advantage industries (Level 2 ANZSIC1) for
the LGAs within Goulburn, using the Victorian CAI comparison.
Traditionally considered a ‘food bowl’ for Victoria, Goulburn is heavily reliant on primary (agriculture)
and secondary (food product and beverage manufacturing) industries. Agriculture demonstrates a
strong comparative advantage across Strathbogie, Murrindindi, Moira and Greater Shepparton.
Agriculture is a significant proportion of each LGA’s economic activity, and has demonstrated strong
growth across those LGAs of between 23 – 50 per cent in the last decade. The performance of
agriculture in these areas is a result of the modern farm businesses that utilise the highly fertile soils,
mild climates and access to irrigation water from the Murray and Goulburn rivers. The region is a
nationally significant production base for dairy, apples, pears and stone fruits. The resilience of these
industries is evident in response to depressed commodity prices, variable seasonal conditions and the
increasing cost of irrigation water.
The food and beverage processing industries are interlinked with the dairy and horticultural sectors
that dominate the region. Food Product Manufacturing in Moira (9.3 Victorian CAI, 112 per cent
growth and 21 per cent GVA) demonstrates a strong comparative advantage, strong sectoral growth
in the last decade and is the largest in Goulburn. Areas such as Greater Shepparton (2.9
Victorian CAI, negative 11 per cent growth and 6 per cent GVA) and Mitchell (1.6 Victorian CAI,
negative 12 per cent growth and 3.5 per cent GVA) these areas demonstrate weaker comparative
advantages in food product manufacturing. This could reflect the agricultural product market
conditions that they trade in or the structural issues related to the cost competitiveness of
manufacturing locally. These sectors are identified as having potential future growth opportunities. For
this to be realised, continued improvements in production, labour and supply chain efficiencies will be
essential to remaining competitive.
Other primary industries including Aquaculture in Murrindindi (43.5 Victorian CAI, negative 22 per cent
growth and 1 per cent GVA) and in Strathbogie (16.5 Victorian CAI, 144 per cent growth and less than
1 per cent GVA) both demonstrate strong comparative advantages but represent such a smaller
proportion of GVA that it is difficult to identify substantial economic development opportunities relevant
to such sectors. Forestry and Logging (11.1 Victorian CAI, negative 51 per cent growth and
1 per cent GVA) in Murrindindi and Non-Metallic Mineral Mining across Murrindindi (7.3 Victorian CAI,
negative 6 per cent growth and less than 1 per cent GVA), Strathbogie (6.7 Victorian CAI, 4 per cent
growth and less than 1 per cent GVA) and Mitchell (5.5 Victorian CAI, negative 51 per cent and less
than 1 per cent GVA) represent very little economic activity but have significant comparative
advantages. This could reflect the emerging nature of these sectors, but without further information,
little inference is able to be made regarding these sectors’ future prospects.
TABLE ES 1 TOP 20 HIGHEST REVEALED COMPARATIVE ADVANTAGE BY LGA, GOULBURN
Industry (Level 2 ANZSIC) LGA CAI (Victorian CAI (National 10 year % of LGA Quadrant
comparison) comparison) growth GVA
2. Aquaculture (appears: 2 times)* Murrindindi (S)** 43.5 15.4 -22% 1% Top left
2. Aquaculture (appears: 2 times) Strathbogie (S) 16.5 5.8 144% 0% Top right
1. Agriculture (appears: 4 times) Strathbogie (S) 13.2 16.5 50% 41% Top right
12. Beverage and Tobacco Product Strathbogie (S) 12.1 9.5 -63% 4% Top left
Manufacturing
3. Forestry and Logging Murrindindi (S) 11.1 6.2 -51% 1% Top left
11. Food Product Manufacturing (appears: 2 Moira (S) 9.3 12.0 112% 21% Top right
times)
1. Agriculture (appears: 4 times) Murrindindi (S) 7.9 10.0 27% 25% Top right
1. Agriculture (appears: 4 times) Moira (S) 7.6 9.6 23% 24% Top right
1 Australia and New Zealand Standard Industrial Classification
ii
GOULBURN INDUSTRY PROFILEIndustry (Level 2 ANZSIC) LGA CAI (Victorian CAI (National 10 year % of LGA Quadrant
comparison) comparison) growth GVA
9. Non-Metallic Mineral Mining and Quarrying Murrindindi (S) 7.3 1.8 -6% 0% Top left
(appears: 3 times)
9. Non-Metallic Mineral Mining and Quarrying Strathbogie (S) 6.7 1.6 4% 0% Top right
(appears: 3 times)
57. Internet Publishing and Broadcasting Greater 6.0 2.9 82% 0% Top right
Shepparton (C)
44. Accommodation Murrindindi (S) 5.6 3.7 -2% 3% Top left
9. Non-Metallic Mineral Mining and Quarrying Mitchell (S) 5.5 1.3 -51% 0% Top left
(appears: 3 times)
5. Agriculture, Forestry and Fishing Support Moira (S) 4.9 4.4 67% 1% Top right
Services (appears: 2 times)
82. Adult, Community and Other Education Murrindindi (S) 4.4 5.1 146% 2% Top right
1. Agriculture (appears: 4 times) Greater 4.3 5.5 41% 13% Top right
Shepparton (C)
4. Fishing, Hunting and Trapping Murrindindi (S) 3.7 1.6 157% 0% Top right
5. Agriculture, Forestry and Fishing Support Greater 3.2 2.9 95% 1% Top right
Services (appears: 2 times) Shepparton (C)
31. Heavy and Civil Engineering Construction Mitchell (S) 3.2 2.3 92% 4% Top right
11. Food Product Manufacturing (appears: 2 Greater 2.9 3.8 -11% 6% Top left
times) Shepparton (C)
Note: *Revealed industries that appear in more than one LGA are identified “appears: x times.”. **LGAs are classified as follows: (C) Cities, (S) Shires, (RC) Rural Cities.
SOURCE: ACIL ALLEN ESTIMATES BASED ON IV DATA
SWOT and needs analysis
To help understand what the infrastructure investment opportunities and constraints look like for the
Goulburn, ACIL Allen undertook Strengths, Weaknesses, Opportunities and Threats (SWOT) analysis
as well as a needs analysis. The information underpinning the SWOT and needs analysis was derived
from a desktop research process which examined publicly available data and information. Table ES2
provides the results of this analysis for the industries identified in Table ES1. That is, Table ES2
provides the results of the SWOT and needs analysis for those industries identified in Table ES1 that
are deemed to have a high CAI and high share of GVA for the LGA they operate in. It identifies the
potential investment opportunities and constraints that are important considerations for meeting the
future infrastructure requirements of revealed sectors and other sectors important to Goulburn’s
economy.
Revealed industries identified in Table ES1 are assessed for their RCA comparison to Victoria, the
contribution to an LGA’s GVA and consideration of an industry’s performance over the past decade.
This approach identifies the most important industries to the region. This guides the initial SWOT
analysis process. However, due to some of the limitations of the RCA (see Section 2.1), it is important
to review available industry, sector and regional development literature as well as consult with relevant
regional stakeholders to identify industries that the region considers as important for future economic
development. In Goulburn’s case, opportunities have been identified in food product manufacturing,
agricultural production and tourism.
Due to the categorisation of industries in the ANZSIC codes, tourism does not have a demonstrated
RCA. The data simply will not allow for this calculation to be undertaken. However, this sector
demonstrates many economic development opportunities for Goulburn.
A further assessment of the priority industries considers service industries that may contribute to the
performance of a primary or secondary industry – for Agriculture, this may include Agriculture,
Forestry and Fisheries Services Support.
iii
GOULBURN INDUSTRY PROFILEIn order to include industries that could be considered emerging or have demonstrated growth but are
starting from low base, it is necessary to cross-check the opportunities identified in the literature with
the emerging industries presented in Table ES1. Outside of Agriculture and Manufacturing, there are
no industries in the top 20 that are identified in the literature that either align with the small industries
(Industry Revealed Relevant Identified needs Opportunities to address needs Constraints to
sectors LGAs economic
development of the
sector
Mining and (Identified as Strathbogie Enabling infrastructure for Development of enabling Inadequate enabling
energy emerging Moira the solar industry in the infrastructure such as connecting infrastructure will
industry, based North, including electricity roads and transmission network constrain growth in
on the future distribution and connections is essential to the renewable energy
opportunities connections efficient, cost-effective and safe production in the
identified in the operation of solar and wind power region
SWOT generation infrastructure
however, it
does not have
an RCA as
such)
Tourism (Identified as Moira The tourism and supporting Development of enabling Limited public
emerging Strathbogie service sectors need public infrastructure, such as public amenities at nature-
industry, based amenities for nature based amenities, at nature-based tourist based or remote tourist
Greater
on the future or rural tourism sites, which destinations will encourage destinations constrains
Shepparton
opportunities include infrastructure that investment in tourist experiences and the potential numbers
identified in the encourages supporting services (food, beverage of visitors able to
SWOT accommodation, linkages and accommodation) access the site or
however, it between experiences, length of time that they
does not have specific infrastructure that will stay at a site
an RCA as would enable development
such) of tracks and trails in
National Parks, such as the
Strathbogie Ranges and
Barmah National Park
SOURCE: ACIL ALLEN
v
GOULBURN INDUSTRY PROFILEBACKGROUND Backg ro und
1.1 Overview of the Goulburn region
The Goulburn region is situated in the north of Victoria. The region is bounded by Loddon Campaspe
region to the west; New South Wales to the north; Ovens Murray region to the east and metropolitan
Melbourne to the south.
The Goulburn region accounts for 7 per cent of Victoria’s land area, at approximately 16,513 km2. As
at 2018, the Ovens Murray region had an estimated resident population (ERP) of 165,228 or
2.6 per cent of Victoria’s population. The region’s population and total land size by LGA are shown in
Table 1.1 below.
TABLE 1.1 POPULATION AND AREA BY LGA, OVENS MURRAY REGION, 2018
Local Government Area (and sub-region) Population Share of Area (km2) Share of
region ERP region area
Greater Shepparton City (Shepparton regional 66,007 40% 2,422 15%
hub)
Mitchell Shire (Southern peri-urban fringe) 44,299 27% 2,862 17%
Moira Shire (Rural areas) 29,799 18% 4,046 25%
Murrindindi Shire (Southern peri-urban fringe) 14,478 9% 3,880 23%
Strathbogie Shire (Rural areas) 10,645 6% 3,303 20%
Goulburn region(1) 165,228 100% 16,513 100%
Notes (1) Totals may not sum to 100 per cent due to rounding.
SOURCE: ABS CAT NO. 3218.0, REGIONAL POPULATION GROWTH, AUSTRALIA.
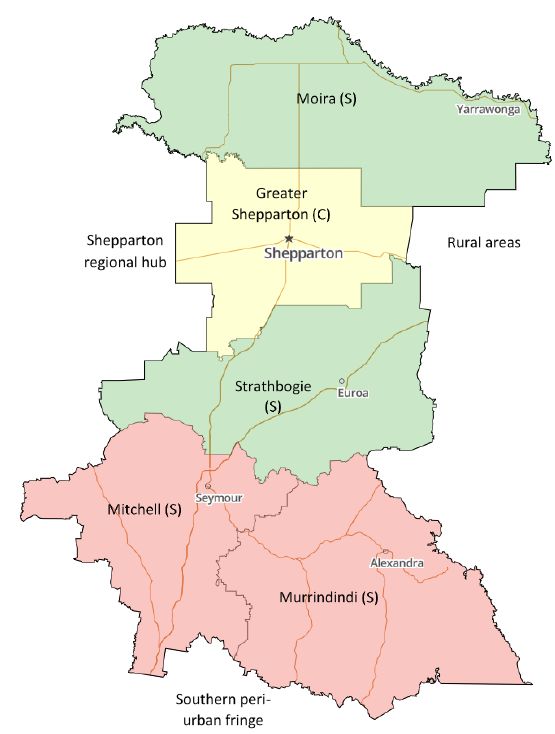
The LGAs of Goulburn are further aggregated into sub-regions based on economic and environmental
characteristics shown below (see Figure 1.1 for a map of sub-regions):
— the Shepparton regional hub (yellow)
— the southern peri-urban fringe (red)
— the rural areas (green).
1
GOULBURN INDUSTRY PROFILEFIGURE 1.1 SUB-REGION MAP, GOULBURN REGION, 2019
SOURCE: GOULBURN REGIONAL PROFILE 2018
Goulburn shares a border with metropolitan Melbourne. While some of the southern parts of the
region are within Melbourne’s peri-urban fringe and are thus impacted by population and associated
development pressures, northern areas of the region are dominated by rural areas with smaller
established towns, lower population growth and fewer associated development pressures. The region
is well connected to key economic centres such as Melbourne through transport infrastructure such as
the Hume Freeway and passenger and freight rail lines.
Further details of the key natural and environmental attributes, infrastructure and sub-regions are
provided in the following sections.
1.1.1 Key natural and environmental attributes
Key attributes of the Goulburn region in terms of natural resources and environmental features are
described below.
Natural resources include:
— minerals in the form of sand and stone products
— timber
— solar and wind energy
2
GOULBURN INDUSTRY PROFILE— gold, coal and other mineral resources
— water.
Key environmental assets include:
— the Ramsar-listed Barmah Forest National Park
— the Cathedral Ranges State Park.
— Lake Eildon National Park
— rivers and lakes.
1.1.2 Key infrastructure
Being located in the peri-urban fringe, Goulburn has major road infrastructure that keeps the region
well-connected to metropolitan Melbourne and Sydney via the Hume Freeway. These are
supplemented with rail and small regional airports, both capable of carrying passengers and freight.
The Goulburn region is also home to significant water storages of the Murray Darling Basin such as
the Goulburn Weir, as well as a major irrigation district being sourced from Lake Eildon.
A summary of the key infrastructure in Goulburn is in Box 1.1.
BOX 1.1 KEY INFRASTRUCTURE, GOULBURN REGION, 2019
Roads
— Hume Freeway connecting Melbourne to Sydney via Seymour.
— Goulburn Valley Freeway connecting Eildon to Shepparton.
— Murray Valley Highway connecting Towong to Wodonga and out to Robinvale.
— Midland Highway connecting to Geelong via Shepparton.
— Maroondah Highway connection Alexandra to Melbourne.
— Melba Highway connecting Yea to Melbourne.
Rail
— Shepparton to Sydney and Melbourne through Seymour: passenger route.
— North east freight line connecting Melbourne to Sydney through Shepparton.
— The Inland Railway (expected to be operational by 2025).
Water
— Goulburn Weir.
— Goulburn Murray Irrigation District primarily sourced from Lake Eildon.
Other significant infrastructure
— Many smaller regional airports.
— Water storage and distribution from the Goulburn Weir and the Goulburn Murray Irrigation District primary
sourced from Lake Eildon.
— Puckapanyal defence site
— Recycled water available for use for crops and crazing.
— Regional hospital in Shepparton.
SOURCE: GOULBURN REGIONAL PROFILE 2018
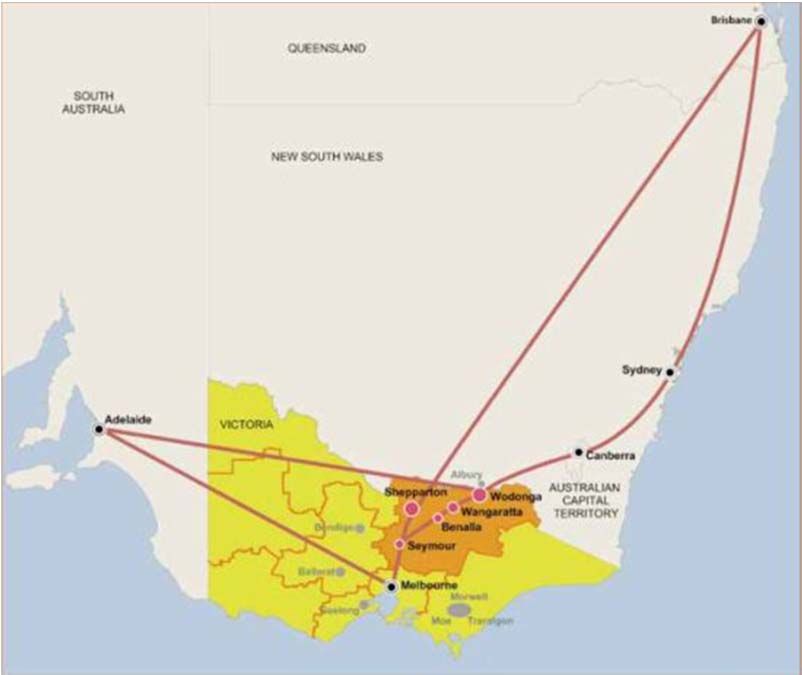
The main transport routes and airports for the Goulburn region are illustrated in Figure 1.2.
3
GOULBURN INDUSTRY PROFILEFIGURE 1.2 TRANSPORT INFRASTRUCTURE, GOULBURN REGION, 2019
SOURCE: GOULBURN REGIONAL PROFILE 2018
1.1.3 Other regional attributes
Goulburn’s economy is mainly focused on agriculture, manufacturing and health care. Greater
Shepparton, serving as the regional hub, provides economic diversity, services and employment
opportunities for the region. Goulburn is also abundant in natural resources such as timber, sand and
stone, gold, coal, other mineral resources as well as solar and wind energy. As energy policy heads
towards renewables, the region could also benefit from heavier investment in renewable energy
sources.
A summary of other attributes for Goulburn is provided in Box 1.2.
BOX 1.2 OTHER REGIONAL ATTRIBUTES, GOULBURN REGION, 2019
The other key attributes of the Goulburn region include:
— Strong growth in construction services, especially in light of continued developments in Shepparton.
— There are mining prospects in the region for gold, precious metals, base metals, brown coal and molybdenum.
— Potential to develop renewable energy sources in close proximity to distribution infrastructure.
SOURCE: GOULBURN REGIONAL PROFILE 2018
1.2 Sub-regions of Goulburn
There are differences across the Goulburn region relating to key attributes, and infrastructure. A large
share of the population lives in several major regional centres while agricultural activity is spread
across rural communities. These sub-regional differences are discussed for Goulburn’s sub-regions
below.
4
GOULBURN INDUSTRY PROFILEShepparton regional hub
Comprising the Greater Shepparton LGA, the Shepparton regional hub shares the following
characteristics:
— The workforce participation rate continues to be lower than the state-wide average, though it remains
higher than the other regions in Goulburn. Increased service sector growth in Shepparton could help
alleviate wages and employment pressures in the region.
— The region has high rates of social housing, homelessness and poor population health.
— The clearing of native vegetation for private land and agricultural use has changed the landscape of
the region, providing strong basis to support dairy and horticulture industries in the region.
The peri-urban fringe
Comprising the Mitchell and Murrindindi LGAs, the peri-urban fringe of the Goulburn region shares the
following characteristics:
— Public administration is the largest industry in this region due to the presence of the Puckapunyal
Military area.
— There are significant tourism assets in the region, housing numerous wineries and the Cathedral
Ranges State park.
— Population growth is likely to drive opportunities in construction and services in this region.
— The risk of natural hazards from isolated forested areas in the region will continue to present
environmental challenges in the region.
Rural areas
Comprising the Strathbogie and Moira LGAs, the rural areas share the following characteristics:
— Agriculture is the dominant industry in this region and will continue to face challenges with the
underlying structural changes to the Victorian economy.
— While crime is relatively low, the health outcomes within this region continue to be lower than the
Victorian average.
— Modest population growth forecast.
1.3 Industry composition
The Gross Regional Product (GRP) of region is approximately the sum of industrial Gross Value
Add (GVA).2 Figure 1.3 shows the 2017-18 distribution of GVA across the largest industries for the
Goulburn and its LGAs. The biggest industries by GVA in the Goulburn region are: Agriculture,
Forestry and Fishing (18.0 per cent), Manufacturing (12.7 per cent), Health Care and Social
Assistance (10.8 per cent), Construction (9.0 per cent), and Electricity, Gas, Water and Waste
Services (7.3 per cent). These five industries comprise over half of Goulburn’s GVA.
There is noticeable variation in the composition of Goulburn’s LGAs, with the key industries varying
between LGAs. Some noticeable differences include the Strathbogie LGA having a larger Agriculture,
Forestry and Fishing industry (42 per cent) relative to Goulburn as a whole and the Moira LGA having
a relatively large Manufacturing industry at 25 per cent. The Mitchell LGA has a relatively large
Construction industry (19 per cent) and Public Administration and Safety industry (17 per cent).
2 GRP is the sum of GVA at basic prices plus taxes less subsidies on products.
5
GOULBURN INDUSTRY PROFILEFIGURE 1.3 GVA SHARE OF KEY INDUSTRIES IN THE GOULBURN, 2017-18
100%
90% 22% 21%
25% 25% 26% 28%
Percentage share of regional GVA by industry (%)
80%
5% 4%
6% 6% 4%
70% 7% 6% 6% 4%
6% 6% 2%
7% 2% 5% 9% 1%
60% 6% 5% 5%
5%
7% 9% 6% 8%
50% 13% 17%
9% 10% 8%
7% 2%
40%
11% 25% 8%
30% 13% 19%
5%
13%
20% 11% 42%
9%
25% 27%
10% 18% 6%
14%
7%
0%
Goulburn Greater Mitchell (S) Moira (S) Murrindindi (S) Strathbogie (S)
Shepparton (C)
Agriculture, Forestry and Fishing Manufacturing
Health Care and Social Assistance Construction
Electricity, Gas, Water and Waste Services Public Administration and Safety
Retail Trade Education and Training
Other
Note: Other includes industries with less than 9 per cent of Goulburn GVA: Professional, Scientific and Technical Services; Transport, Postal and Warehousing; Financial and Insurance Services;
Accommodation and Food Services; Wholesale Trade; Administrative and Support Services; Other Services; Rental, Hiring and Real Estate Services; Arts and Recreation Services; Information Media and
Telecommunications; and Mining.
SOURCE: IV DATA 2019
Between 2007-08 and 2017-18, there was a sizable decline in the share of GVA from:
— Transport, Postal and Warehousing, decreasing from 4.5 per cent to 3.4 per cent (a 24 per cent
reduction).
— Public Administration and Safety, declining from 7.6 per cent to 6.1 per cent (a 19 per cent reduction).
— Manufacturing, declining from 14.4 per cent to 12.7 per cent (a 12 per cent reduction).
Since 2007-08 there has been an increase in the share of GVA from Professional, Scientific and
Technical Services, increasing from 2.8 per cent to 4.7 per cent (a 67 per cent increase); Electricity,
Gas, Water and Waste Services, increasing from 4.6 per cent to 7.3 per cent (a 59 per cent increase);
and Health Care and Social Assistance, increasing from 8.0 per cent to 10.8 per cent (a 36 per cent
increase).
6
GOULBURN INDUSTRY PROFILEThis is somewhat consistent with trends occurring across Victoria, such as a general decline in the
manufacturing sectors and an increase in service-based industries, particularly health-related services
associated with ageing populations.
FIGURE 1.4 GVA SHARE OF KEY INDUSTRIES IN THE GOULBURN REGION 1991-92 TO 2017-18
20%
18%
16%
14%
Proportion of GVA
12%
10%
8%
6%
4%
2%
0%
Agriculture, Forestry and Fishing Manufacturing
Health Care and Social Assistance Construction
Electricity, Gas, Water and Waste Services Public Administration and Safety
Retail Trade Education and Training
Professional, Scientific and Technical Services Transport, Postal and Warehousing
SOURCE: IV DATA 2019
7
GOULBURN INDUSTRY PROFILEREVEALED
COMPARATIVE
ADVANTAGE Re ve ale d comparative ad vantage
2.1 Revealed comparative advantage index
Using the theories and approaches of revealed comparative advantage (RCA) outlined in the
accompanying assessment framework report, an analysis of Goulburn’s comparative advantage is
provided below.
A revealed comparative advantage index (CAI) assumes that the historical economic performance of a
region can serve as a good indicator of the industries which have a comparative advantage in that
region. The strength of an RCA approach is that it enables the identification of significant industries in
each region while using a relatively simple and consistent methodology. In other words, with RCA, the
results are truly comparative across regions because, for each region, the results are derived in a
consistent way. Specifically, industries with a CAI above 1 have a higher proportion of GVA in that
region compared to the state or national economy and can indicate a potential strength of a region.
The revealed CAI measures the concentration of industries in a particular region compared to the
Victorian or Australian economy (that is, it compares the proportion of an industry contribution to the
regions GVA, relative to the proportion at the State and National level). The reasons why both
comparators are important are outlined in Box 2.1 below.
While both comparisons have been used for this analysis and reported in the sections below, the
analysis of the top revealed industries focuses on industries assessed against the Victorian CAI. This
has been done for two reasons. First, it is consistent with the focus of this study, which is on Victoria’s
regions. Second, there were some minor gaps in the Level 2 ANZSIC data used to undertake the
LGA-level analysis which would have impacted the consistency in which national CAI comparisons
can be reported.
Furthermore, the analysis in this chapter reports on rates of industry growth as it provides insight into
industries that have grown rapidly over the past decade and hence could be expected to continue to
grow in the future. It also identifies industries that have declined over the past decade.
8
GOULBURN INDUSTRY PROFILEBOX 2.1 EXPLANATION UNDERPINNING ACIL ALLEN’S USE OF VICTORIAN AND NATIONAL CAI
COMPARISONS
The RCA approach was developed initially to calculate relative advantage or disadvantage of a country in
certain goods and services as evidenced by trade flows. In recent years, the concept has been adopted to
assess the comparative advantage of industries in a region.
When assessing regional RCA, there was a question of which denominator to use in the index.
A key reason for using a national denominator (in addition to a Victorian denominator) to calculate the CAI for
various industries is that while a particular industry may be significant compared to the Victorian average, it
may not be significant compared to the broader Australian economy. When the CAI for a particular industry,
within a particular region, shows a similar strength compared to both the Victorian and the national averages,
this is likely to indicate a stronger comparative advantage than one in which the two CAI’s conflict.
Therefore, under this framework, two comparisons (Victorian and national) have been provided to assist IV in
understanding a region’s/industry’s comparative advantage from multiple perspectives.
For example, the CAI of a mining commodity may be very strong in a particular region compared to Victoria
because there happens to be an economic deposit within that region that is not available elsewhere in Victoria.
When compared to Australia as a whole, however, a low CAI would indicate that there are more competitive
mining provinces elsewhere in Australia. In contrast, a high CAI using both the Victorian and national
denominators is likely to indicate that not only is there an economic deposit present, but that it is potentially a
world class deposit.
SOURCE: ACIL ALLEN
Limitations of CAI
The RCA approach tells us how regions compare to that of the broader economy in terms of size.
Where there is variation in size relative to the broader economy, RCA can be in indicator of an
industry’s strength and ‘importance’ to the future of the regional economy. However, it is only one
indicator and further analysis is needed to determine if the industry warrants future investment and
attention by government. Furthermore, the RCA approach does not tell us if a high CAI industry is a
driver or a consequence of growth. This is important because an industry may only exist as a
consequence of government funding (as is the case for correctional facilities/prisons) and not because
of the private market’s demand for its goods and services. There may be policy or other reasons to
support these industries, however, these reasons may not be overtly economic in nature.
2.2 Goulburn (Level 1 ANZSIC analysis)
Figure 2.1 shows the CAI index and industry growth for Level 1 ANZSIC industries in Goulburn. The
size of the bubbles indicates the relative size of the industries. As noted above, the CAI can be used
as an indicator of possible regional strength, particularly when combined with a growing share of
regional GVA. The quadrant framework can assist in mapping the growth potential of an industry with
a RCA.
Top right, comparative advantage and growth: These are the industry sectors that should be looked
upon as most likely to drive regional growth and development. These are sectors for which a region
most likely has comparative advantage in and have experienced growth over the past decade.
Government policy should seek to facilitate growth in these sectors and attempt to leverage them by
focussing on the economic linkages these sectors have to the region and the Victorian economy.
Industries in Goulburn which appear to have comparative advantage and potential growth
characteristics include Agriculture, Forestry and Fishing; Electricity, Gas, Water and Waste Services;
and Health Care and Social Assistance.
Top Left, comparative advantage with no growth: These are the industry sectors which have a
comparative advantage, but which have been in decline over the past decade. For the Goulburn
region, this refers to the Public Administration and Safety industry. Government policy should seek to
9
GOULBURN INDUSTRY PROFILEidentify and overcome constraints to the growth of these industries caused by infrastructure
provision.
Bottom right, growth but not yet comparative advantage: These are the industry sectors that have
experienced growth over the past decade but do not have comparative advantage. Our analysis
shows that for Goulburn region, these include the Professional, Scientific and Technical Services;
Mining; and Retail Trade industries. Government policy should look at this quadrant as identifying
potential emerging industries.
Bottom left, no growth and no comparative advantage: These are the industry sectors for which there
is no comparative advantage or growth – namely, the Information Media and Telecommunications;
Financial and Insurance Services; and Transport, Postal and Warehousing. Government policy might
be warranted here to manage decline or assist regions to transition out of these industries.
Government support for these industries may have less to do with infrastructure provision and other
forms (i.e. welfare) of industry support or structural adjustment.
FIGURE 2.1 REVEALED COMPARATIVE ADVANTAGE INDEX – GOULBURN 2017-18, LEVEL 1
ANZSIC
6
A. Agri...
5
4
Revealed comparative advantage index
3
P. Educ… D. Elect…
O. Public… 2 C. Manuf E. Const…
H. Accom…
S. Other…
Q. Health…
1
-60% -40% -20% 0% 20% 40% 60% 80% 100% 120%
G. Retail… M. Profes…
J. Infor… K. Financial… B. Mining
0 R. Arts…
I. Transp… N. Admin…
L. Rental…
F. Wholesale…
-1
Percentage change in GVA, 2008-2018 (% )
Note: This includes the revealed comparative advantage index of Goulburn relative to the Victorian economy.
SOURCE: ACIL ALLEN ESTIMATES BASED ON IV DATA
Table 2.1 summarises the highest revealed comparative advantage industries (Level 1 ANZSIC) for
Goulburn. The revealed industries in the table relate to those which have the highest CAI using the
Victorian comparison, not the national comparison. The Victorian comparisons have been selected
because they are consistent with the regional focus of this study, and because there were some
limitations in the ANZSIC data which meant there would have been gaps in the presentation of high-
ranking national CAI industries in some LGAs.
10
GOULBURN INDUSTRY PROFILETABLE 2.1 TOP 10 REVEALED COMPARATIVE ADVANTAGE INDUSTRIES FOR GOULBURN,
LEVEL 1 ANZSIC
Industry (Level 1 ANZSIC) CAI (Victorian CAI (National 10 year % of LGA Quadrant
comparison) comparison) growth GVA
A. Agriculture, Forestry and Fishing 5.1 6.1 33% 18.0% Top right
D. Electricity, Gas, Water and Waste 2.4 2.5 95% 7.3% Top right
Services*
C. Manufacturing 1.5 1.9 8% 12.7% Top right
Q. Health Care and Social Assistance 1.2 1.3 66% 10.8% Top right
O. Public Administration and Safety 1.2 1.0 -1% 6.1% Top left
H. Accommodation and Food Services 1.1 1.0 35% 2.9% Top right
E. Construction 1.0 1.0 25% 9.0% Top right
G. Retail Trade 1.0 1.1 14% 5.8% Bottom
right
P. Education and Training 0.9 1.0 19% 5.7% Bottom
right
S. Other Services 0.9 0.9 -4% 1.9% Bottom left
Note: While this industry appears to have a comparative advantage at the 1-digit level, further analysis at the 2-digit level identifies that the sub-
industries which comprise this industry sit outside the top 20 industries (2 -digit industries) identified at Table 2.12.
SOURCE: ACIL ALLEN ESTIMATES BASED ON IV DATA
2.3 Goulburn LGA analysis (Level 2 ANZSIC analysis)
The following section incudes revealed comparative advantage analysis by Level 2 ANZSIC industries
for Goulburn’s LGAs: Greater Shepparton, Mitchell, Moira, Murrindindi, and Strathbogie.
The analysis focuses on identifying the key Level 2 ANZSIC industries which fall in the ‘top right’ and
are found to have a likely comparative advantage and growth.
2.3.1 Greater Shepparton
Figure 2.2 shows RCA analysis by ANZSIC Level 2 industries for the Greater Shepparton LGA. Key
industries of interest with a high CAI in the Greater Shepparton LGA include Internet Publishing and
Broadcasting; Agriculture; Agriculture, Forestry and Fishing Support Services; and Food Product
Manufacturing (see Figure 2.2).
11
GOULBURN INDUSTRY PROFILEFIGURE 2.2 COMPARATIVE ADVANTAGE INDEX FOR GREATER SHEPPARTON, 2017-18, LEVEL 2
ANZSIC
7
57. Internet Publ …
6
5
Revealed comparative advantage index
1. Agriculture
4
5. Agri, Forestry Sup.
3
11. Food Manuf …
86. Residential … 38. Commission-Ba …
2
22. Fabricated Metal
84. Hospitals 25. Furniture Manuf …
…
46. Road Transport
1
-50% 0% 50% 100% 150% 200%
0
Percentage change in GVA, 2008-2018 (% )
Note: This includes the revealed comparative advantage relative to the Victorian economy.
SOURCE: ACIL ALLEN ESTIMATES BASED ON IV DATA
Table 2.2 summarises the highest comparative advantage industries (Level 2 ANZSIC) for the Greater
Shepparton LGA using the Victorian CAI comparison. Important industries include Agriculture;
Residential Care Services; and Hospitals which each have large CAI, undergone notable growth over
the past 10 years and constitute a relatively large proportion of the Greater Shepparton’s economic
output.
Various other industries have high CAI and growth but remain a small proportion of Greater
Shepparton’s GVA, such as: Internet Publishing and Broadcasting; Agriculture, Forestry and Fishing
Support Services; Commission-Based Wholesaling; and Furniture and Other Manufacturing.
TABLE 2.2 TOP 10 REVEALED COMPARATIVE ADVANTAGE INDUSTRIES FOR GREATER
SHEPPARTON
Industry (Level 2 ANZSIC) CAI (Victorian CAI (National 10 year % of LGA Quadrant
comparison) comparison) growth GVA
57. Internet Publishing and Broadcasting 6.0 2.9 82% 0.3% Top right
1. Agriculture 4.3 5.5 41% 13.3% Top right
5. Agriculture, Forestry and Fishing 3.2 2.9 95% 0.7% Top right
Support Services
11. Food Product Manufacturing 2.9 3.8 -11% 6.5% Top left
38. Commission-Based Wholesaling 2.1 1.2 113% 0.2% Top right
22. Fabricated Metal Product 1.7 1.8 -18% 1.4% Top left
Manufacturing
86. Residential Care Services 1.6 2.0 55% 2.8% Top right
12
GOULBURN INDUSTRY PROFILEIndustry (Level 2 ANZSIC) CAI (Victorian CAI (National 10 year % of LGA Quadrant
comparison) comparison) growth GVA
84. Hospitals 1.6 5.5 72% 5.0% Top right
25. Furniture and Other Manufacturing 1.4 1.7 152% 0.4% Top right
46. Road Transport 1.3 1.1 -6% 2.2% Top left
SOURCE: ACIL ALLEN ESTIMATES BASED ON IV DATA
Table 2.3 summarises the largest industries (Level 2 ANZSIC) for the Greater Shepparton LGA.
TABLE 2.3 TOP 10 LARGEST INDUSTRIES FOR GREATER SHEPPARTON
Industry (Level 2 ANZSIC) CAI (Victorian CAI (National 10 year % of LGA Quadrant
comparison) comparison) growth GVA
1. Agriculture 4.3 5.5 41% 13.3% Top right
11. Food Product Manufacturing 2.9 3.8 -11% 6.5% Top left
84. Hospitals 1.6 5.5 72% 5.0% Top right
32. Construction Services 0.8 0.7 4% 4.2% Bottom right
69. Professional, Scientific and 0.5 0.4 25% 3.4% Bottom right
Technical Services
42. Other Store-Based Retailing 0.9 1.0 5% 3.2% Bottom right
62. Finance 0.4 - -19% 2.9% Bottom left
85. Medical and Other Health Care 1.2 0.8 98% 2.8% Top right
Services
86. Residential Care Services 1.6 2.0 55% 2.8% Top right
87. Social Assistance Services 1.3 1.9 61% 2.6% Top right
SOURCE: ACIL ALLEN ESTIMATES BASED ON IV DATA
2.3.2 Mitchell
Figure 2.3 shows RCA analysis by ANZSIC Level 2 industries for the Mitchell LGA. Key industries of
interest with a high CAI in the Mitchell LGA include Non-Metallic Mineral Mining and Quarrying; Heavy
and Civil Engineering Construction; Rail Transport; and Grocery, Liquor and Tobacco Product
Wholesaling (see Table 2.4).
13
GOULBURN INDUSTRY PROFILEFIGURE 2.3 COMPARATIVE ADVANTAGE INDEX FOR MITCHELL, 2017-18, LEVEL 2 ANZSIC
6
9. Non-Metallic …
5
4
Revealed comparative advantage index
31. Heavy & Civ …
3
47. Rail Transport
1. Agriculture
32. Construction …
40. Fuel Retailing
2
30. Building Cons …
41. Food Retailing
1
-100% -50% 0% 50% 100% 150%
0
Percentage change in GVA, 2008-2018 (% )
Note: This includes the revealed comparative advantage relative to the Victorian economy. The chart excludes ‘Non-Store Retailing and Retail Commission
Based Buying’ and ‘Grocery, Liquor and Tobacco Product Wholesaling’ to focus the chart on the key industries.
SOURCE: ACIL ALLEN ESTIMATES BASED ON IV DATA
Table 2.4 summarises the highest comparative advantage industries (Level 2 ANZSIC) for the Mitchell
LGA using the Victorian CAI comparison. Important industries include Heavy and Civil Engineering
Construction; Rail Transport; Grocery, Liquor and Tobacco Product Wholesaling; Construction
Services; Agriculture; and Food Retailing. These industries have a large CAI, undergone notable
growth over the past 10 years and constitute a relatively large proportion of Mitchell’s GVA.
The Non-Store Retailing and Retail Commission Based Buying industry has high CAI and growth but
remain a small proportion of Mitchell’s GVA.
TABLE 2.4 TOP 10 REVEALED COMPARATIVE ADVANTAGE INDUSTRIES FOR MITCHELL
Industry (Level 2 ANZSIC) CAI (Victorian CAI (National 10 year % of LGA Quadrant
comparison) comparison) growth GVA
9. Non-Metallic Mineral Mining and 5.5 1.3 -51% 0.3% Top left
Quarrying
31. Heavy and Civil Engineering 3.2 2.3 92% 3.7% Top right
Construction
47. Rail Transport 2.9 1.8 99% 1.1% Top right
36. Grocery, Liquor and Tobacco 2.7 3.1 588% 2.3% Top right
Product Wholesaling
32. Construction Services 2.2 2.0 81% 11.6% Top right
1. Agriculture 2.2 2.8 31% 6.9% Top right
43. Non-Store Retailing and Retail 2.1 0.8 3432% 0.2% Top right
Commission Based Buying
14
GOULBURN INDUSTRY PROFILEIndustry (Level 2 ANZSIC) CAI (Victorian CAI (National 10 year % of LGA Quadrant
comparison) comparison) growth GVA
41. Food Retailing 2.0 1.5 29% 2.9% Top right
40. Fuel Retailing 1.9 1.7 -33% 0.4% Top left
30. Building Construction 1.8 1.7 73% 4.1% Top right
SOURCE: ACIL ALLEN ESTIMATES BASED ON IV DATA
Table 2.5 summarises the largest industries (Level 2 ANZSIC) for the Mitchell LGA.
TABLE 2.5 TOP 10 LARGEST INDUSTRIES FOR MITCHELL
Industry (Level 2 ANZSIC) CAI (Victorian CAI (National 10 year % of LGA Quadrant
comparison) comparison) growth GVA
32. Construction Services 2.2 2.0 81% 11.6% Top right
1. Agriculture 2.2 2.8 31% 6.9% Top right
30. Building Construction 1.8 1.7 73% 4.1% Top right
31. Heavy and Civil Engineering 3.2 2.3 92% 3.7% Top right
Construction
11. Food Product Manufacturing 1.6 2.1 -12% 3.5% Top left
45. Food and Beverage Services 1.4 1.1 46% 3.2% Top right
85. Medical and Other Health Care 1.3 0.9 97% 2.9% Top right
Services
41. Food Retailing 2.0 1.5 29% 2.9% Top right
62. Finance 0.3 - -7% 2.5% Bottom left
69. Professional, Scientific and 0.4 0.3 34% 2.4% Bottom right
Technical Services
SOURCE: ACIL ALLEN ESTIMATES BASED ON IV DATA
2.3.3 Moira
Figure 2.4 shows revealed comparative advantage analysis by Level 2 ANZSIC industries for the
Moira LGA. Key industries of interest with a high CAI in the Moira LGA include Food Product
Manufacturing; Agriculture; Agriculture, Forestry and Fishing Support Services; and Textile, Leather,
Clothing and Footwear Manufacturing (See Table 2.6).
15
GOULBURN INDUSTRY PROFILEFIGURE 2.4 COMPARATIVE ADVANTAGE INDEX FOR MOIRA, 2017-18, LEVEL 2 ANZSIC
12
10
11. Food Manuf …
8
Revealed comparative advantage index 1. Agriculture
6
5. Agri, Forestry Sup.
4
38. Commission-Ba …
40. Fuel Retailing
41. Food Retailing
2
25. Furniture Manuf …
44. Accommodation 53. Warehousing …
-10% 10% 30% 50% 70% 90% 110% 130% 150%
0
Percentage change in GVA, 2008-2018 (% )
Note: This includes the revealed comparative advantage relative to the Victorian economy. The chart excludes ‘13. Textile, Leather, Clothing and Footwear
Manufacturing’ to focus the chart on the key industries.
SOURCE: ACIL ALLEN ESTIMATES BASED ON IV DATA
Table 2.6 summarises the highest comparative advantage industries (Level 2 ANZSIC) for Moira LGA
using the Victorian CAI comparison. Important industries include Food Product Manufacturing;
Agriculture; Agriculture, Forestry and Fishing Support Services; and Food Retailing each of which
have a large CAI, undergone notable growth over the past 10 years and constitute a relatively large
proportion of Moira’s GVA.
Various other industries have high CAI and growth but remain a small proportion of GVA such as
Textile, Leather, Clothing and Footwear Manufacturing; Commission-Based Wholesaling; Fuel
Retailing; Accommodation; and Furniture and Other Manufacturing.
TABLE 2.6 TOP 10 REVEALED COMPARATIVE ADVANTAGE INDUSTRIES FOR MOIRA
Industry (Level 2 ANZSIC) CAI (Victorian CAI (National 10 year % of LGA Quadrant
comparison) comparison) growth GVA
11. Food Product Manufacturing 9.3 12.0 112% 20.7% Top right
1. Agriculture 7.6 9.6 23% 23.8% Top right
5. Agriculture, Forestry and Fishing 4.9 4.4 67% 1.1% Top right
Support Services
13. Textile, Leather, Clothing and 2.3 2.6 1262% 0.6% Top right
Footwear Manufacturing
38. Commission-Based Wholesaling 2.1 1.1 40% 0.2% Top right
40. Fuel Retailing 1.8 1.7 42% 0.4% Top right
41. Food Retailing 1.7 1.2 68% 2.4% Top right
16
GOULBURN INDUSTRY PROFILEIndustry (Level 2 ANZSIC) CAI (Victorian CAI (National 10 year % of LGA Quadrant
comparison) comparison) growth GVA
44. Accommodation 1.5 1.0 35% 0.7% Top right
25. Furniture and Other Manufacturing 1.5 1.8 101% 0.4% Top right
53. Warehousing and Storage Services 1.3 3.5 64% 1.1% Top right
SOURCE: ACIL ALLEN ESTIMATES BASED ON IV DATA
Table 2.7 summarises the largest industries (Level 2 ANZSIC) for the Moira LGA.
TABLE 2.7 TOP 10 LARGEST INDUSTRIES FOR MOIRA
Industry (Level 2 ANZSIC) CAI (Victorian CAI (National 10-year % of LGA Quadrant
comparison) comparison) growth GVA
1. Agriculture 7.6 9.6 23% 23.8% Top right
11. Food Product Manufacturing 9.3 12.0 112% 20.7% Top right
69. Professional, Scientific and 1.2 1.0 462% 7.7% Top right
Technical Services
32. Construction Services 0.6 0.6 3% 3.3% Bottom right
84. Hospitals 0.9 3.1 68% 2.8% Bottom right
85. Medical and Other Health Care 1.1 0.7 163% 2.5% Top right
Services
41. Food Retailing 1.7 1.2 68% 2.4% Top right
42. Other Store-Based Retailing 0.7 0.7 35% 2.4% Bottom right
86. Residential Care Services 1.1 1.4 83% 2.0% Top right
45. Food and Beverage Services 0.8 0.6 75% 1.8% Bottom right
SOURCE: ACIL ALLEN ESTIMATES BASED ON IV DATA
2.3.4 Murrindindi
Figure 2.5 shows revealed comparative advantage analysis by Level 2 ANZSIC industries for the
Murrindindi LGA. Key industries of interest with a high CAI in the Murrindindi LGA include
Aquaculture; Forestry and Logging; Agriculture; Non-Metallic Mineral Mining and Quarrying; and
Accommodation (see Table 2.8).
17
GOULBURN INDUSTRY PROFILEFIGURE 2.5 COMPARATIVE ADVANTAGE INDEX FOR MURRINDINDI, 2017-18, LEVEL 2 ANZSIC
50
2. Aquaculture
40
30
Revealed comparative advantage index
20
3. Forestry …
10 1. Agriculture
9. Non-Metallic …
44. Accommodation 82. Adult, Comm …
25. Furniture Manuf …
0
-100% -50% 0% 50% 100% 150% 200% 250% 300%
38. Commission-Ba … 4. Fishing …
-10
Percentage change in GVA, 2008-2018 (% )
Note: This includes the revealed comparative advantage relative to the Victorian economy. The chart excludes ‘Non-Store Retailing and Retail Commission
Based Buying‘ to focus the chart on the key industries.
SOURCE: ACIL ALLEN ESTIMATES BASED ON IV DATA
Table 2.8 summarises the highest comparative advantage industries (Level 2 ANZSIC) for the
Murrindindi LGA using the Victorian CAI comparison. Important industries include Agriculture and
Adult, Community and Other Education, both of which have a large CAI, undergone notable growth
over the past 10 years and constitute a relatively large proportion of the Murrindindi’s GVA.
Other industries have high CAI and growth but remain a small proportion of GVA such as Fishing,
Hunting and Trapping; Furniture and Other Manufacturing; and Non-Store Retailing and Retail
Commission Based Buying.
TABLE 2.8 TOP 10 REVEALED COMPARATIVE ADVANTAGE INDUSTRIES FOR MURRINDINDI
Industry (Level 2 ANZSIC) CAI (Victorian CAI (National 10-year % of LGA Quadran
comparison) comparison) growth GVA t
2. Aquaculture 43.5 15.4 -22% 0.7% Top left
3. Forestry and Logging 11.1 6.2 -51% 1.1% Top left
1. Agriculture 7.9 10.0 27% 24.8% Top right
9. Non-Metallic Mineral Mining and 7.3 1.8 -6% 0.4% Top left
Quarrying
44. Accommodation 5.6 3.7 -2% 2.7% Top left
82. Adult, Community and Other 4.4 5.1 146% 1.6% Top right
Education
4. Fishing, Hunting and Trapping 3.7 1.6 157% 0.2% Top right
25. Furniture and Other Manufacturing 2.5 3.1 227% 0.7% Top right
18
GOULBURN INDUSTRY PROFILEIndustry (Level 2 ANZSIC) CAI (Victorian CAI (National 10-year % of LGA Quadran
comparison) comparison) growth GVA t
43. Non-Store Retailing and Retail 2.4 0.9 945% 0.2% Top right
Commission Based Buying
38. Commission-Based Wholesaling 2.4 1.3 -49% 0.3% Top left
SOURCE: ACIL ALLEN ESTIMATES BASED ON IV DATA
Table 2.9 summarises the largest industries (Level 2 ANZSIC) for the Murrindindi LGA.
TABLE 2.9 TOP 10 LARGEST INDUSTRIES FOR MURRINDINDI
Industry (Level 2 ANZSIC) CAI (Victorian CAI (National 10-year % of LGA Quadrant
comparison) comparison) growth GVA
1. Agriculture 7.9 10.0 27% 24.8% Top right
69. Professional, Scientific and 1.1 0.9 310% 7.1% Top right
Technical Services (Except
Computer System Design and
Related Services)
32. Construction Services 1.1 1.0 7% 5.9% Top right
44. Accommodation 5.6 3.7 -2% 2.7% Top left
84. Hospitals 0.9 2.9 44% 2.7% Bottom right
45. Food and Beverage Services 1.2 0.9 -1% 2.7% Top left
41. Food Retailing 1.9 1.3 49% 2.6% Top right
30. Building Construction 1.2 1.0 -3% 2.6% Top left
86. Residential Care Services 1.4 1.7 -2% 2.5% Top left
67. Property Operators and Real 0.7 0.4 21% 2.4% Bottom right
Estate Services
SOURCE: ACIL ALLEN ESTIMATES BASED ON IV DATA
2.3.5 Strathbogie
Figure 2.6 shows revealed comparative advantage analysis by Level 2 ANZSIC industries for the
Strathbogie LGA. Key industries of interest with a high CAI in the Strathbogie LGA include
Aquaculture; Agriculture; Beverage and Tobacco Product Manufacturing; and Non-Metallic Mineral
Mining and Quarrying (see Table 2.10).
19
GOULBURN INDUSTRY PROFILEFIGURE 2.6 COMPARATIVE ADVANTAGE INDEX FOR STRATHBOGIE, 2017-18, LEVEL 2 ANZSIC
20
2. Aquaculture
15
1. Agriculture
12. Beverage …
Revealed comparative advantage index
10
9. Non-Metallic …
5
5. Agri, Forestry Sup. 44. Accommodation 7. Oil & Gas …
73. Building … 86. Residential …
-100% -50% 0 0% 50% 100% 150% 200% 250%
38. Commission-Ba …
-5
Percentage change in GVA, 2008-2018 (% )
Note: This includes the revealed comparative advantage relative to the Victorian economy.
SOURCE: ACIL ALLEN ESTIMATES BASED ON IV DATA
Table 2.10 summarises the highest comparative advantage industries (Level 2 ANZSIC) for the
Strathbogie LGA using the Victorian CAI comparison. Important industries include Agriculture and
Residential Care Services, both of which have a large CAI, have undergone notable growth over the
past 10 years and constitute a relatively large proportion of Strathbogie’s GVA.
While Beverage and Tobacco Product Manufacturing; Agriculture, Forestry and Fishing Support
Services; and Commission-Based Wholesaling have a high CAI, these industries have seen negative
growth over the past 10 years.
Various other industries have high CAI and growth but remain a small proportion of Strathbogie’s
GVA, such as Aquaculture; Non-Metallic Mineral Mining and Quarrying; Oil and Gas Extraction;
Accommodation; and Building Cleaning, Pest Control and Other Support Services.
TABLE 2.10 TOP 10 REVEALED COMPARATIVE ADVANTAGE INDUSTRIES FOR STRATHBOGIE
Industry (Level 2 ANZSIC) CAI (Victorian CAI (National 10-year % of LGA Quadran
comparison) comparison) growth GVA t
2. Aquaculture 16.5 5.8 144% 0.3% Top right
1. Agriculture 13.2 16.5 50% 41.2% Top right
12. Beverage and Tobacco Product 12.1 9.5 -63% 4.2% Top left
Manufacturing
9. Non-Metallic Mineral Mining and 6.7 1.6 4% 0.4% Top right
Quarrying
5. Agriculture, Forestry and Fishing 2.3 2.0 -52% 0.5% Top left
Support Services
20
GOULBURN INDUSTRY PROFILEIndustry (Level 2 ANZSIC) CAI (Victorian CAI (National 10-year % of LGA Quadran
comparison) comparison) growth GVA t
86. Residential Care Services 2.3 2.7 155% 3.9% Top right
38. Commission-Based Wholesaling 2.1 1.1 -39% 0.2% Top left
7. Oil and Gas Extraction 2.0 0.3 223% 0.7% Top right
44. Accommodation 1.8 1.2 77% 0.9% Top right
73. Building Cleaning, Pest Control and 1.7 1.1 10% 0.8% Top right
Other Support Services
SOURCE: ACIL ALLEN ESTIMATES BASED ON IV DATA
Table 2.11 summarises the largest industries (Level 2 ANZSIC) for the Strathbogie LGA.
TABLE 2.11 TOP 10 LARGEST INDUSTRIES FOR STRATHBOGIE
Industry (Level 2 ANZSIC) CAI (Victorian CAI (National 10-year % of LGA Quadrant
comparison) comparison) growth GVA
1. Agriculture 13.2 16.5 50% 41.2% Top right
32. Construction Services 1.0 0.9 22% 5.3% Top right
12. Beverage and Tobacco 12.1 9.5 -63% 4.2% Top left
Product Manufacturing
86. Residential Care Services 2.3 2.7 155% 3.9% Top right
69. Professional, Scientific and 0.4 0.4 52% 2.8% Bottom right
Technical Services (Except
Computer System Design and
Related Services)
30. Building Construction 1.2 1.1 30% 2.7% Top right
45. Food and Beverage Services 1.2 0.9 39% 2.7% Top right
85. Medical and Other Health Care 0.9 0.6 168% 2.0% Bottom right
Services
46. Road Transport 1.2 1.0 -6% 2.0% Top left
42. Other Store-Based Retailing 0.6 0.6 76% 2.0% Bottom right
SOURCE: ACIL ALLEN ESTIMATES BASED ON IV DATA
2.4 Summary (Level 2 ANZSIC analysis)
Table 2.12 summarises the highest revealed comparative advantage industries (Level 2 ANZSIC) for
the LGAs within Goulburn, using the Victorian CAI comparison.
Traditionally considered a ‘food bowl’ for Victoria, Goulburn is heavily reliant on primary (agriculture)
and secondary (food product and beverage manufacturing) industries. Agriculture demonstrates a
strong comparative advantage across Strathbogie, Murrindindi, Moira and Greater Shepparton.
Agriculture is a significant proportion of each LGA’s economic activity, and has demonstrated strong
growth across those LGAs of between 23 – 50 per cent in the last decade. The performance of
agriculture in these areas is a result of modern farm businesses that utilise the highly fertile soils, mild
climate and access to irrigation water from the Murray and Goulburn rivers. The region is a nationally
significant production base for dairy, apples, pears and stone fruits. The resilience of these industries
is evident in response to depressed commodity prices, variable seasonal conditions and the
increasing cost of irrigation water.
The food and beverage processing industries are interlinked with the dairy and horticultural sectors
that dominate the region. Food Product Manufacturing in Moira demonstrates a strong comparative
advantage, strong sectoral growth in the last decade is the largest in Goulburn. Areas such as Greater
21
GOULBURN INDUSTRY PROFILEYou can also read