2019 STATE OF THE WORKFORCE REPORT - SANTA CRUZ COUNTY - Santa Cruz Human ...
←
→
Page content transcription
If your browser does not render page correctly, please read the page content below

2019 STATE OF THE WORKFORCE REPORT
SANTA CRUZ COUNTY

2019 STATE OF THE WORKFORCE REPORT
SANTA CRUZ COUNTY

PREPARED BY BEACON ECONOMICS

Founded in 2007, Beacon Economics, an LLC and certified Small Business Enterprise (SBE) with the state
of California, is an independent research and consulting firm dedicated to delivering accurate, insightful,
and objectively-based economic analysis. Leveraging unique proprietary models, vast databases, and
sophisticated data processing, the company specializes in services like industry analysis, economic policy
analysis, economic impact analysis, and real estate market analysis. Beacon Economics equips its clients
with both the data and analysis required to understand the significance of on-the-ground realities and
make informed business and policy decisions.

Learn more at www.BeaconEcon.com.

PROJECT ADVISORS

CHRISTOPHER THORNBERG, PHD
Founding Partner

PROJECT TEAM

ADAM J. FOWLER                                        HOYU CHONG
Director of Research                                  Senior Research Associate

ALYSA HANNON                                          MAZEN BOU ZEINEDDINE
Sustainable Growth and Development                    Research Associate
Practice Manager

ACKNOWLEDGMENTS

COMMISSIONED BY
The Workforce Development Board (WDB) of Santa Cruz County

Comprised of local business leaders, educational leaders, elected officials, and community-based
organization leaders; the Santa Cruz County Workforce Development Board of Directors (WDB) oversees
the services of Workforce Santa Cruz County. The WDB is dedicated to help Santa Cruz jobseekers access
the tools they need to manage their careers and to help local employers find the skilled workers they need
to compete and succeed.

The WDB is responsible for providing oversight and policy direction for the utilization of Workforce
Innovation and Opportunity Act (WIOA) funds in Santa Cruz County. The WDB is a majority business-
led body, appointed by the Santa Cruz County Board of Supervisors. The WDB, whose composition is
defined by the WIOA, includes 25 individuals representing business, one-stop partners, community-based
organizations, local educational entities, economic development agencies, and labor.

This WIOA Title I – financially assisted program or activity is an equal opportunity employer/program.
Auxiliary aids and services are available upon request to individuals with disabilities.
SPECIAL THANKS TO

Alia Ayyad, Center for Employment Training; Barbara Mason, County of Santa Cruz; Bryce Root, The Root
Group; Candice Elliott, Fortress and Flourish; Carmen Herrera-Mansir, El Pajaro Community Development
Corp.; Carol Siegel, Santa Cruz Seaside Company; Christina Cuevas, Cabrillo College; Diane Berry-
Wahrer, Department of Rehabilitation; Dustin Vereker, Discretion Brewing Company; Elisa Orona, Health
Improvement Partnership of Santa Cruz County; Elyse Destout, Photography by Elyse Destout; Francisco
Rodriguez, PVFT Union Local 1936; Glen Schaller, Monterey Bay Central Labor Council, AFL-CIO; Katie
Borges, Palo Alto Medical Foundation; Mark Hodges, County Office of Education Regional Occupational
Program; MariaElena De La Garza, Community Action Board; Marshall Delk, Santa Cruz County Bank;
Rob Morse, Pacific Gas & Electric Company; Sean Hebard, Carpenters Local 505; Shaz Roth, Pajaro
Valley Chamber of Commerce; Todd Livingstone, Watsonville/Aptos Adult Education; Yuko Duckworth,
Employment Development Department; Andy Stone, Workforce Development Board, County of Santa Cruz.

The contents of this report are based on information derived from carefully selected sources we believe are reasonable. We do not guarantee
its accuracy or completeness and nothing in this document shall be construed to be a representation of such a guarantee.

TABLE OF
CONTENTS
1
KEY FINDINGS

7
WORKFORCE PROFILE

41
ECONOMIC FORECAST

45
REGIONAL ANALYSIS

49
INDUSTRY ANALYSIS & TARGET INDUSTRIES

69
OCCUPATIONAL ANALYSIS & TARGET OCCUPATIONS

87
RECOMMENDATIONS

State of the Workforce Report | 2019

KEY
FINDINGS
The Santa Cruz County Workforce Development Board (WDB) engaged Beacon Economics
to analyze a range of indicators related to the County’s labor market and economy and
provide policy recommendations pertaining to workforce development based on the
challenges and opportunities identified in the analysis.

Key goals of the Santa Cruz County Workforce Development Board (WDB) in commissioning this report
include analyzing the region’s changing economic and workforce landscape and identifying actionable
opportunities to connect the local talent pipeline with the evolving needs of the County’s employers and
key industries.

WORKFORCE PROFILE SUMMARY

    •   Between 2012 and 2017, the number of employed residents living in Santa Cruz County decreased
        0.4% and the number of workers in Santa Cruz County decreased 1.2% over that same period.

    •   In 2017, non-Hispanic whites made up over 60% of the County’s working-age resident population,
        followed by Hispanic/Latino residents who made up 30% of the County’s working-age population.
        The County’s workforce population has a higher share of racial minorities than the County’s
        resident profile.

    •   33.4% of the County’s resident population age 16 and older had a bachelor’s degree or above and
        33.2% held a high school diploma or less. This means that the number of working-age residents
        with at least a bachelor’s degree outnumbered residents with a high school diploma or less by a
        mere 500.

1
State of the Workforce Report | 2019

•   There are slightly more females than males in Santa Cruz
    County both in terms of total resident population and
    resident working-age population but the opposite is true
    for the workforce population where males outnumber
    females 101.3 to every 100.

•   Young professionals ages 25 to 34 is the largest age
    group for workforce demographics while the 55 to 64
    age group is the largest group for resident demographics.

•   Just under one-third of high school graduates in the Class
    of 2018 in Santa Cruz County are deemed prepared,
    according to the College/Career Indicator.

•   Between 2012 and 2017, the number of individuals
    whose income was between $150,000 and $199,999
    doubled, while those making $200,000 to $250,000 and
    over $250,000 increased 61% and 55%, respectively.

•   The proportion of the workforce population making less than $50,000 per
    annum has declined notably from 70% in 2012 to 59% in 2017, while the share
    of the workforce population making at least $50,000 but less than $75,000 increased
    from 14% to 20% during the same period.

•   Among young professionals ages 25 to 29, the percentage share who are living with parents or
    parents-in-laws jumped from 17% to 46% between 2012 and 2017.

•   Among residents age 25 and above who work, the average (both mean and median) wages of those
    who work in the Bay Area are at least double the average wages of those who work in Santa Cruz
    County.

•   The County’s resident population is growing, and so is employment among the resident population, yet
    its workforce growth is lagging behind, suggesting that more residents are being employed outside of
    the County.

                                                                                                       2
State of the Workforce Report | 2019

KEY INDICATORS SUMMARY

                         KEY INDICATOR 1 — LABOR FORCE PARTICIPATION RATE:
                         Except for County residents ages 16 to 24 and 55 to 59, LFPR is
                         lower in 2017 than it was in 2012 for all other age groups.

                         KEY INDICATOR 2 — AGING RESIDENT POPULATION:
                         Given the significant rise in seniors in the County, it follows
                         that the retiree-to-worker ratio (elderly dependency ratio) has also
                         rapidly increased1 from 16.7 in 2012 to 21.6 in 2017. The County’s elderly
                         dependency ratio has now surpassed that of Alameda County, San Francisco County,
                         Santa Clara County, Monterey County, and California state.

                         KEY INDICATOR 3 — COMMUTE PATTERNS:
                         Unlike the commuting trends at play among the resident population – a larger share of
                         which commute north to the Bay Area (17%) than south to Monterey County (5%) -- the
                         opposite dynamics are at play among the workforce population. Just 5% of the workforce
                         population hails from the Bay Area, compared to 9% from Monterey County.

                         KEY INDICATOR 4 — COST OF LIVING:
                         For County residents earning between $50,000 and $99,999, those living in South County
                         are twice as likely to rent than their similarly earning North County2 peers (50% vs. 25%).

FORECAST AND GEOGRAPHIC ANALYSIS SUMMARY

•   Beacon Economics expects the County of Santa Cruz to reach roughly 109,430 employees by 2022.
    The three-year projected growth rate is 5.3% - or an additional 5,530 workers over that time horizon.

•   The Northern subregion of Santa Cruz County has seen employment expand by 16.3%, while the Southern
    subregion has grown by only 8.0%. Total employment in North Santa Cruz County reached roughly 59,600
    workers in 2016 – while South Santa Cruz County employment stood at approximately 12,240 employees.

1
 A measure derived by dividing the population 65 years and over by the 18 to 64 years population and multiplying by 100.
2
 Please see Table 3.1 in the Regional Analysis section of this report for a complete listing of zip codes included in North Santa Cruz County
and in South Santa Cruz County.

3
State of the Workforce Report | 2019

                                                          •   The two largest employing industries in order
                                                              of employment footprint were Trade/Transport/
                                                              Utilities and Education/Health for both the
                                                              Northern and Southern sub-regions of Santa
                                                              Cruz County.

                                                          •   The County’s self-employed figures have seen
                                                              notable changes in the past few years. According
                                                              to the latest data from the Census, the number
                                                              of self-employed workers in Santa Cruz County
                                                              has increased from 23,300 in 2011 to 25,080
                                                              in 2016 – an increase of 7.5%. The largest
                                                              industry represented by self-employed workers
                                                              is Professional/Business.

TARGET INDUSTRIES AND OCCUPATIONS SUMMARY

•   TARGET INDUSTRY 1: The Education/Health               •   Four target occupations were selected for
    industry with almost 18,000 workers represented           prioritization by the County independent of
    the second largest employer in Santa Cruz County          industry targets based on scoring methodology:
    and the County’s largest private employer.                (1) Management; (2) Business and Financial; (3)
                                                              Computer and Mathematical; and (4) Healthcare
•   TARGET INDUSTRY 2: With a growth rate of                  Practitioners and Technical.
    27.7%, Transport/Warehouse/Utilities, a subsector
    of the Trade/Transport/Utilities umbrella industry,   •   The first three target occupations are applicable
    has emerged as one of the fastest growing                 across the three target industries, while the
    industries in the Santa Cruz County economy.              Healthcare Practitioners and Technical occupation,
                                                              which scored poorly in transferability, is mostly
•   TARGET INDUSTRY 3: The Finance and Insurance              applicable to the Education/Healthcare target
    industry is the highest paying sector in the region       industry.
    with an annual average wage of $77,560.
                                                          •   Of the top three industry-agnostic occupations in
•   INDUSTRY SPOTLIGHT: With an annual average                the County – meaning, occupations employed by a
    wage in the industry of $68,180, Manufacturing            variety of industries, Management and Business &
    has become one of the fast growing and highest            Financial are also target occupations.
    paying industries in the County of Santa Cruz.

                                                                                                                4
State of the Workforce Report | 2019

5
State of the Workforce Report | 2019

                            INTRODUCTION

                            The Santa Cruz County Workforce Development Board
                            (WDB) engaged Beacon Economics to undertake an
                            analysis of a range of indicators related to the labor
                            market and economy of the County and provide
                            policy recommendations based on the challenges and
                            opportunities resultant of the analysis.

                            Key goals of the Santa Cruz County Workforce Development Board
                            (WDB) in commissioning this report include analyzing the region’s
                            changing economic and workforce landscape and identifying actionable
                            opportunities to connect the local talent pipeline with the evolving
                            needs of the County’s employers and key industries.

                                                                                                   6
State of the Workforce Report | 2019 WORKFORCE PROFILE DEMOGRAPHIC ANALYSIS For the purpose of this study, Beacon will focus on the working age population (ages 16 and up) and will provide an overview of the resident population3 and of the workforce population4 pertaining to the working age population only. Santa Cruz County is considered to be part of the Central Coast, which also consists of Monterey County, San Luis Obispo County, and Santa Barbara County. However, due to its proximity to Santa Clara County and the Bay Area in general, many of its residents commute from Santa Cruz County to the Bay Area where jobs tend to be higher-paying. For this reason, the demographics section will draw comparisons to both the Central Coast as well as the Bay Area. 3 Individuals who reside in Santa Cruz County but may or may not work in Santa Cruz County. 4 Individuals who work in Santa Cruz County but may or may not live in Santa Cruz County. 7
POPULATION

RESIDENT POPULATION
From 2012 to 20175, the total population of Santa Cruz County expanded by
4.2%, slightly above the 3.9% population growth rate in the state overall over
the same period. Population growth from 2012 to 2017 was strongest in the
County’s two largest cities – Santa Cruz City (+6.1%) and Watsonville (+4.9%) -
while smaller cities such as Capitola (+2.5%) and Scotts Valley (+3.1%) recorded
more modest gains during that same period.

POPULATION GROWTH 2012-2017 BY CITY, SANTA CRUZ COUNTY
Figure 1.1

    7%

    6%

    5%
                                                          Santa Cruz County:
                                                                +4.2%
    4%

    3%

    2%

    1%

    0%
                Capitola            Santa Cruz (city)         Scotts Valley           Watsonville

Source: U.S. Census Bureau, American Community Survey 5-Year Estimates; Analysis by
Beacon Economics

5
 While 1-year estimates are available at the county level, Beacon has opted to use 5-year estimates to be
consistent with the city level data, which do not all have available 1-year estimates

                                                                                                       8
State of the Workforce Report | 2019
Compared to its neighboring counties, total population growth of Santa Cruz County is most similar to
Monterey County, where population grew 4.1% from 2012 to 2017. Despite their higher costs of living,
Santa Clara County (+6.9%) and San Mateo County (+5.9%) to the north both had faster population
growth rates than Santa Cruz County during the same period – presumably because their higher wages
and array of job opportunities outweigh the higher costs of living in the Bay Area.
Santa Cruz County’s working age population grew 4.1% from 2012 to 2017, which is essentially the same
as the County’s total population growth rate.
POPULATION GROWTH, 2012-2017 BY COUNTY
Figure 1.2
107
106
105
Population (Indexed to 2012 Values)
104
103
102
101
100
2012 2013 2014 2015 2016 2017
California Monterey San Mateo Santa Clara Santa Cruz
Source: U.S. Census Bureau, American Community Survey 5-Year Estimates; Analysis by Beacon Economics
9State of the Workforce Report | 2019
WORKFORCE POPULATION
There are more County residents who work than there are people employed as workers in the County.
Furthermore, between 2012 and 2017, while the number of employed residents living in Santa Cruz County
decreased 0.4%, the number of workers in Santa Cruz County decreased 1.2% over that same period.
RESIDENT WORKERS VS WORKFORCE POPULATION, SANTA CRUZ COUNTY
Figure 1.3
140
135
130
Number of Workers/Population (Thousands)
125
120
115
110
105
100
2012 2013 2014 2015 2016 2017
Number of workers in SCC Number of employed residents in SCC
Source: U.S. Census Bureau, American Community Survey Public Use Microdata Samples; Analysis by Beacon Economics
10State of the Workforce Report | 2019 RACE/ETHNICITY RESIDENT POPULATION, RACE/ETHNICITY In 2017, non-Hispanic whites made up over 60% of the County’s working-age resident population, followed by Hispanic/Latino residents who made up 30% of the County’s working-age population. However, there are notable differences with regard to subregional racial composition within the County. In South Santa Cruz County6, which includes the City of Santa Cruz and the City of Capitola, two-thirds (66.5%) of the working-age resident population is non-Hispanic white, which would be even slightly higher if the student population from UC Santa Cruz was excluded, which has significantly higher shares of Hispanic and Asian populations relative to the County sub-region7. Hispanic is the next largest ethnicity, but making up only 21% of the South County region’s working-age resident population. In North Santa Cruz County, which includes the City of Watsonville and the City of Scotts Valley, non-Hispanic Whites were the largest group at 53% followed by Hispanics at 37%. Asians, Blacks, and Other groups each made up less than 5% of the sub-region. While the County’s workforce has a higher share of racial minorities than the County’s resident profile, its Hispanic workforce declined 10% from 43,900 to 39,600 between 2012 and 2017. Many of these Hispanic workers also have less than a high school education. 6 2010 PUMA 8702 7 The UC Santa Cruz student population by ethnicity for the 2018 Fall Quarter can be retrieved here: https://diversity.ucsc.edu/diversity/ images/student_demo2018.pdf 11
State of the Workforce Report | 2019

 POPULATION BY RACE, AGES 16 AND OVER, 2017
 Figure 1.4

                  North Santa Cruz County:
            Watsonville & Scotts Valley Cities

                   South Santa Cruz County:
                            Santa Cruz City

                          Santa Cruz County

                                                 0%             20%              40%              60%            80%            100%

            Non-Hispanic White          Hispanic (All Races)          Non-Hispanic Asian         Non-Hispanic Black     Other

 Source: U.S. Census Bureau, American Community Survey Public Use Microdata Samples; Analysis by Beacon Economics

 WORKFORCE POPULATION, RACE/ETHNICITY
 While the County’s workforce has a higher share of racial minorities than the County’s resident profile,
 its Hispanic workforce declined 10% from 43,900 to 39,600 between 2012 and 2017. Many of these
 Hispanic workers also have less than a high school education.

 CHANGE IN WORKFORCE DEMOGRAPHICS BY RACE
 Figure 1.5

            122       121.1             -4.3
                                                                                           0.9            -0.7
            120                                                            1.0                                         119.7
                                                          1.7
            118
Thousands

            116

            114

            112

            110
                      2012            Hispanic        Non-Hispanic    Non-Hispanic     Non-Hispanic      Other         2017
                                     (All Races)         Asian           Black            White

 Source: U.S. Census Bureau, American Community Survey Public Use Microdata Samples; Analysis by Beacon Economics

                                                                                                                                12
State of the Workforce Report | 2019
GENDER
RESIDENT POPULATION, GENDER
There are slightly more females than
males in Santa Cruz County both in terms
of total resident population and resident
working-age population. With regard to
the County’s total resident population,
there are 98.6 males for every 100
females and for its resident working-age
population, there are 96.8 males for every
100 females.
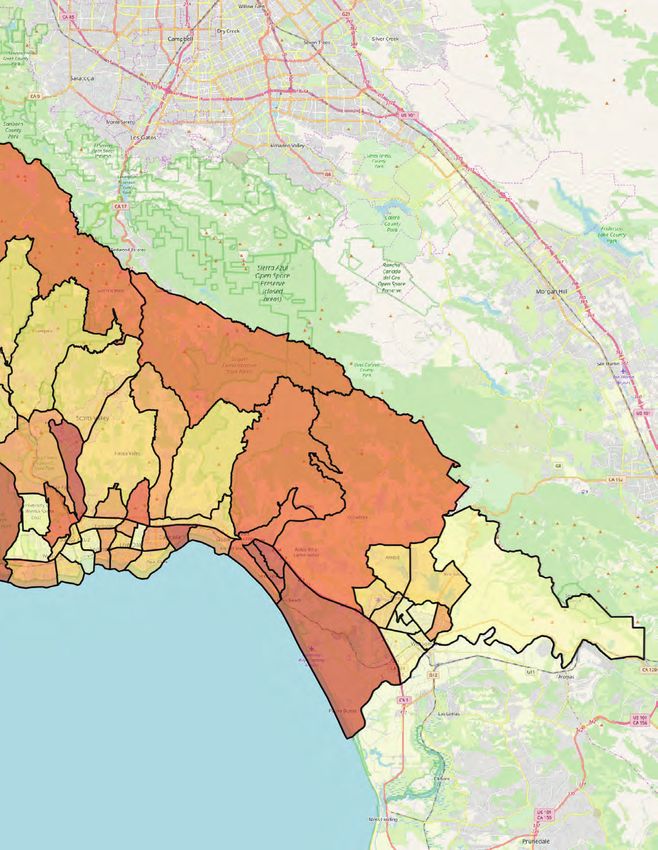
The seemingly balanced gender ratio at the
county level masks the underlying gender
imbalances at the census tract level. For
example, there are fewer than 85 males
for every 100 females in census tracts
corresponding to west Santa Cruz City,
UC Santa Cruz, east Capitola, northwest
Live Oak, and west Watsonville. On the
other hand, there are more than 115 males
for every 100 females in census tracts
corresponding to Watsonville Municipal
Airport, Downtown Watsonville, UC Santa
Cruz Coastal Science Campus, and Castle
Rock State Park.
WORKFORCE POPULATION, GENDER
The opposite is true for the County’s GENDER RATIO IN SANTA CRUZ COUNTY
BY CENSUS TRACT
workforce population: There are slightly Figure 1.6
more males than females. There are 101.3 Source: U.S. Census Bureau, American Community Survey
males for every 100. 5-Year Estimates; Analysis by Beacon Economics
13State of the Workforce Report | 2019
GENDER RATIO
75-85
85-95
95-105
105-115
115-125
(Less than 100 = More Females than Males)
14State of the Workforce Report | 2019
AGE
RESIDENT POPULATION VS.
WORKFORCE POPULATION
Among the prime working age group
(ages 25 to 64), the County’s workforce
demographics trend younger compared
to its resident demographics. Young
professionals ages 25 to 34 is the largest
age group for workforce demographics
while the 55 to 64 age group is the largest
group for resident demographics.
PRIME WORKING AGE POPULATION, WORKFORCE VS. RESIDENT DEMOGRAPHICS, 2017
Figure 1.7
30%
25%
20%
15%
10%
5%
0%
Workforce Resident
Demographics Demographics
25 to 34 35 to 44 45 to 54 55 to 64
Source: U.S. Census Bureau, American Community Survey Public Use Microdata Samples; Analysis by Beacon Economics
15State of the Workforce Report | 2019
EDUCATIONAL ATTAINMENT
RESIDENT POPULATION, EDUCATIONAL
ATTAINMENT
In 2017, 33.4% of the County’s resident population age 16
and older had a bachelor’s degree or above, a slight increase
compared to 2012’s 32.7%. Meanwhile, those with a high
school diploma or less accounted for a similar share (33.2%)
of the County’s working-age resident population in 2017.
This means the number of working-age residents with at
least a bachelor’s degree outnumbered residents with a high
school diploma or less by a mere 500. Among the 9,000 new
working-age residents added to the resident population
between 2012 and 2017, high school graduates (+5,600) and
those with a bachelor’s degree (+3,600) accounted for the
largest shares of new residents.
POPULATION CHANGE BY EDUCATIONAL ATTAINMENT, RESIDENT POPULATION AGES 16
AND OLDER, SANTA CRUZ COUNTY, 2012 VS 2017
Figure 1.8
230
228
226
224
222
Thousands
220
218
216
214
212
210
2012 Less Than High School Some Bachelors Grad./Prof. 2017
Population High School Graduate College Degree Degree Population
Source: U.S. Census Bureau, American Community Survey Public Use Microdata Samples; Analysis by Beacon Economics
16State of the Workforce Report | 2019
Among the resident population age 25 and older, 40% had at least a bachelor’s degree in 2017, a share
significantly higher than that of the County’s Central Coast peers but lower than that of its Bay Area
counterparts.
PERCENT OF POPULATION AGE 25 AND OLDER WITH AT LEAST A BACHELOR’S DEGREE,
2017
Figure 1.9
60%
50%
40%
30%
20%
10%
0%
San Santa San Alameda Contra Santa San Luis Santa Monterey
Francisco Clara Mateo Costa Cruz Obispo Barbara
Bay Area Peers Central Coast Peers
Bachelor’s Graduate/Professional
Source: U.S. Census Bureau, American Community Survey Public Use Microdata Samples; Analysis by Beacon Economics
17State of the Workforce Report | 2019
RESIDENT POPULATION, EDUCATIONAL Just under one-third of high school graduates
ATTAINMENT: EDUCATIONAL OUTCOMES OF in the Class of 2018 in Santa Cruz County are
CLASS OF 2018 deemed prepared, according to the College/Career
Because the County’s high school graduates Indicator8. The County’s peer regions all have a
represent its future talent pipeline, it is important to higher percentage of high school graduates who
assess how well-prepared they are for either post- are considered to be prepared by the same metrics.
secondary education or career development. Notably, Santa Cruz County’s share of prepared
students is also 10-percentage points lower than
the statewide average.
PREPAREDNESS OF 2018 HS GRADUATES (COLLEGE/CAREER INDICATOR)
Figure 1.10
Santa Clara 56.1 13.4 30.4
San Mateo 54.5 13.7 31.6
Statewide 42.2 17.1 40.7
Monterey 40.0 18.8 40.6
Santa Cruz 32.2 23.6 44.1
0% 20% 40% 60% 80% 100%
Percent of student prepared Percent of students APPROACHING prepared Percent of students NOT prepared
Source: California Department of Education; Analysis by Beacon Economics
8
The College/Career Indicator (CCI) measures how well local educational agencies (LEAs) and schools are preparing students for likely suc-
cess after graduation. Currently, the following are measure in the CCI: CTE Pathway Completion, Smart Balanced Summative Assessments,
Advanced Placement Exams, International Baccalaureate Exams, Dual Enrollment (College Credit), UC/CSU a-g Completion, State Seal of
Bi-literacy, and Leadership/Military Experience. For more information, please see the CCI dashboard flyer at: https://www.cde.ca.gov/ta/ac/
cm/documents/ccidashboardflyer.pdf
18State of the Workforce Report | 2019
SANTA CRUZ COUNTY STUDENTS LESS READY FOR POST-HIGH SCHOOL CLASS OF 2018
Figure 1.11
60%
50%
Percent of Class of 2018 Student
40%
30%
22.7% 21.1%
20%
14.3%
10%
4.6%
3.1%
0.2%
0%
AP + IB Exam Smarter Balanced College Credits UC/CSU A-G CTE Pathway Biliteracy
(assuming Summative req
additive) Assessments
Santa Cruz Monterey San Mateo Santa Clara Statewide
Source: California Department of Education; Analysis by Beacon Economics
Santa Cruz County’s high school students are Mateo County, and 34% statewide. In every
falling behind their peers in each of the individual measure, Santa Cruz County students perform
CCI measure. For example, just 21% of the below state averages and only perform better
students have met the UC and CSU a-g than their Monterey County counterparts in
requirements9, compared to 33% in Monterey AP/IB exams10 and Smart Balanced Summative
County, 48% in Santa Clara County, 48% in San Assessments.11
9
The a-g requirements are the absolute minimum standards in order for a student to be eligible for admissions to the CSU and UC system and
by no means guarantee entry. Most incoming CSU and UC freshmen far exceed the standards prescribed in the a-g requirements.
10
Score of 3 (passing grade) or higher on two AP exams and Score of 4 or higher on two IB exams.
11
Score of Level 3 “Standard Met” or higher on both English language arts/literacy (ELA) and mathematics.
19State of the Workforce Report | 2019
WORKFORCE POPULATION, EDUCATIONAL ATTAINMENT
The County’s workforce is becoming increasingly well-educated. The share of the County’s workforce with
at least a bachelor’s degree increased from 34% in 2012 to 37% in 2017. But this increase in educational
attainment level across the County’s workforce may in part be due to a decrease in less educated workers.
Between 2012 and 2017 the County shed over 6,000 workers with less than a high school diploma,
reflecting an almost 30% decline just five years.
EDUCATIONAL ATTAINMENT OF COUNTY WORKFORCE
Figure 1.12
2017 13% 19% 32% 23% 14%
2012 18% 16% 32% 21% 13%
0% 10% 20% 30% 40% 50% 60% 70% 80% 90% 100%
Less Than High School High School Graduate Some College Bachelors Degree Grad./Prof. Degree
Source: U.S. Census Bureau, American Community Survey Public Use Microdata Samples; Analysis by Beacon Economics
20State of the Workforce Report | 2019
INCOME
RESIDENT POPULATION, INCOME Percentage wise, individuals earning at least
In 2017, 29% of the working-age resident $150,000 represented the fastest growing groups.
population had an income of under $10,000, which Between 2012 and 2017, the number of individuals
is about the same as 2012’s share (30%). 55% had whose income was between $150,000 and
an income less than $30,000 while just 12% had at $199,999 doubled, while those making $200,000
least a six-figure income in 2017. to $250,000 and over $250,000 increased 61% and
55%, respectively. Nevertheless, these high earning
residents collectively make up only 7% of the
County’s working-age resident population.
INCOME OF COUNTY WORKFORCE
Figure 1.13
2012 2017
Over $250,000
$200,000 to $250,000
$150,000 to $199,999
$100,000 to $149,000
$75,000 to $99,999
$50,000 to $74,999
$40,000 to $49,999
$30,000 to $39,999
$20,000 to $29,999
$10,000 to $19,999
Under $10,000
70 60 50 40 30 20 10 0 0 10 20 30 40 50 60 70
Thousands Thousands
Source: U.S. Census Bureau, American Community Survey Public Use Microdata Samples; Analysis by Beacon Economics
21State of the Workforce Report | 2019
WORKFORCE POPULATION, INCOME Percentage wise, individuals earning at least
The proportion of the workforce population making $150,000 represented the fastest growing groups.
less than $50,000 per annum has declined notably The number of individuals in the workforce
from 70% in 2012 to 59% in 2017, while the population whose income was between $150,000
share of the workforce population making at least and $199,999 tripled between 2012 and 2017.
$50,000 but less than $75,000 increased from 14% Nevertheless, these high earning residents
to 20% during the same period. collectively make up just 7% of the County’s
working age population.
INCOME OF COUNTY WORKFORCE
Figure 1.14
2012 2017
Over $250,000
$200,000 to $250,000
$150,000 to $199,999
$100,000 to $149,000
$75,000 to $99,999
$50,000 to $74,999
$40,000 to $49,999
$30,000 to $39,999
$20,000 to $29,999
$10,000 to $19,999
Under $10,000
20% 16% 12% 8% 4% 0% 0% 4% 8% 12% 16% 20%
Source: U.S. Census Bureau, American Community Survey Public Use Microdata Samples; Analysis by Beacon Economics
22State of the Workforce Report | 2019
TENURE
RESIDENT POPULATION, TENURE
Despite a statewide housing shortage and
excerabating affordability issues, more
residents from every age group are living
in owned units in 2017 than in 2012.
WORKFORCE POPULATION, TENURE
While the share of the County’s workforce
population living in owner-occupied
households has ticked up significantly
between 2012 (49%) to 2017 (65%), an
increasing number are also living with their
parents or parent-in-laws.
POPULATION BY HOUSING TENURE LIVING IN RENTED UNITS VS OWNED UNITS
Figure 1.15
2017
2012
150,000 100,000 50,000 0 0 50,000 100,000 150,000
16 to 24 25 to 34 35 to 44 45 to 54 55 to 64 65 and Over
Source: U.S. Census Bureau, American Community Survey Public Use Microdata Samples; Analysis by Beacon Economics
23State of the Workforce Report | 2019
The situation is most acute among young professionals ages 25 to 29, where the percentage share who
are living with parents or parents-in-laws jumped from 17% to 46% between 2012 and 2017. The share of
the workforce population ages 30 to 34 living with parents or parents-in-law has also spiked from 10% to
24% over that same time.
SHARE OF WORKFORCE POPULATION LIVING WITH PARENTS OR PARENT-IN-LAWS, BY
HOUSING TENURE
Figure 1.16
25%
20%
15%
10%
5%
0%
Total workforce Workforce population Workforce population
population in renter household in owner household
2012 2017
Source: U.S. Census Bureau, American Community Survey Public Use Microdata Samples; Analysis by Beacon Economics
SHARE OF WORKFORCE POPULATION LIVING WITH PARENTS OR PARENT-IN-LAWS, YOUNG
PROFESSIONALS
Figure 1.17
50%
40%
30%
20%
10%
0%
25 to 29 30 to 34 25 to 34
2012 2017
Source: U.S. Census Bureau, American Community Survey Public Use Microdata Samples; Analysis by Beacon Economics
24State of the Workforce Report | 2019
HEALTH INSURANCE COVERAGE
The percentage of working-age residents
without insurance (6% in 2017) was cut
in half between 2014 and 2015 and
has remained low since. The majority
of residents formerly without insurance
are now on public health insurance.
60% of working-age residents have only
private health insurance. However, with
the mandate repealed by the current
administration, Beacon Economics expects
the percentage of uninsured residents to
likely increase in the future.
HEALTH INSURANCE COVERAGE, RESIDENT POPULATION AGES 16 AND OLDER
SANTA CRUZ COUNTY
Figure 1.18
2017
2016
2015
2014
2013
2012
0% 10% 20% 30% 40% 50% 60% 70% 80% 90% 100%
Private + Public Health Insurance Private Health Insurance Public Health Insurance No Health Insurance
Source: U.S. Census Bureau, American Community Survey Public Use Microdata Samples; Analysis by Beacon Economics
25State of the Workforce Report | 2019
WAGE
RESIDENT POPULATION, WAGES
The median wage for County residents of working age (16+)
and at work (excluding those in armed forces) was around
$30,000 in 2017 and $45,000 for those ages 25 to 64 in
2017. Among residents of working age (16+) and at work and
those ages 25 to 64 and at work, the median wage earned
for the 75th percentile worker was $69,000 and $80,000
respectively in 2017.
The P75/median wage premium is important because it
provides information on wage distribution. A high P75/wage
premium means wages tend to be top-heavy, which may
represent a high wage ceiling. A low P75/median wage premium
means the median worker earns just slightly less than a worker
making the 75th percentile wage. On the flip side, an increasing
wage premium could imply greater wage disparity over time.
P75/MEDIAN WAGE PREMIUM - RESIDENTS WHO
WORK
Figure 1.19
240%
230%
220%
210%
200%
190%
180%
170%
160%
150%
2012 2013 2014 2015 2016 2017
Ages 25 - 64, Civilian Employed Age 16+, Civilian Employed
Source: U.S. Census Bureau, American Community Survey Public Use
Microdata Samples; Analysis by Beacon Economics
26State of the Workforce Report | 2019
Over time, the wage premium of the 75th Among residents age 25 and above who work, the
percentile worker over the median earner narrowed average (both mean and median) wages of those who
from 194% in 2012 to 178% in 2017 among work in the Bay Area are at least double the average
residents ages 25 to 64 and employed. However, wages of those who work in Santa Cruz County. This
the opposite is true among all residents who is important to remember when considering talent
worked; the premium widened from 208% to 230%. attraction and retention strategies.
This is mostly driven by the higher wage differences
among those ages 65 and above.
COUNTY RESIDENTS AGE 25 AND OLDER WHO WORK IN... MEDIAN VS. MEAN WAGE
Figure 1.20
MEDIAN WAGE MEAN WAGE
$120,000
$100,000
$80,000
$60,000
$40,000
$20,000
$0
2012 2017 2012 2017
Santa Cruz County Bay Area Santa Cruz County Bay Area
Source: U.S. Census Bureau, American Community Survey Public Use Microdata Samples; Analysis by Beacon Economics
27State of the Workforce Report | 2019
28State of the Workforce Report | 2019
KEY INDICATORS OF LABOR FORCE PARTICIPATION
WORKFORCE HEALTH OF RESIDENT POPULATION
Are you employing your prime working age
populations? Are your younger workers
Based on this analysis,
completing degrees?
Beacon Economics selected
four key indicators to AGING OF RESIDENT POPULATION
gauge and describe the Is your population replenishing the
workforce? Is there balance between
County’s workforce health.
older, retiring populations and young
These indicators were working populations?
chosen based on economic,
demographic, and COMMUTING PATTERNS
Are regional workers traveling to work
geographic characteristics
in your economy? Are your residents
unique to Santa Cruz traveling outside for opportunity?
County. Those four
indicators and associated COST OF LIVING
Is the local economy providing enough
questions are:
housing for your workforce? Are costs to
households significantly outpacing wages?
29State of the Workforce Report | 2019
LABOR FORCE PARTICIPATION OF RESIDENT POPULATION
The labor force participation rate (LFPR) among LFPR has also declined for all educational
County residents age 16 and above was 64% in attainment groups, except high school graduates.
2017, down 3% from 2012. County residents with a graduate or professional
degree recorded the largest decline (-8%) from
Except for County residents ages 16 to 24 and 55 2012 to 2017.
to 59, LFPR is lower in 2017 than it was in 2012
for all other age groups.
LABOR FORCE PARTICIPATION RATE BY AGE
Figure 1.21
100%
90%
80%
70%
60%
50%
40%
30%
20%
10%
0%
16 to 24 25 to 29 30 to 34 35 to 39 40 to 44 45 to 49 50 to 54 55 to 59 60 to 64 65 and Total
Over
2012 (67%) 2017 (64%)
Source: U.S. Census Bureau, American Community Survey Public Use Microdata Samples; Analysis by Beacon Economics
LABOR FORCE PARTICIPATION RATE BY EDUCATIONAL ATTAINMENT
Figure 1.22
85%
80% 80%
75% 77% 73%
70% 72%
67%
65% 65% 64%
59% 62%
60% 60%
58%
55% 54%
50%
2012 (67%) 2017 (64%)
Less Than High School High School Graduate Some College Bachelors Degree Grad./Prof. Degree Total
Source: U.S. Census Bureau, American Community Survey Public Use Microdata Samples; Analysis by Beacon EconomicsState of the Workforce Report | 2019
AGING OF RESIDENT POPULATION
Santa Cruz County is undergoing rapid population aging. From 2012 to 2017, the share of the resident
population age 65 and over was the fastest growing age group – a remarkable 35% increase. On the
other hand, with the exception of the 25 to 34 years old age group, there was a decline in every other
age group: Ages 16 to 24 (-2%), 35 to 44 (-3%), 45 to 54 (-6%), and 55 to 64 (-1.7%). In other words,
excluding the retiree age group, the County actually experienced a 1% decline among its working-age
resident population instead of the 4% increase noted earlier for the total resident population.
POPULATION CHANGE BY AGE GROUP, 2012 TO 2017
Figure 1.23
50%
40%
30%
20%
10%
0%
-10%
-20%
16 to 24 25 to 34 35 to 44 45 to 54 55 to 64 65 and Over
County Inland Coastal
Source: U.S. Census Bureau, American Community Survey Public Use Microdata Samples; Analysis by Beacon Economics
31State of the Workforce Report | 2019
Given the significant rise in seniors in the County, it follows that the retiree-to-worker ratio (elderly
dependency ratio) has also rapidly increased12 from 16.7 in 2012 to 21.6 in 2017. The rapid increase
in the retiree population in Santa Cruz County means that the County has now surpassed the following
counties with its higher elderly dependency ratio: Alameda County, San Francisco County, Santa Clara
County, and Monterey County. The County’s elderly dependency ratio has also surpassed California’s.
RETIREES TO WORKING AGE POPULATION RATIO
Figure 1.24
30%
25%
20%
15%
10%
5%
0%
California Alameda Contra San San Santa Monterey San Luis Santa
Costa Francisco Mateo Clara Obispo Barbara
Bay Area Peers Central Coast Peers
2012 2017 Santa Cruz (2012) Santa Cruz (2017)
Source: U.S. Census Bureau, American Community Survey Public Use Microdata Samples; Analysis by Beacon Economics
12
A measure derived by dividing the population 65 years and over by the 18 to 64 years population and multiplying by 100.
32State of the Workforce Report | 2019
The ratio of the resident
population over 65 to the
resident working-age population
tends to be the highest among
coastal and sparsely populated
areas and lowest in the County’s
two largest cities – Santa Cruz
and Watsonville.
ELDERLY DEPENDENCY RATIO IN SANTA CRUZ COUNTY BY CENSUS TRACT
Figure 1.25
ELDERLY DEPENDENCY RATIO
0.0 - 15.0
15.0 - 25.0
25.0 - 30.0
30.0 - 35.0
35.0 - 47.8
Source: U.S. Census Bureau, American Community Survey 5-Year Estimates; Analysis by Beacon Economics
33State of the Workforce Report | 2019
34State of the Workforce Report | 2019
COMMUTING PATTERN
RESIDENT POPULATION, COMMUTING PATTERN
The percentage of working residents who commute outside of the County for work has hovered consistently
between 20% to 25% from 2012 to 2017.
Slightly over 3 out of 4 Santa Cruz County residents also work in Santa Cruz County. 1 out of 6 commute
northward to the Bay Area, with Santa Clara County being the most popular Bay Area destination (14%). 1
out of 20 commute southbound to Monterey County, where wages are lower than Santa Cruz County. In
other words, more residents commute north to the Bay Area for work than south to Monterey County by a
ratio of 3.7 to 1.
COMMUTE DESTINATION OF RESIDENT WORKERS, SANTA CRUZ COUNTY POPULATION
AGES 16 AND OLDER, 2017
Figure 1.26
Monterey County, 5%
Other Destinations, 1%
Alameda County, 1%
San Francisco County, 0.4%
San Mateo County, 2%
Santa Cruz County, Bay Area, 17%
77%
Santa Clara County, 14%
Source: U.S. Census Bureau, American Community Survey Public Use Microdata Samples; Analysis by Beacon Economics
35State of the Workforce Report | 2019
RESIDENT POPULATION, COMMUTING PATTERNS BY AGE
With regard to commute patterns by age, the share of residents ages 45 to 64 (22%) are more likely to
commute to the Bay Area for work than residents ages 25 to 44 (14%) but are equally likely to work in
Monterey County (5%).
COMMUTING PATTERNS OF WORKING RESIDENTS AGES 25 TO 44, 2017
Figure 1.27
Monterey County, 5%
Other in CA, 1%
East Bay, 1%
San Francisco County, 1%
San Mateo County, 2%
Santa Cruz Bay Area,
County, 81% 14%
Santa Clara County, 10%
Source: U.S. Census Bureau, American Community Survey Public Use Microdata Samples; Analysis by Beacon Economics
COMMUTING PATTERNS OF WORKING RESIDENTS AGES 45 TO 64, 2017
Figure 1.28
Monterey East Bay, 0.4%
County, 5% San Francisco County, 0.3%
San Mateo County, 3%
Bay Area, 22%
Santa Clara County, 18%
Santa Cruz
County, 73%
Source: U.S. Census Bureau, American Community Survey Public Use Microdata Samples; Analysis by Beacon Economics
36State of the Workforce Report | 2019
RESIDENT POPULATION, COMMUTING PATTERNS BY EDUCATIONAL ATTAINMENT
Santa Cruz County residents with at least a bachelor’s degree are about twice as likely to be working in the
Bay Area compared to those with just a high school diploma.
WHERE ARE RESIDENTS AGE 16 AND ABOVE COMMUTING TO WORK? BY EDUCATIONAL
ATTAINMENT
Figure 1.29
100%
1%
2%
3% 4% 4%
6%
9%
90% 15%
17% 19%
80%
87%
80%
70% 77%
74%
72%
60%
Less Than High School Some Bachelors Grad./Prof.
High School Graduate College Degree Degree
Santa Cruz County Monterey County Other Santa Clara County Other Bay Area
Source: U.S. Census Bureau, American Community Survey Public Use Microdata Samples; Analysis by Beacon Economics
37State of the Workforce Report | 2019
RESIDENT POPULATION, WORKFORCE POPULATION, COMMUTING PATTERNS
COMMUTING PATTERNS Unlike the commuting trends at play among the resident population – a
BY OCCUPATION larger share of which commute north to the Bay Area (17%) than south
Occupations that are high to Monterey County (5%) -- the opposite dynamics are at play among
paying and often require at the workforce population. Just 5% of the workforce population hails
least a bachelor’s degree - from the Bay Area, compared to 9% from Monterey County. To clarify,
Architecture/Engineering commuting patterns for the resident population reflect where Santa
(39%), Computer/Mathematics Cruz County residents are commuting to for work; wheras communting
(32%), and Management (22%) patterns for the workforce population reflect from where Santa Cruz
occupations - see the highest County workers are communting to work in the County. Fewer Santa
share of residents working in Cruz County workers commute from the Bay Area than from Monterey
the Bay Area. County by a ratio of 0.57 to 1.
COMMUTE ORIGINS OF WORKFORCE POPULATION, SANTA CRUZ COUNTY POPULATION
AGES 16 AND OLDER, 2017
Figure 1.30
Other Destinations, 1%
East Bay, 1%
San Francisco County, 0.4%
San Mateo County, 0.3%
Monterey County, 9%
Santa Cruz County,
85% Bay Area, 5%
Santa Clara County, 4%
Source: U.S. Census Bureau, American Community Survey Public Use Microdata Samples; Analysis by Beacon Economics
38State of the Workforce Report | 2019
WORKFORCE POPULATION, COMMUTING here with regard to the workforce population’s
PATTERNS BY EDUCATIONAL ATTAINMENT commuting pattern as it pertains to educational
Unlike residents’ commuting pattern, where a higher attainment the relationship is not as clear. There
share of highly educated residents commute outside is little to no evidence of the County successfully
the County for work, specifically northbound to the attracting higher educated workers living outside of
Bay Area, than the share of less educated residents, the County to work in the County.
WHERE ARE WORKERS AGE 16 AND ABOVE COMMUTING FROM? BY EDUCATIONAL
ATTAINMENT
Figure 1.31
100% 1% 1%
2% 1%
1% 3%
3%
4% 5%
95% 3%
90% 9% 3%
15%
9% 8%
85%
80%
75%
86% 89%
84% 84%
82%
70%
65%
60%
Less Than High School Some Bachelors Grad./Prof.
High School Graduate College Degree Degree
Santa Cruz County Monterey County Other Santa Clara County Other Bay Area
Source: U.S. Census Bureau, American Community Survey Public Use Microdata Samples; Analysis by Beacon Economics
39State of the Workforce Report | 2019
COST OF LIVING
Across all income levels, a higher percentage of For County residents earning between $50,000
residents rent in the Coastal Area than in the Inland and $99,999, those living in coastal areas are twice
Area. This is not surprising given how much higher as likely to rent than their similarly earning inland
home prices are in coastal areas. peers (50% vs. 25%). The odds increase to three
times among those earning six figures (25% vs. 8%).
PERCENT RENTING BY WAGE LEVELS
Figure 1.30
60%
40%
20%
0%
Under $20,000 $20,000 to $49,999 $50,000 to $99,999 $100,000+
Santa Cruz County Inland: Watsonville & Scotts Valley Cities Coastal: Santa Cruz City
Source: U.S. Census Bureau, American Community Survey Public Use Microdata Samples; Analysis by Beacon Economics
40State of the Workforce Report | 2019
ECONOMIC
FORECAST
FORECAST ANALYSIS
Beacon Economics’ forecast methodology relies on statewide and
national drivers as well as historical trends for employment across
industries to project a reliable and robust output model. For the
industries in Santa Cruz County, the forecasts in part depended
on the historical trend, the employment levels, and the estimated
employment growth for industries across California.
Beacon Economics expects the County of Santa Cruz to reach roughly 109,430
employees by 2022. The three-year projected growth rate is 5.3% - or an
additional 5,530 workers over that time horizon. Government, Education/
Health, and Trade/Transport/Utilities sectors are expected to remain the
dominant industries in the County in terms of industry size and employment
footprint, with the total number of workers across the three industries
expected to reach over 61,000 employees.
41State of the Workforce Report | 2019
TOTAL EMPLOYMENT FORECAST, SANTA CRUZ COUNTY, 2013 TO 2022
Figure 2.1
115.0
110.0
105.0
Employment (Thousands)
100.0
95.0
90.0
85.0
80.0
2013 2014 2015 2016 2017 2018 2019 2020 2021 2022
Actual Forecast
Source: California Employment Development Department; Analysis by Beacon Economics
EMPLOYMENT BY INDUSTRY: 5-YEAR % GROWTH AND PROJECTED GROWTH
Table 2.1
Q1-2019 Q1-2022 Projected 5-Year % Growth 3-Year Projected
Industry Employment Employment (2014 – 2019) % Growth
Total Nonfarm 103,900 109,430 10.0% 5.3%
Government 22,360 24,260 6.6% 8.5%
Education/Health 17,900 19,670 6.8% 9.9%
Trade/Transport/Util. 17,000 17,480 3.5% 2.8%
Leisure & Hospitality 14,700 14,880 14.8% 1.2%
Professional/Business 10,500 10,610 10.9% 1.0%
Manufacturing 7,400 7,790 22.4% 5.3%
Other Services 5,340 5,440 24.6% 1.9%
Natural Resources/Construction 4,500 4,940 32.9% 9.8%
Financial Activities 3,540 3,740 2.6% 1.5%
Information 600 620 -25.1% 4.0%
Source: California Employment Development Department; Analysis by Beacon Economics
42State of the Workforce Report | 2019
Figure 2.2 shows the projected forecast for the top five employing industries in the County of Santa Cruz. Of
the five industries, the most significant growth is expected to be observed in Government and Education/
Health industries. Trade/Transport/Utilities, Leisure & Hospitality, and Professional/Business sectors are
expected to grow modestly, but not within the range of growth observed for those sectors historically,
between 2014 and 2019.
Natural Resources/Construction is expected Natural Resources/Construction, Manufacturing,
to continue to dominate the County’s fastest and Government are expected to demonstrate the
growing industries through 2022, with a three-year most significant growth among the highest paying
projected forecast of 9.7%, the second highest industries between 2019 and 2022, as a result
forecasted growth rate after Education/Health of both heightened demand and recent trends in
(9.9%). Manufacturing is projected to be the the market. Professional/Business and Finance
County’s third fastest growing industry by 2022, & Insurance are expected to grow modestly, but
with a three-year projected growth rate of 5.3%. the three-year projected growth rates for those
Transport/Warehouse/Utilities, Other Services, industries are lower than that of the County
and Leisure & Hospitality are expected to grow economy’s overall average.
modestly, with slower growth anticipated due to a
tightening labor market.
EMPLOYMENT FOR LARGEST INDUSTRIES, SANTA CRUZ COUNTY, 2013 TO 2022
Figure 2.2
125
120
Employment (Index at 100)
115
110
105
100
95
2013 2014 2015 2016 2017 2018 2019 2020 2021 2022
Government Education/Health Trade/Transport/Utilities Leisure & Hospitality Professional/Business
Source: California Employment Development Department; Analysis by Beacon Economics
43State of the Workforce Report | 2019
EMPLOYMENT FOR FASTEST GROWING INDUSTRIES, SANTA CRUZ COUNTY, 2013 TO 2022
Figure 2.3
175
Employment (Index at 100)
155
135
115
95
2013 2014 2015 2016 2017 2018 2019 2020 2021 2022
Construction Transportation/Warehouse/Utilities Other Services Manufacturing Leisure & Hospitality
Source: California Employment Development Department; Analysis by Beacon Economics
EMPLOYMENT FOR HIGHEST PAYING INDUSTRIES, SANTA CRUZ COUNTY, 2013 TO 2022
Figure 2.4
165
155
Employment (Index at 100)
145
135
125
115
105
95
2013 2014 2015 2016 2017 2018 2019 2020 2021 2022
Construction Manufacturing Finance and Insurance Professional/Business Government
Source: California Employment Development Department; Analysis by Beacon Economics
44State of the Workforce Report | 2019
REGIONAL
ANALYSIS
GEOGRAPHICAL ANALYSIS
Santa Cruz County has experienced notable changes in the number
of establishments, specifically with regards to locations across the
region. Between 2011 and 2016, North Santa Cruz County increased
by 300 establishments to reach a total of 5,640. Meanwhile, South
Santa Cruz County had in 2016 a total of 1,580 establishments,
reflecting an increase of 86 businesses since 2011.
In terms of employment growth, Northern Santa Cruz County has seen larger
increases between 2011 and 2016 than its Southern counterpart. Over the
five-year period, the Northern subregion of Santa Cruz County has seen
employment expand by 16.3%, while the Southern subregion has grown by
only 8.0%. Total employment in North Santa Cruz County reached roughly
59,600 workers in 2016 – while South Santa Cruz County employment stood
at approximately 12,240 employees.
45State of the Workforce Report | 2019
SANTA CRUZ COUNTY REGIONAL DEFINITIONS BY ZIP CODE
Table 3.1
Region Zip Code
South Santa Cruz County 95019, 95076, 95077
95001, 95003, 95005, 95006, 95007, 95010, 95017, 95018,
North Santa Cruz County 95033, 95041, 95060, 95061, 95062, 95063, 95064, 95065,
95066, 95067, 95073
Source: California Employment Development Department; Analysis by Beacon Economics
The two largest employing industries in order of employment footprint were Trade/Transport/Utilities and
Education/Health for both regions. However, the Trade/Transport/Utilities industry has seen an 11.4%
growth in employment between 2011 and 2016 in the North, while the industry in the Southern part of
the County has dropped 4.1% in terms of employment within the same time period. Furthermore, Natural
Resources/Construction and Leisure & Hospitality were the fastest growing industries for both North and
South Santa Cruz County.
EMPLOYMENT GROWTH
Figure 3.1
120
115
110
105
100
95
90
2011 2012 2013 2014 2015 2016
North South
Source: County Business Patterns; Analysis by Beacon Economics
46State of the Workforce Report | 2019
REGIONAL
COMPARISONS
Santa Cruz County falls just When compared to the San Jose MSA13, Santa Cruz County’s
growth falls short over the past few years. However, when
south of the Bay Area, and is
compared to an economy more sufficiently similar to the
directly surrounded by the Santa Cruz County economy in terms of industry and worker
San Jose MSA (Santa Clara composition, such as Solano County, the levels of growth seen
in the County fare much better.
and San Benito counties)
to the east. The Bay Area Between the fourth quarter of 2014 and the fourth quarter
has seen tremendous of 2019, total nonfarm employment in the San Jose MSA
and Solano County grew respectively by 14.9% and 11.4%,
growth in several areas
outpacing Santa Cruz County’s nonfarm employment growth
of the economy, most rate of 10.0%. In terms of year-over-year employment growth,
notably within the Tech and the San Jose MSA grew by 2.3% between the first quarter of
2018 and the first quarter of 2019, while Solano County total
Professional sectors.
nonfarm had not changed. Santa Cruz County’s year-over-
year nonfarm employment increased by 1.1%. Solano County
and Santa Cruz County’s total nonfarm employment levels are
relatively similar at 140,700 and 104,000 respectively, while
the San Jose MSA, which includes Santa Clara and San Benito
counties, has 1.14 million workers.
13
Metropolitan Statistical Area
47State of the Workforce Report | 2019
TOTAL NONFARM EMPLOYMENT
Figure 3.2
116
114
112
110
108
106
104
102
100
98
2013 2014 2015 2016 2017 2018 2019 2020 2021 2022
San Jose Santa Cruz Solano
Source: California Employment Development Department; Analysis by Beacon Economics
Santa Cruz County’s top employing industries Services, with a growth rate of 60.7% between the
align with those of Solano County, with the Trade/ first quarter of 2014 and the first quarter of 2019.
Transport/Utilities sector, the Education/Health The fastest growing industry in Solano County
sector, and Government all filing to the top of both was Transport/Warehouse/Utilities, with a five-
counties’ largest industries in terms of employment. year growth rate of 43.9%, outpacing Santa Cruz
Compared to the San Jose MSA however, the County’s growth in the industry (27.7%) over that
industry mix of Santa Cruz County is significantly same time period.
different. Professional/Business, Manufacturing, and
Education/Health ranked among the top three of the The three regions shared similarities with regard
largest employing industries of the San Jose MSA. to their highest paying industries, with Finance
& Insurance as well as Manufacturing appearing
With regards to the fastest growing sectors, all in the top three in all three geographies. The
three regions saw Natural Resources/Construction Manufacturing industry was Solano County’s
fall among the top three industries. Growth in highest paying industry at $90,780 which is higher
Natural Resources/Construction employment was than Santa Cruz County’s average wage of $68,180
most significant in Santa Cruz County between the for the sector. The San Jose MSA’s highest paying
first quarter of 2014 and the first quarter of 2019 at industry was Information with an average wage of
a rate of 32.9%, a rate above that of the industry’s $310,290, far above the average annual wage for
growth in Solano County (29.6%) and the San Jose the industry in Santa Cruz County ($56,740).
MSA (23.3%). The San Jose MSA’s fastest growing
industry on the other hand was Information
48State of the Workforce Report | 2019
INDUSTRY ANALYSIS &
TARGET INDUSTRIES
INDUSTRY ANALYSIS
The County of Santa Cruz has reached 103,900 workers as of the
first quarter of 2019. With a year-over-year growth rate of 2.3%, the
County saw about 1,200 new jobs added between the first quarter
of 2018 and the first quarter of 2019. Over a five-year period, Santa
Cruz County’s total nonfarm employment grew by 10%, with more
than 9,400 employees added to the workforce.
The County’s unemployment rate reached 5.2% as of the first quarter of 2019,
falling by more than 4 percentage points since 2014 and increasing by only 0.1
of a percentage point since 2018. The County’s labor force growth has been
lagged compared to labor force growth statewide and in neighboring regions;
the County’s five-year growth labor force growth rate was 1.7%, compared to
California’s five-year growth of 5.1%.
49You can also read