R 478 - The evolution of the occupational structure in Italy in the last decade by Gaetano Basso - Banca d'Italia
←
→
Page content transcription
If your browser does not render page correctly, please read the page content below
Questioni di Economia e Finanza
 (Occasional Papers)

 The evolution of the occupational structure in Italy
 in the last decade

 by Gaetano Basso
January 2019

 478
 Number
Questioni di Economia e Finanza
(Occasional Papers)

The evolution of the occupational structure in Italy
in the last decade

by Gaetano Basso

Number 478 – January 2019
The series Occasional Papers presents studies and documents on issues pertaining to
the institutional tasks of the Bank of Italy and the Eurosystem. The Occasional Papers appear
alongside the Working Papers series which are specifically aimed at providing original contributions
to economic research.

 The Occasional Papers include studies conducted within the Bank of Italy, sometimes
in cooperation with the Eurosystem or other institutions. The views expressed in the studies are those of
the authors and do not involve the responsibility of the institutions to which they belong.

 The series is available online at www.bancaditalia.it .

ISSN 1972-6627 (print)
ISSN 1972-6643 (online)

Printed by the Printing and Publishing Division of the Bank of Italy
THE EVOLUTION OF THE OCCUPATIONAL STRUCTURE IN ITALY
 IN THE LAST DECADE

 by Gaetano Basso*

 Abstract
 Many advanced economies have experienced significant job polarization in the last
decades, with an increase in the employment share and relative wage of both low-wage and
high-wage workers at the expense of middle-wage workers. This polarization has probably
been spurred by the substitution of routine-intensive labour with automation and information
and communication technologies. This note explores whether the Italian labour market has
experienced similar patterns and, if so, whether they are the consequence of a pure
technology-driven shock. The evidence is mixed. While the share of low-wage manual
occupations has increased markedly, that of high-wage professional occupations has fallen
slightly. The share of middle-wage jobs has declined significantly but, unlike the case of the
US, the wages have not. Regression analyses based on occupational task characteristics (Goos
et al., 2014) do not fully align with the routine-biased technical change hypothesis either,
consistently with the limited adoption of automation technology in Italy. Among the most
likely factors, cross-sector reallocation, which favoured the low value added service sector,
and the rise of low skilled migrant and college graduate labour supply explain most of the
observed occupational changes.

JEL Classification: J23, J24.
Keywords: labour demand, occupational choice.

 Contents

1. Introduction ........................................................................................................................... 5
2. Changes of the occupational structure in Italy over two decades: existing evidence............ 6
3. Data on occupations and tasks ............................................................................................... 7
4. Occupational employment and wage growth in Italy, 2007-2017 ...................................... 10
5. Conclusions ......................................................................................................................... 17
References ................................................................................................................................ 18
Figures and tables ..................................................................................................................... 20
Appendix: A comment on the structure of occupation in Italy ................................................ 33

_______________________________________
* Bank of Italy, Directorate General for Economics, Statistics and Research.
1. Introduction 1

The 2017 OECD Employment Outlook (OECD, 2017) analyzes the evolution of the occupational structure in
Europe in the period 1995-2015 and shows that the most industrialized economies’ labour market polarized.
The OECD observes an increase in the share of low-pay (e.g., manual services) and high-pay occupations
(e.g., managerial and professional positions), and a drop of middle-pay occupations as share of total
employment (figure 1). These latter tend to intensively perform tasks that “can be accomplished by following
explicit rules”, i.e., routine-intensive tasks (Autor et al., 2003), and usually employ middle-skilled workers
(e.g., white collar, secretarial, archival and cashier occupations). Automating and information and
communication technologies (ICT), which substitutes for routine-intensive labour and complement manual-
intensive (through demand) and analytical-intensive (through production complementarities), are considered
the main determinant of job polarization (Autor, Levy and Murnane, 2003; Autor, Katz and Kearney, 2006;
Autor and Dorn, 2013; Goos, Manning and Salomons, 2014; OECD, 2017). Such hypothesis goes under the
name of routine-biased technical change (RBTC). Alternative hypotheses hinge on the demand growth for
goods produced by industries which employ workers at the two extremes of the skill distribution (Comin,
Lashkari and Mestieri, 2018), and on secular declines of the manufacturing sector (Bárány and Siegel, 2018).

The OECD analysis leaves, however, many unanswered questions: do low- and high-end polarization occurs
simultaneously in the two decades analyzed as the RBTC hypothesis would suggest? Is polarization the
consequence of a pure demand shock or workers and industrial composition matter too? 2 And what is the
role of occupational classification, task indexes and wage-based rankings in shaping the results given the
differential technological adoption and institutional features (e.g., wage bargaining) across countries?

This note aims at answering these questions in the context of the Italian labour market and describes the most
recent evolution of its occupational structure. 3 The existing literature points to an upgrading of the Italian
occupational structure in the 1990s until the mid-2000s. The empirical evidence presented herein indicates
that the last ten years have been characterized by a strong growth in the share of low-skilled manual
occupations and a mild drop in the share of high-pay professional occupations. The share of middle-pay
occupational decreased sharply. Regression analyses based on occupational task characteristics, similar to
those run by Goos et al (2014), do not confirm that RBTC is the main driver of the Italian occupational
structure. Other factors such as changes in the composition of the workforce and the growth of low value
added services seem to have contributed significantly to the observed changes. Such channels are uncovered
by means of simple Oaxaca-Blinder decompositions. Finally, as ancillary result, I highlight how the

1
 Contact: gaetano.basso@bancaditalia.it. I thank Matteo Bugamelli, Federico Cingano, Francesco D’Amuri, Marta De
Philippis, Alfonso Rosolia, Paolo Sestito and Eliana Viviano for their comments. The views expressed in this paper are
those of the author and do not necessarily reflect those of the Bank of Italy.
2
 Three recent contributions (Basso, Peri and Rahman, 2017; Cerina, Moro and Rendall, 2017; Mandelman and Zlate,
2014) analyze how labour supply interacts with labour demand shocks in shaping job polarization in the US context.
3
 It must be noticed that the analysis is subject to the break in the classification of occupations in 2011 that cannot be
fully accounted for. See section 3.2 for a discussion of this issue.
 5
characteristics of the Italian occupations, especially their wages, are not fully comparable with those of their
European counterparts.

The note proceeds as follows. Section 2 summarizes the existing evidence on job polarization in Italy.
Section 3 describes the data used and the classification of occupations. Section 4 presents descriptive
evidence on the change of the Italian occupational structure in the last decade and discusses some possible
determinants. Section 5 concludes.

2. Changes of the occupational structure in Italy over two decades: existing evidence

As reported in figure 1, the OECD shows that the Italian labour market polarized as much as the OECD
average and in line with those of Germany and the US. This evidence confirms a recent analysis by Goos et
al. (2014). Goos and coauthors show that between 1993 and 2010 the decline in middle-pay occupational
share in Italy was large (−10.6 percentage points between 1993 and 2010). At the polar ends, the share of the
eight highest paying occupations increased by 4.5 percentage points, that of low-pay occupations by 6.1
percentage points. Overall, job polarization in Italy fostered the specialization of low-skilled service jobs
such as construction and transport labourers, personal service workers and other sales and service elementary
positions: it is worth noting that their employment share was already high in 1993, 27 percent versus an
European average of 21.6 (Goos et al., 2014).

A previous contribution by Goos et al. (2009) analyzes data until 2006. Interestingly, they find a shift
towards high-skilled occupations in Italy, rather than an increase of both low and high-skilled occupational
shares. This result is consistent with work by Olivieri (2012) and Olivieri and Nellas (2012) who show that
Italy experienced substantial occupational upgrading in the 1990s and 2000s. The share of hours worked in
high-qualification occupations, defined as occupations with the highest educational requirement rather than
the highest paying ones, increased while the share of hours in low-qualified positions dropped between 1993
and 2000 and slightly increased until the late 2000s (see figures 4.1 and 4.2 in Olivieri, 2012).

The existing evidence thus points to some interesting, but puzzling, facts. The Italian labour market polarized
in the last two decades, but the dynamics differs substantially if we look at the two sub-periods separately.
The occupations whose share increased the most before mid-2000s were highly qualified and paying higher
wages. Low skilled occupations grew only in the more recent period, thus not contemporaneously to highly
qualified occupations as the demand channel of the RBTC theory would suggest (Autor and Dorn, 2013).
The share of the middle-pay occupations, instead, declined substantially throughout the last twenty-five
years.

Given the conflicting results in terms of occupational evolution across decades, it is not clear whether
routine-biased technical change can be considered the only driver for such changes. Moreover, the lack of
evidence on occupational wage growth, which under a demand shock follows the same direction of the
 6
changes in occupational shares, cannot fully exclude the possibility that changes in supply also drive part of
the results. Rosolia (2010) and Olivieri (2012) are the only papers that look at the evolution of wages: they
observe a strong wage growth at the polar ends of the wage distribution between 1985 and 2004 using
administrative data from INPS. However, they cannot link such wage changes to employment changes at the
occupation level because of data limitations. 4

The rest of the note focuses on the last decade trying to study in depth the changes in the occupational
structure that occurred from just before the Great Recession until the most recent recovery possibly shedding
some light on the puzzle.

3. Data on occupations and tasks

3.1. The Italian labour force survey

I use ISTAT Labour Force Survey (LFS) microdata from 2007 to 2017. The universe of reference is the
workforce aged 15 to 64 in the non-agricultural private sector that I collapse into at occupation-industry-year
cells. I aggregate industries into five broad categories: manufacturing, energy and mining, construction, retail
and wholesale trade, accommodation and food services, other services. Such coarse aggregation is due to
structural breaks in the sectoral classification in 2011. For each cell I compute the number of employed
people, the share over total employment, as well as the average wage which is available from Istat only
starting in 2009. 5 In further analyses I also use information on workforce age (above and below 35), gender,
nativity status (natives and foreign born) and education (high school or less, some college or more).

3.2. Classifying occupations

In the absence of detailed technology adoption measures, the literature analyzes job polarization as the
changes in occupational employment shares leveraging on different occupational characteristics in order to
quantify the impact of routine task-substituting machines on labour demand.

The publicly availably LFS microdata classify 130 three-digit occupations which span the entire spectrum of
workers’ activities and can be aggregated into one or two-digit occupation groups. 6 The classification

4
 Rosolia (2010) estimates milder growth rates at the tails of the wage distribution than those estimated by Olivieri
(2012). The administrative data used by both works do not contain occupational codes: polarization is measured only
examining wage percentiles growth and not occupational average wage growth.
5
 Wages are reported in the LFS as gross monthly earnings from labour for employees only and are top-coded at 3,000
euros per month. I perform two adjustments: first, I impute hourly earnings for self-employed workers using a simple
linear prediction based on observable characteristics (age, foreign born status, education level, region, part-time status
as well as gender, marital status and number of children both separate and interacted). Second, I adjust top-coded
earnings by a factor 1.25 following Autor, Katz and Kearney (2009). Results, available upon request, are robust if I do
not impute wages to self-employed, if I do not adjust top-coded earnings or if I adjust them by a factor of 1.5.
6
 This is a more coarse classification than that adopted in the US: the Census, American Community Survey, and
Current Population Survey contain about 300 three-digit occupations based on the Standard Occupational
Classification, or its adaptations.
 7
adopted has a break in 2011. To overcome the limitations imposed by the change of classification, and to
match the Italian occupations to ILO’s ISCO classification-based indexes that describe their characteristics, I
follow a two-step matching procedure. First, I associate post-2011 LFS three-digit codes to pre-2011 three-
digit codes. Then, I similarly match the three-digit pre-2011 to two-digit ISCO-88 occupational codes. Such
adjustments do not create an error-free classification of occupations over time, but allow to reduce the breaks
in the series as shown in panel (a) and (b) of figure 2. 7

In the rest of the analysis I use different groupings of occupations. First, occupations can be ranked by their
mean wage following a canonical model of the labour market with three types of labour (low, middle and
high skilled) where workers of the same skill level are paid the same wage (Acemoglu and Autor, 2011;
Autor and Dorn, 2013). Such grouping can be done in two ways. Following the OECD (2017), I consider
one-digit occupation groups which I aggregate into three broad categories: low-pay occupations corresponds
to ISCO-88 groups 5 and 9 (i.e., service workers and shop and market sales workers, and elementary
occupations); middle-pay occupations include jobs classified under the ISCO-88 major groups 4, 7, and 8
(i.e., clerks, craft and related trades workers, and plant and machine operators and assemblers); finally, high-
pay occupations include jobs classified under groups 2, and 3 (i.e., managers, professionals, and technicians
and associate professionals). As agricultural, fishery, health and education industries and the public sector
were not included in the analysis, occupations in ISCO-88 groups 1 and 6 are likewise excluded.

Occupations can also be ranked in a more disaggregated way according to their mean wage. Given that the
Italian LFS data do not report wage information before 2009 I rank occupations based on their average wage
as measured in the Italian component of the 2006 Eurostat Structure of Earnings Survey, which collects
wages for a sample of workers and records their two-digit ISCO-88 occupation code. 8 Column (a) and (b) of
Table 1 report the wage-based rankings of occupations I use in the paper.

A second approach is that of using off-the-shelves indexes of occupational task characteristics, i.e., routine,
manual or analytical task intensity, which aim at capturing the degree of substitutability between labour and
technology in performing an activity. For instance, occupations such as office clerks and unskilled
production jobs are more likely to be substituted by computers, industrial robots and other automating
machines and have higher routine intensity indexes than high skilled managers and scientists, whose
activities are instead complementary to such technologies. Services occupations that entail manual and
communication activities (e.g., personal services, food preparers, etc.) are also complementary to routine
substituting technology through aggregate demand. Autor et al. (2006) and Autor and Dorn (2013) – AD
2013 hereinafter – created a summary index of occupational relative routine intensity (RTI) based on the
description of the US occupations in the 1977 Dictionary of Occupational Titles, (DOT; Bureau of Labour

7
 The matching procedure use as weights the 2011 employment of each CP2011 occupation divided by all potential
employment if one were using CP2001 codes.
8
 Similarly, Goos et al. (2014) rank occupations based on external wage data sources (i.e., panel household survey like
the ECHP and the EU-Silc which contains two-digits occupation codes) since the EU LFS do not report wage
information at all.
 8
Statistics, 1977; Autor et al., 2003). 9 For each occupation, the index measures the relative use of routine
intensive tasks, relative to manual and analytical. This index was adapted to the European occupational
classification by Goos and Manning, (2007) and Goos et al. (2009) aggregating occupations to twenty two-
digits groups.

Goos et al. (2009) – GMS 2009 hereinafter – also construct the single components of the RTI, i.e., an
abstract-, routine- and manual-intensive indexes, allocating the main occupational tasks (from O*NET) into
three principal components averaging them at the two-digits ISCO level weighted by their US employment
in 2005, and rescaled to be interpreted in terms of standard deviation.

Finally, Peri and Sparber (2009) constructed five indexes capturing the relative use of manual, analytical,
routine, complex and communication tasks in each US occupation using the 2003 O*Net database. 10
D’Amuri and Peri (2014) – DP 2014 hereinafter – adapted Peri and Sparber indexes for the European data.
Unfortunately, there is no other direct way of classifying occupational task content in Europe. 11

Table 1 also summarizes task-based indexes for the two-digits private sector occupations ranked accordingly
to the OECD highest to lowest-paying criterion of columns (a). All the indexes are highly correlated among
each other and with the wage ranking: not surprisingly occupations that are usually performed by high-
skilled individuals are better paid and entails less routine and manual tasks and more analytical and complex
tasks.

Summing up, these classifications have several pros and cons. On the one hand, (i) looking at occupations is
a natural way to study the evolution of labour demand, especially because polarization has been observed
both within and across industries; (ii) consistent occupational definitions can be mapped into a wage ranking
and into routine/manual/analytical-intensive indexes. On the other hand, (i) the differences in the average
wages of occupations in Italy with respect to other countries may reflect endogenous evolution of labour
demand and of technology adoption (further discussed in the Appendix), (ii) the unavailability of wage data
in the LFSs poses challenges in constructing coherent rakings of occupations in Italy and in the rest of
Europe; (iii) the task-intensity indexes likely suffer of measurement error because of the ad-hoc adjustments

9
 The DOT recorded objective and subjective dimensions of occupational requirements for each six-digit occupation
and classified them in 44 variables. The RTI is constructed as the difference in the logarithms of routine cognitive and
routine manual minus the logarithms of non-routine analytic, non-routine interactive, and non-routine manual scores.
Each of these indexes is based on the percentiles values corresponding to their rank in the task intensity distribution
(Autor et al., 2003; Autor, Katz and Kearney, 2009 and Autor and Dorn, 2013).
10
 O*NET is the most recent equivalent to DOT. Peri and Sparber’s (2009) measures are interpretable as percentiles, i.e.
each occupation is associated with more than one index that characterizes its content of manual and communication
tasks relative the use in other occupations. Acemoglu and Autor (2011) also use O*NET to construct task intensity
indexes, but their version has only an ordinal interpretation. Acemoglu and Autor (2011) and Autor and Dorn (2013)
also use occupational groups rather than task indexes given the arbitrary judgment involved in classifying occupations
by aggregating the numerous variables contained in O*NET and DOT.
11
 The only exception is the OECD Programme for the International Assessment of Adult Competencies (PIAAC) that
allows to construct task-based index of occupational content for each OECD country (see Arntz et al., 2017, for a recent
application). However, PIAAC it has been released very recently and classifying occupations based on recent task
specialization may cause endogeneity problems as the task content of occupations evolve exactly because of
technological advancements.
 9
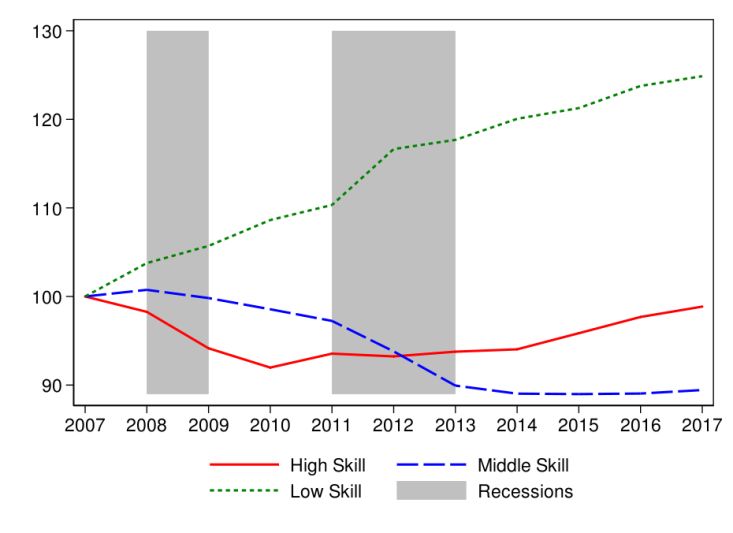
and judgment calls made when adapting them to the European occupational classification; (iv) the O*NET
measures are defined as of late 1990s/early 2000s, and thus reflect characteristics of occupations that are
evolving exactly because of the adoption of technology; (v) the indexes are constructed directly on the
description of US occupations and reflect the characteristics of US jobs and may misrepresent the
characteristics of European occupations.

4. Occupational employment and wage growth in Italy, 2007-2017

4.1. Descriptive evidence

Figure 2 describes the changes of occupational employment shares (panel (a)) and of employment growth
(panel (c)) in the last decade for three broad occupation groups, low-, middle- and high-paying as defined by
the OECD. The growth of low-paying occupations and the decline of middle-paying occupations,
respectively, determined a downgrading of the Italian occupational structure as the share of high-paying jobs
remained substantially stable.12 Focusing on the two recent recessionary periods, which are indicated in
figure 2 by shaded areas, we see that high-paying occupations suffered the most during the Great Recession
as their employment share dropped by 2.2 percentage points between 2007 and 2010 (Brandolini et al., 2018,
discuss in more details the variation of income across the distribution during the two recent recessions and
the 1992 currency crisis). In the second part of the double dip recession, the share of middle-skill jobs
decreased sharply (-3.4 percentage points between 2010 and 2013). During the recent recovery, instead, we
observe employment growth in low and high-pay occupations.

Figure 3 extends the analysis by breaking down the 2007-2017 employment share change (green bars) along
the distribution of occupations ranked by their 2006 average. The graph confirms qualitatively the
downgrading of the Italian occupational structure (also depicted here by a quadratic fit in figure 4(a)), but it
also shows that there is heterogeneity within broad occupational groups. The growth at the low-end is largely
concentrated in the lowest decile (+4.6 percentage points), while the fourth decile, about in the middle of the
distribution, experienced the largest drop (-4.3 percentage points). Among high paying occupations there are
not significant changes in the occupational employment shares.

The existing literature shows that labour market polarization is also associated with polarized wage growth,
as demand factors determine co-movements of quantities and prices (Autor and Dorn, 2013). Figure 3 also
shows the average occupational hourly wage yearly growth from 2009 to 2017 (orange bars). Wage growth
has been heterogeneous across occupations and the overall pattern is not consistent with a demand-driven
shock. If anything, middle-pay occupations experienced slightly higher growth, while occupations at the
lowest end of the wage distribution and in the middle to top part experienced a slightly milder growth.

12
 The results are robust when measuring employment on hours worked rather than on person counts.
 10
To better qualify these changes, I replicate the analysis on US Census ACS data for the period 2007-2015.
The US experienced a polarization of the labour market that is reflected both in employment shares and wage
growth. Figure 4 compares the shapes of the occupational change and wage growth in Italy and in the US
fitting quadratic polynomials. The polarization of the US labour market in the last decade is similar to that
observed for the period 1980-2010 by Autor and Dorn (2013) and, differently from Italy, is coherent with a
shift of the labour demand curve such that posed by the RBTC hypothesis.

4.2. Regression-based evidence on routine biased technical change

The descriptive analysis suggests that the Italian labour market underwent a downgrading of the occupational
structure in the last decade. Such evidence does not seem to square with the hypothesis that the routine-
biased technical change is the main responsible for such transformation.

A slightly more formal test of the routine-substituting role of technology is provided by the following
regressions. Following Goos et al. (2014), I relate the log of occupational employment, occupational
employment shares and the log of real hourly wages to the indexes of occupational characteristics
( ) presented in section 3.2. Similarly to Goos et al., I add in different specifications industry-
by-occupation fixed effects, which control for differences in occupations across industries, and year-by-
industry fixed effects, which capture aggregate and industry-specific demand shocks. The underlying
framework, which disciplines task demand in each industry, models RBTC as a change in the price of inputs
other than domestic labour over time, and is included in the regression analysis as an interaction between
occupation indexes and a linear time trend. Differently from Goos et al. (2014) and most of the literature, I
test whether the results are consistent across different sets of indexes: the variable represents in
each regression either the RTI summary index of Autor et al. (2003), the abstract, routine and manual
indexes derived from O*NET by Goos et al. (2009), or the five-fold occupational characteristics of D’Amuri
and Peri (2014). The main regression equations are:

 log , , = ∗ + + + (1)

 ℎ , , = ∗ + + + (2)

 log , , = ∗ + + + (3)

where are occupation-industry dummies, are year-industry dummies and are normally distributed
zero mean errors. Standard errors are clustered at the occupation-industry level.

Table 2 reports the results of equation 1. The RTI index (measured in standard deviations and divided by
100) predicts no systematic changes in employment as a function of the relative routine intensity of the
occupation-industry cell regardless whether I control for aggregate or industry-specific time effects (columns
1 and 4, respectively). Just based on these regression, we could conclude that either be that RBTC is not the

 11
main driver of observed labour market polarization, or that the RTI index is too coarse of a measure to
capture structural changes in occupational employment. 13

Columns 2 and 5 break down the RTI index into the three components (also measured in standard deviations
and divided by 100) controlling for aggregate or industry-specific time effects, respectively. The estimated
coefficients, which are never statistically significant, suggestively indicate a shift towards manual-intensive
jobs away from routine-intensive jobs. The demand for analytical-intensive occupation is instead declining
over time: a one standard deviation increase in the abstract task index is associated with a -.58 to -.76
percentage points slower growth in employment each year.

Controlling for the even more disaggregated O*NET-based indexes (D’Amuri and Peri, 2014), measured in
percentiles divided by 1000, we observe somewhat more robust patterns across specifications that confirm
the overall results of the other analyses. Employment in occupations with high content of manual tasks (i.e.,
low-skilled services) grew significantly – ten percentage points increase in the manual index is associated
with around 1 percentage point faster growth in employment each year – while it dropped in occupations
with a high level of routine task intensity indexes (-1.54 to -1.92 percentage slower growth for ten percentage
point higher routine index).

Table 3 replicates the structure of table 2, but looks at employment shares. Again the RTI index does not
predict systematically changes in employment shares. Consistent with the evidence presented so far, the
share of jobs performing routine intensive tasks declined in Italy according to the disaggregated indexes
developed by Goos et al. (2009) and D’Amuri and Peri (2014): in columns 3 and 6 we observe an average
annual drop of about 4.5 to 6.5 percentage points for a ten percentage points higher level of the routine
intensive index. The evidence on analytical and complex tasks is conflicting as the former points to a
statistically significant decline and the latter to a statistically significant increase in the shares of occupations
with higher values of these task indexes.

Finally, Table 4 provides complementary evidence on wages. I use the log of the average wage in the
occupation-industry cell as dependent variable as described in equation 3. The results are in line with the
qualitative evidence provided in figure 4. All disaggregated indexes point to the same direction (columns 2,
3, 5 and 6): wages decreased in low-paying manual and communication-intensive services, and increased at
the very top end, in occupation that perform analytical intensive tasks. The effects are however very small,
and often not statistically significant at conventional levels once controlling for sector-time fixed effects. The
limited evidence on differential wage growth by occupation is also coherent with a high degree of centralized
bargaining associated to a compressed wage structure.

13
 Brunetti et al. (2018) perform a complementary analysis at the provincial level using Autor and Dorn (2013) routine
intensity measure. They document that employment declined more between 2004 and 2014 in provinces with a larger
starting share of routine workers.
 12
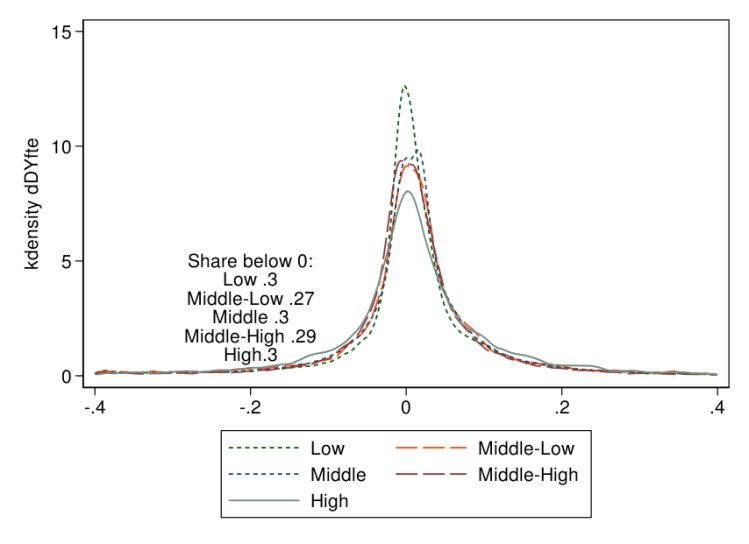
From the analyses presented in this section we can derive two methodological and one factual conclusions.
First, one-catch-all indexes of occupational characteristics, such as Autor and Dorn’s (2013) RTI index, are
poorly suited to capture changes in the occupational structure that are not coherent with routine-biased
technical change. Second, it is important to test for changes in occupational wages as they are a first
indication of whether the dominant force is one of labour demand as it should be in the case technology
advancements. Finally, both the descriptive and the regression analyses seem not to support a polarization of
the Italian labour market: the Italian occupational structure in the last decade experienced a decline in
middle-skill employment, but only in favor of low-skill service jobs. Such conclusion is consistent with
empirical evidence on limited adoption by Italian firms of various types of automating technologies, such as
industrial robots that could substitute for unskilled production workers (Banca d'Italia, 2018) or other ICT
practices that would be complemented by high-skill workers (Schivardi and Schmitz, 2018). Yet, we have to
bear in mind that possibly misclassification of occupations could have generated some measurement error in
the analyses.

4.3. A role for downward wage rigidities?

The limited observed changes in occupational wages suggest that the centralized wage bargaining system,
which is associated with strong downward wage rigidities, plays a major role in Italy: this possibly limits the
role of prices as a signal of demand shifts in the labor market. To further investigate the nature of the wage
changes and to better understand whether they can actually signal changes in labour demand, I move to
administrative data obtained from the Italian social security administration (INPS) databases, of which we
observe a randomly sampled panel of workers corresponding to about 6.6 percent of the private sector
workforce. These data are better suited to assess the role of wage rigidities in that they cover a large fraction
of the workforce, the wage measure is less subject to measurement error as it comes from an administrative
source, and it is possible to control for workers composition effects. A major limitation of the INPS data is
that there is no detailed occupation code. Therefore, I use the nationally bargained contracts interacted with
blue collar, white collar and manager indicators to proxy for occupations and I then rank them according to
the 2006 average wage mimicking the analysis performed on the LFS data.

As validation, I show in figure 5 that the changes in employment shares across occupations are similar to
those of figure 3 based on the LFS data: the occupations in the middle of the distribution are those that
experienced the largest drop in employment shares between 2007 and 2015 (the last year for which the INPS
data were available at the time of the analysis). Figure 6 compares the distributions of the observed changes
in annual wages for the lowest, middle and highest paying occupations as of 2006.

Figure 6(a) shows the distribution of the average full-time workers daily wage changes between 2009 and
2015 (a period comparable to that analyzed with the LFS data). The share of changes below zero, reported on
the graph, measures the extent to which wages are downward flexible. Not surprisingly, and somewhat in
 13
line with the descriptive evidence of figures 3 and 4, the wages of the occupations/contracts in the middle of
the distribution are those that experienced fewer downward changes. However, we see that all
occupation/contract groups experienced the same downward flexibility once controlling for workforce
composition (by plotting within worker annual changes; figure 6(b)). The degree of wage flexibility
measured by the share of changes below zero is about .3 in all occupation groups, in line with what estimated
by Adamopoulou et al. (2016).

This evidence so far is not consistent with a drop in labour demand concentrated in the middle-qualification
occupation group, as the routine-biased technical change would predict, and yet it shows some degree of
wage flexibility across occupations.Such aggregate figures mask, however, cross-sectors heterogeneity.
Panel (a) to (d) of figure 7 plot the composition adjusted wage changes for the five occupation groups in four
sectors: manufacturing, construction, whole sail and retail trade and financial activities. In sectors where
wage bargain is highly centralized and the presence of unions is stronger, e.g., manufacturing and
construction, the occupations in the middle of the distribution show a slightly lower degree of flexibility than
in other occupation/contract groups. On the other hand, retail trade is characterized by similar degrees of
flexibility across occupations while financial services show higher heterogeneity across occupation/contract
groups (and, still, not an high share of negative wage changes for the middle occupation group).

Overall, this exercise indicates that negative demand shock can result into negative wage changes despite the
rigid wage bargaining system. These changes, however, do not seem to be concentrated in the middle-paying
occupation group. It is possible, however, that the large drop in employment observed in the middle of the
distribution occurs exactly because of the wage rigidities. In fact, these latter are at least as strong in the
middle of the occupational distribution as in other parts, and possibly stronger in manufacturing and in
construction. Such wage rigidities were a possible cause for a contraction of labour demand among middle-
qualification workers as employment was the only margin of adjustment left once the crisis hit
(Adamopoulou et al., 2016).

4.4. Demand or supply? Trends in sectoral employment and in the composition of the labour force

Recent contributions by Bárány and Siegel (2018) and Comin et al. (2018) show that job polarization may
also be caused by secular trends in sectoral shifts away from manufacturing towards both low- and high-
skilled services. Similarly, the changes observed in Italy in the most recent decade may be caused by
structural changes in the sectoral composition, thus including within broad sector polarization not captured
by the time-specific sectoral indicators. Moreover, during the prolonged crisis the non-tradable sector may
have been less affected by the collapse in global trade thus contributing to the growth of the low-pay
occupations employment share. On the other hand, the collapse of the construction sector, which in 2017 is
still 26 percent below its 2007 employment level, definitely contributed to the reduction in middle-pay
routine jobs such as building trade and other related craft workers. Table 5 summarizes these changes in the

 14
employment shares for five broad activity groups as measured in the LFS data, and shows the evolution of
the within industry shares of low, middle and high-pay occupations between 2007 and 2017. 14

At the same time, recent empirical and theoretical contributions highlight the role of labour supply in shaping
the pattern of polarization (Basso et al., 2017; Cerina et al., 2018; Mandelman and Zlate, 2014). These
analyses indicate that structural changes in the participation of women and foreign born workers, possibly
endogenous to the adoption of automating technology, interplay with demand shifts: they slightly reinforce
the overall polarization patterns, depress the wages of the groups they are more in direct competition with,
while they allow incumbent workers to specialize and upgrade their skills thus contributing to capital
accumulation and improvements in welfare. Italy recently experienced significant changes in labour supply
that can be concurrent factors in determining the observed changes in the occupational structure and wage
growth. These are summarized in a recent work by De Philippis (2017) and are mainly attributable to the
recent migration waves, the ageing of the workforce, the secular increase in women labour force
participation and the rise in college graduation rates.

To investigate more formally how changes in sectoral and labour force composition shaped the occupational
changes I perform a simple Blinder-Oaxaca decomposition. Such exercise does not allow to distinguishing
demand from supply factors, as there is no credible counterfactual analysis; yet, it provides an accounting
exercise on how much of the observed changes in occupational shares can be attributed to the change in the
labour market share of each sector and demographic group (composition effect), and how much is instead
due to unexplained factors including changes in the incidence of the sectors and workforce groups in each
occupation (incidence effect).

The analysis is based on a simple regression decomposition as follows:

 ( ) = ′ + (4)

where the dependent variable is the linear probability of being employed in any of three broad occupation
categories, low, middle and high-pay, for each individual i in time t ( = {2007,2017}); the vector
contains five sectoral indicator variables and indicators for nativity status, gender, age class and education
(the omitted sector group is manufacturing). By taking the difference of average outcome between two time
periods, we recover three quantities:

14
 The aggregation into five broad sectors is forced by the changes in the ATECO classifications in 2011 which affected
mainly service subsectors. Although the service subsectors (professional services, personal services, transportation and
communication) are not fully comparable over time it is worth noting two facts. First, the largest change in the
employment share was in the transportation, utilities and ICT (+2.6 between 2007 and 2017 versus +0.3 in professional
services and +1.7 in the personal service sector). Second, personal services have among the highest incidence of low-
pay occupation (around 60 percent in 2007), and professional services have the highest incidence in high-pay
occupations (64 percent in 2007). Such large degree of heterogeneity within the service sector is hindered when looking
at the aggregated figures.
 15
• an incidence effect, that is the change in the incidence of a sector in the occupation holding its weight in the workforce fixed, ( ′ )( − −1 ); • a composition effect, that is the change of each sector and demographic group weight in the workforce times its initial incidence, ( − −1 )′ −1 ; • a residual component. For example, the incidence effect of a worker demographic characteristic (e.g., female gender) captures how much of the observed change of an occupation group is explained by the change in the presence of workers with that characteristic in the occupation, holding their labour market share constant. The composition effect, instead, measures how much of the observed change is due to the change of the demographic group weight in the workforce, holding the initial incidence constant. The main results, which are presented in figures 8 and 9, show a high degree of heterogeneity across the three occupation groups between incidence and composition effects. Figure 8 shows that the increase in the low-pay employment share is mainly due to changes in the incidence of the various components and to sectoral composition: workforce composition, in aggregate, had a negligible role. However, once we further decompose the composition effect by each single component, we find that the increase in the presence of foreign born fueled the rise of low-pay occupations by almost one fifth of the observed change while the increased number of college graduates in the workforce counteracted such effect (figure 9, panel (a)). Among the sectors, the rise of the service sector where low-pay jobs are more present, was the main contributor to the increase in their observed share (figure 9, panel (b)). All three factors, the sector and workforce composition and the incidence component, contributed to the decline of the middle-pay occupations employment share. However, most of the observed drop can be attributed to changes in the sectoral composition and in particular to the rise of the accommodation and food and services sectors (relative to manufacturing) where middle-pay jobs are less present. Finally, the observed negligible variation in the share of high-pay occupations masks a much richer dynamics. In aggregate, changes in workforce and sectoral compositions drove up the share of high-pay occupations, while the aggregate incidence and other unexplained factors drove it down (figure 6). Among the sectors, the rise of service again was the main determinant of the increase in the high-pay employment share. The rise in the college graduate share contributed positively (by more than 2.5 percentage points) to the overall change, counterbalancing – and almost netting out – the negative effects due to the increase in foreign born and to other unexplained factors. 16
5. Conclusions

The occupational structure of many advanced economies, including Italy, underwent some dramatic changes
in the last two decades (OECD, 2017). The existing US and cross-country-based literature attributes these
changes to adoption of automating technology that substitutes for routine tasks on the job, complement high-
skill analytical labour and generates demand for low-skill manual services. This note documents that the
changes in the Italian occupational structure did not occur continuously over the past two decades as it would
be predicted by the leading routine-biased technical change hypothesis. Moreover, such changes can hardly
be attributed to the adoption of routine-substituting technology in the last decade.

The descriptive evidence shows a decline in middle-pay occupations while almost all the employment
growth has been among low-pay, low-qualified occupations, complementing the growth in the high-pay,
high-qualified occupations occurred until the mid-2000s. The regression analysis supports such evidence,
although the results from indexes that summarize the characteristics of the occupations in terms of tasks
performed are not always coherent. All in all, the occupations in which employment and employment shares
grew the most were those intensive in manual tasks; those in which employment and employment shares
grew the least were associated with more routine tasks. Differently from what it would be predicted after a
demand shift, occupational wage growth does not exhibit the same patterns. The evidence presented herein,
thus, does not support the hypothesis that demand factors, such as routine-substituting technology, were the
main drivers of the observed occupational change coherent. This result is consistent with the observed
limited adoption of automating technology in Italy and it is supported by further tests on wages collected in
administrative data.

There has been a great deal of discussion about the potential for automation to substitute for routine labour
both in manufacturing and in services (Brynjolfsson and McAfee, 2011; Frey and Osborne, 2017; OECD,
2017). Such concerns are definitely well posed given the advancements of artificial intelligence and robotics,
but the exact extent of such substitution has been limited and the prospects for the labour market still
uncertain (Autor and Salomon, 2018). Still, the OECD (2017) suggested that we could observe up to 10
percent of job positions disappearing in the next 10 to 20 years in Italy due to technology-labour substitution.
The strong creation of low-qualified manual-intensive occupations and the limited adoption of automating
technology observed in the most recent decade imply that a strong reversal in both trends must occur for the
OECD hypothesis to occur.

 17
References

Acemoglu, Daron, and David Autor. 2011. “Skills, Tasks and Technologies: Implications for Employment
 and Earnings.” In Handbook of Labour Economics, Vol. 4B, edited by Orley Ashenfelter and David
 Card, 1043–1171. Amsterdam: North-Holland.
Adamopoulou, Effrosyni, Emmanuele Bobbio, Marta De Philippis and Federico Giorgi. 2016. “Wage
 rigidities and business cycle fluctuations: a linked employer-employee analysis,” IZA Journal of
 Labour Policy, 5(22).
Arntz, Melanie, Terry Gregory and Ulrich Zierahn. 2017. “Revisiting the Risk of Automation.” Economics
 Letters, 159: 157-160.
Autor, David H., and David Dorn. 2013. “The Growth of Low-Skill Service Jobs and the Polarization of the
 US Labour Market.” American Economic Review 103(5): 1553–97.
Autor, David H., Lawrence F. Katz, and Melissa S. Kearney. 2006. “The Polarization of the U.S. Labour
 Market.” American Economic Review 96(2): 189–94.
Autor, David H., Lawrence F. Katz, and Melissa S. Kearney. 2008. “Trends in U.S. Wage Inequality:
 Revising the Revisionists.” Review of Economics and Statistics, 90(2): 300–323.
Autor, David H., Frank Levy, and Richard J. Murnane. 2003. “The Skill Content of Recent Technological
 Change: An Empirical Exploration.” Quarterly Journal of Economics 118 (4): 1279–1333.
Autor, David and Anna Salomons. 2018. “Is Automation Labour-Displacing: Productivity Growth,
 Employment, and the Labour Share.” Brookings Papers on Economic Activity, forthcoming.
Ballatore, Rosario, Fabrizio Colonna, Domenico Depalo e Santiago Pereda-Fernández. 2018. “Educational
 mismatch in Italy: an appraisal.” Bank of Italy Occasional Paper, forthcoming.
Bank of Italy. 2018. Annual Report on 2017. Rome, Italy.
Bárány, Zsófia L., and Christian Siegel. 2018. “Job Polarization and Structural Change.” American
 Economic Journal: Macroeconomics, 10(1): 57-89.
Basso, Gaetano, Giovanni Peri and Ahmed Rahman. 2017. “Computerization and Immigration: Theory and
 Evidence from the Unites States.” NBER Working Paper no. 23935.
Brandolini, Andrea, Romina Gambacorta and Alfonso Rosolia. 2018. “Inequality amid income stagnation:
 Italy over the last quarter of a century.” Bank of Italy Occasional Paper No. 442.
Brunetti, Irene, Valeria Cirillo and Andrea Ricci. 2018. “Tecnologia e variazione dell’occupazione nei
 mercati locali del lavoro,” INAPP Working Paper no. 13.
Brynjolfsson, Erik and Andrew McAfee. 2011. “Race Against The Machine.” Lexington, Massachusetts:
 Digital Frontier Press.
Bugamelli, Matteo, Francesca Lotti (eds.). 2018. “La crescita della produttività in Italia: la storia di un
 cambiamento al rallentatore.” Bank of Italy Occasional Paper No. 422.
Cerina, Fabio, Alessio Moro, and Michelle Petersen Rendall. 2017. “The Role of Gender in Employment
 Polarization.” University of Zurich, Department of Economics, Working Paper No. 250.
Comin, Diego, Danial Lashkari, Martí Mestieri. 2018. “Structural Change with Long-run Income and Price
 Effects.” NBER Working Paper no. 21595.

 18
D’Amuri, Francesco and Giovanni Peri. 2014. “Immigration, jobs, and employment protection: evidence
 from Europe before and during the great recession.” Journal of the European Economic Association 12
 (2): 432-464.
De Philippis, Marta. 2017. “The Dynamics of the Italian Labour Force Participation Rate: Determinants and
 Implications for the Employment and Unemployment Rate.” Bank of Italy Occasional Paper no. 396.
Frey, Carl B., and Michael A. Osborne. 2017. “The future of employment: how susceptible are jobs to
 computerisation?.” Technological forecasting and social change 114: 254-280.
Goos, Maarten, and Alan Manning. 2007. “Lousy and Lovely Jobs: The Rising Polarization of Work in
 Britain.” Review of Economics and Statistics 89(1): 118–33.
Goos, Maarten, Alan Manning, and Anna Salomons. 2009. “Job Polarization in Europe.” American
 Economic Review 99(2): 58–63.
Goos, Maarten, Alan Manning, and Anna Salomons. 2014. “Explaining Job Polarization: Routine-Biased
 Technological Change and Offshoring.” American Economic Review 104(8): 2509-26.
Mandelman, Federico and Andrei Zlate. 2014. “Offshoring, Low-Skilled Immigration, and Labour Market
 Polarization,” Atlanta FED, Working Paper 2014-28.
OECD. 2017. “OECD Employment Outlook 2017,” OECD Publishing, Paris,
 https://doi.org/10.1787/empl_outlook-2017-en.
Olivieri, Elisabetta. 2012. “Il cambiamento delle opportunità lavorative.” Bank of Italy Occasional Paper no.
 117.
Olivieri, Elisabetta and Viki Nellas. 2012. “The Change of Job Opportunities: the Role of Computerization
 and Institutions,” Working Paper DSE no. 804.
Rosolia, Alfonso. 2010. “L’Evoluzione delle retribuzioni in Italia tra il 1986 e il 2004 secondo i dati
 dell’archivio WHIP.” Politica Economica 2.
Schivardi, Fabiano and Tom Schmitz. 2018. “The IT Revolution and Southern Europe’s Two Lost Decades.”
 Working paper.

 19
Figures and tables

 Figure1. Percentage point change in share of total employment, 1995-2015; selected countries from
 OECD (2017)
 15

 10

 5

 0

 -5

 -10

 -15
 ESP FRA OECD Avg. ITA DEU USA
 Low-pay/skill Middle-pay/skill High-pay/skill

 Source: OECD Employment Outlook (2017), figure 3.A1.1 (extract, selected countries). OECD calculations based on
 the European Labour Force Survey, Canada, Japan, and Switzerland labour force surveys and the United States CPS
 MORG.
Note: According to the OECD Employment Outlook (2017), high-paying (and high-skill) occupations include jobs
classified under the ISCO-88 major groups 1, 2, and 3. That is, legislators, senior officials, and managers (group 1),
professionals (group 2), and technicians and associate professionals (group 3). Middle-paying (middle-skill)
occupations include jobs classified under the ISCO-88 major groups 4, 7, and 8. That is, clerks (group 4), craft and
related trades workers (group 7), and plant and machine operators and assemblers (group 8). Low-paying (low-skill)
occupations include jobs classified under the ISCO-88 major groups 5 and 9. That is, service workers and shop and
market sales workers (group 5), and elementary occupations (group 9). As agricultural, fishery and mining industries
were not included in the analysis, those occupations within ISCO-88 group 6 (agricultural and fisheries workers) were
likewise excluded.

 20
Figure 2. Trends in employment shares and employment growth by broad occupation group, 2007-
 2017

 Panel (a). 2007-2017 changes in occupational Panel (b). 2007-2017 changes in occupational
 employment share employment share with classification break

 Panel (c). 2007-2017 changes in occupational employment growth (2007 = 100)

Notes: Author’s elaboration on Istat Labour Force Survey microdata; private employment excluding agriculture, health
services and education. The high-pay/skill group is composed of 1, 2 and 3 one-digit ISCO-88 occupations (managers,
professionals, technicians and associate professionals); the middle-pay/skill group is composed of 4, 7 and 8 one-digit
ISCO-88 occupations (clerks, craft and related trades workers, and plant and machine operators and assemblers); the
low-pay/skill group is composed of 5 and 9 one-digit ISCO-88 occupations (service workers and shop and market sales
workers, and elementary occupations).

 21
Figure 3. Change in employment shares and in real wage by occupational mean wage (percentage

 points)
Notes: Author’s elaboration on 2007-2017 Istat Labour Force Survey microdata (2009-2017 for wage growth); private
employment excluding agriculture, health services and education. Top coded earnings at 3,000 euros are corrected by a
1.25 factor similar to Autor, Katz and Kearney (2008). Robustness checks are provided in the Appendix. The wage
deciles are calculated for the average occupational wage as measured in the 2006 Eurostat Structure of Earnings Survey
for Italy.

 Figure 4. Percentage change in employment shares and in real wage growth by occupational mean
 wage in Italy and in the US, 2007-2017

 Panel A. Italy Panel B. USA
Notes: Author’s elaboration on Istat Labour Force Survey microdata and Census Bureau ACS; wage growth is
calculated on the period 2009-2017 for Italy and 2007-2017 for the US. Top coded earnings are corrected by a 1.25
factor similar to Autor, Katz and Kearney (2008) for both countries. The hourly deciles are calculated for the average
occupational wage as measured in the 2006 Eurostat Structure of Earnings Survey for Italy and the 2006 ACS for the
US.

 22
Figure 5. Change in occupational shares across different contract groups (x axis, indexed 1-5), 2007-
 2015

Notes: Author’s elaboration on INPS microdata; private employment excluding agriculture, health services and
education. Occupation groups are proxied by five broad categories binning national contracts codes according to their
2006 average wage ranking.

 23
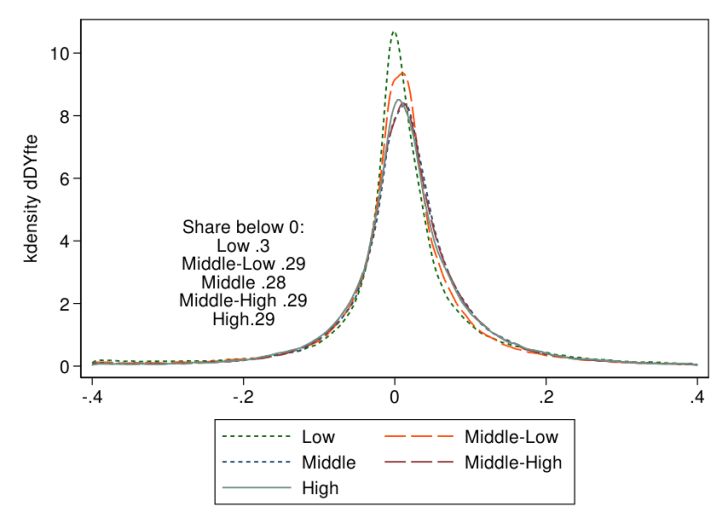
Figure 6. Distribution of wage changes across different contracts, 2009-2015
 Panel (a): Not adjusting for workforce composition

 Panel (b): Adjusting for workforce composition (within worker annual changes)

Notes: Author’s elaboration on INPS microdata; private employment excluding agriculture, health services and
education. Occupation groups are proxied by five broad categories binning national contracts codes according to their
2006 average wage ranking. The share of negative changes is reported in the graph for each occupation/contract group.
Panel (a) does not adjust for workforce composition, while panel (b) does by plotting within worker annual wage
changes.

 24
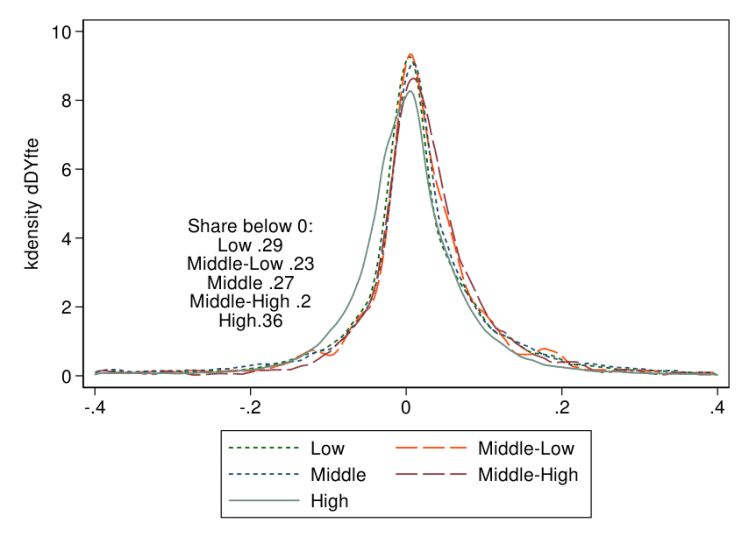
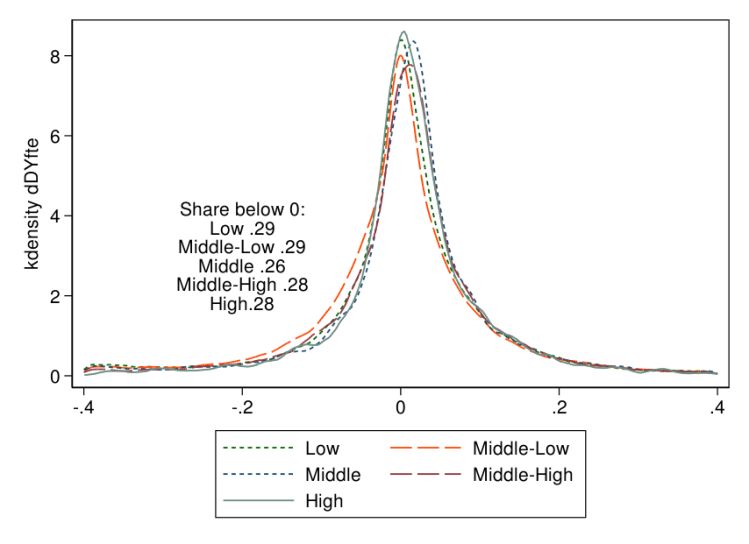
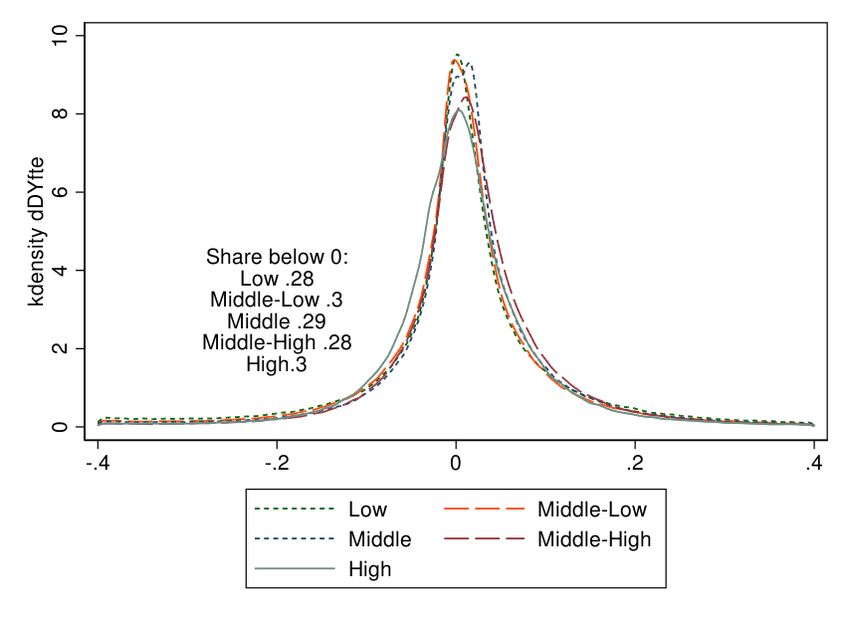
Figure 7. Distribution of wage changes across different contracts in four sectors, 2009-2015

 Panel (a): Manufacturing Panel (b): Construction

 Panel (c): Retail and wholesale trade Panel (d): Financial service sectors

Notes: Author’s elaboration on INPS microdata; private employment excluding agriculture, health services and
education. Occupation groups are proxied by five broad categories binning national contracts codes according to their
2006 average wage ranking. The share of negative changes is reported in the graph for each occupation/contract group
controlling for workforce composition (by plotting within worker annual wage changes). The four panel report the
results for the manufacturing (panel a), construction (panel b), retail and wholesale trade (panel c) and financial service
sectors (panel d).

 25
You can also read