X Old age work and income security in middle income countries: Comparing the cases - Authors / Carla Henry, Matías Golman
←
→
Page content transcription
If your browser does not render page correctly, please read the page content below
ILO Working Paper 34

                                            June / 2021

XX   Old age work and income security in
     middle income countries: Comparing
     the cases

     Authors / Carla Henry, Matías Golman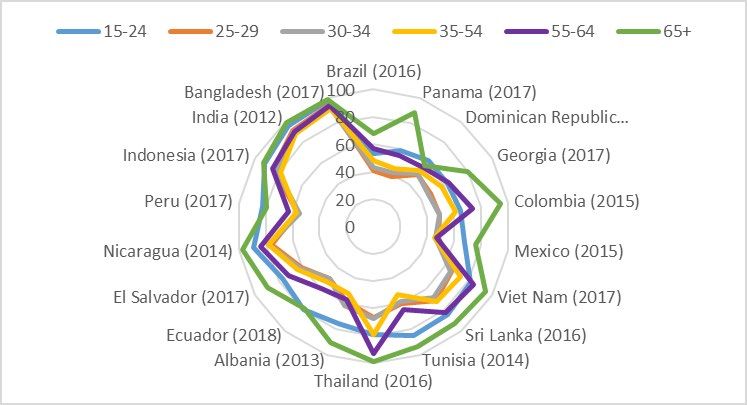
Copyright © International Labour Organization 2021

This is an open access work distributed under the Creative Commons Attribution 3.0 IGO License (http://
creativecommons.org/licenses/by/3.0/igo). Users can reuse, share, adapt and build upon the original work,
even for commercial purposes, as detailed in the License. The ILO must be clearly credited as the owner
of the original work. The use of the emblem of the ILO is not permitted in connection with users’ work.

Translations – In case of a translation of this work, the following disclaimer must be added along with the
attribution: This translation was not created by the International Labour Office (ILO) and should not be consid-
ered an official ILO translation. The ILO is not responsible for the content or accuracy of this translation.

Adaptations – In case of an adaptation of this work, the following disclaimer must be added along with
the attribution: This is an adaptation of an original work by the International Labour Office (ILO). Responsibility
for the views and opinions expressed in the adaptation rests solely with the author or authors of the adaptation
and are not endorsed by the ILO.

All queries on rights and licensing should be addressed to ILO Publications (Rights and Licensing), CH-1211
Geneva 22, Switzerland, or by email to rights@ilo.org.

ISBN: 9789220348741 (print)
ISBN: 9789220348758 (web-pdf)
ISBN: 9789220348765 (epub)
ISBN: 9789220348772 (mobi)
ISSN: 2708-3446

The designations employed in ILO publications, which are in conformity with United Nations practice, and
the presentation of material therein do not imply the expression of any opinion whatsoever on the part of
the International Labour Office concerning the legal status of any country, area or territory or of its author-
ities, or concerning the delimitation of its frontiers.

The responsibility for opinions expressed in signed articles, studies and other contributions rests solely with
their authors, and publication does not constitute an endorsement by the International Labour Office of
the opinions expressed in them.

Reference to names of firms and commercial products and processes does not imply their endorsement
by the International Labour Office, and any failure to mention a particular firm, commercial product or pro-
cess is not a sign of disapproval.

ILO Working Papers summarize the results of ILO research in progress, and seek to stimulate discussion of a
range of issues related to the world of work. Comments on this ILO Working Paper are welcome and can be sent to
RESEARCH@ilo.org.

Authorization for publication: Richard Marc, SAMANS, Department Director, RESEARCH

ILO Working Papers can be found at: www.ilo.org/global/publications/working-papers

  Suggested citation:
  Henry, C., Golman, M. 2021. Old age work and income security in middle income countries: Comparing the
  cases, ILO Working Paper 34 (Geneva, ILO).
01     ILO Working Paper 34

     Abstract

     This paper considers the rapid demographic ageing trend experienced in many middle-income countries
     and examines how the dimensions of these demographic shifts can be combined with other dimensions
     related to employment, retirement and social protection in order to classify countries according to their
     level of preparedness to secure adequate income for their rapidly ageing population. This paper differs
     from other such studies as it deliberately incorporates employment measures and distributional aspects
     alongside economic and social protection measures in calculating a preparedness and vulnerability index.

     Patterns of work and income security up to and during old age were incorporated into the index using
     data from 35 middle-income and upper-middle-income countries, all of which will face ageing populations
     over the next 10 to 30 years. The index presented in this paper differs from other indices as it incorporates
     current employment dimensions relevant to the delivery of old-age income security in the future. Drawing
     from a wide array of country-specific indicators, this study seeks to identify configurations of descriptive
     variables that can approximate underlying relative differences between countries in terms of economic
     and social preparedness, distributional vulnerability and gender inequality.

     The results of the factor analysis suggest that, for social preparedness, the standard of living and strength
     of social protection in a country are two important underlying factors. For distributional vulnerability, the
     relative prevalence of low-quality employment and of poverty combined with inequality are the two domi-
     nant underlying factors which can be used to distinguish between countries. Finally, for gender inequality,
     the employment gender gap is the main factor, comprising gender differences in labour force participa-
     tion and in youth preparedness for employment, both of which significantly influence life-long earnings
     and retirement income.

     About the authors

     Carla Henry is an applied economist who has worked for the ILO since 2002. Her current research inter-
     ests include vulnerable groups in economic transformation, the role of agricultural work in development,
     and labour rights in agriculture. She recently published two country studies on old-age work and income
     security (China and Mexico). Prior to joining the research department in 2016, Carla was the ILO’s senior
     evaluation officer. She has over 30 years of development work experience, mostly related to agricultural
     and rural policies and programmes. She holds a Masters degree in agricultural economics from Michigan
     State University and an MBA from Virginia Technical University.

     Matias Golman is a researcher and consultant affiliated with the University of Nottingham, UK and the
     University of Buenos Aires, Argentina. He specialises in labour economics and development, with experi-
     ence as a consultant for the World Bank Group and the International Labour Organization. He holds a MSc
     in Economics from the University of Buenos Aires, and a MSc in Applied Labour Economics for development
     from the University of Turin and the International Training Centre of the International Labour Organization.
     He is currently pursuing a MRes/PhD at the University of Nottingham.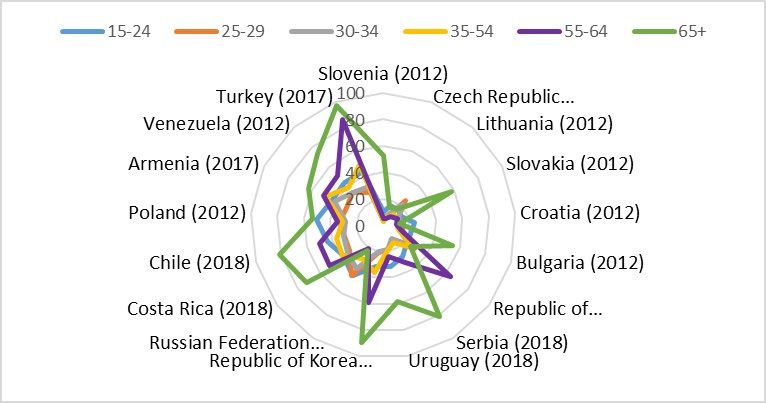
02    ILO Working Paper 34

     Table of contents

         Abstract   01

         About the authors   01

         Introduction   05

     XX 1 Conceptual approach   06
         1.1 Indicators of preparedness and vulnerability regarding old-age income security   07

             1.1.1 Demographic factors indicating the characteristics of ageing populations   07

             1.1.2 Economic and human capital factors   07

             1.1.3 Employment characteristics of populations of prime age, nearing old age and in old age   08

             1.1.4 Pensions, public assistance and medical coverage   08

             1.1.5 Gender inequality   09

         1.2 Methods for measurement   09

         1.3 Data and sampling   10

     XX 2 Results   12
         2.1 Descriptive analysis   12

         2.2 Multivariate results   20

             2.2.1 Social preparedness for old-age income security   20

             2.2.2 Distributional vulnerability to old-age income insecurity   23

         2.3 Gender gap in old-age income security   25

         2.4 A composite index   27

     XX 3 Discussion   29

         References   31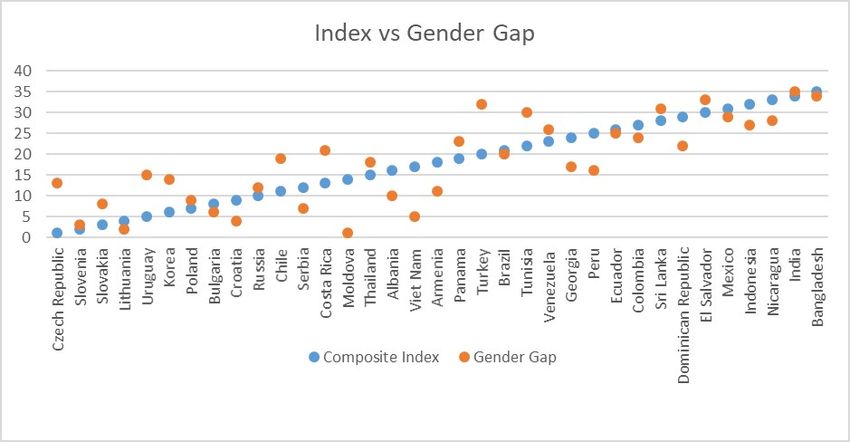
03    ILO Working Paper 34

     List of Figures

         Figure 1. Employment-based economic dependency (EbDR) by country   14

         Figure 2. Gender gap in EbDR   15

         Figure 3. Change in EbDR if persons aged 70+ cease working   16

         Figure 4. Labour force participation rate by age group   17

         Figure 5. Informal employment rate by age group (most recent data)   18

             5.a. Men: Countries with a low rate of informal employment   18

             5.b. Men: Countries with a high rate of informal employment   18

             5.c. Women: Countries with a low rate of informal employment   18

             5.d. Women: Countries with a high rate of informal employment   18

         Figure 6. Scoreplot for social preparedness   23

         Figure 7. Scoreplot for distributional vulnerability   25

         Figure 8. Factor scores for gender inequality   27

         Figure 9. Composite index compared to GDP and HDI rankings   28

         Figure 10. Composite index compared to gender gap country rankings   28

         Figure 11. Dimensions of old-age income security preparedness   29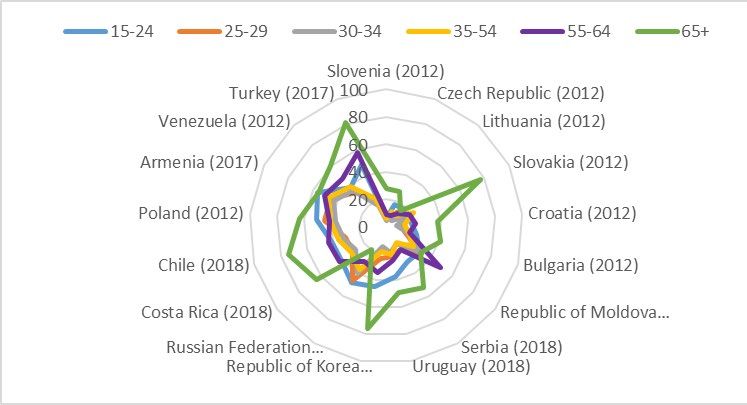
04    ILO Working Paper 34

     List of Tables

         Table 1. Indicator matrix   10

         Table 2. Descriptive indicators of sampled countries    11

         Table 3. Key demographic and social protection indicators   19

         Table 4. Correlation matrix of social preparedness indicators   21

         Table 5. Orthogonal varimax rotation factor matrix for preparedness   22

         Table 6. Correlation matrix of old-age distributional vulnerability indicators   24

         Table 7. Orthogonal varimax rotation factor matrix for old-age distributional vulnerability   24

         Table 8. Factor analysis results for gender inequality   26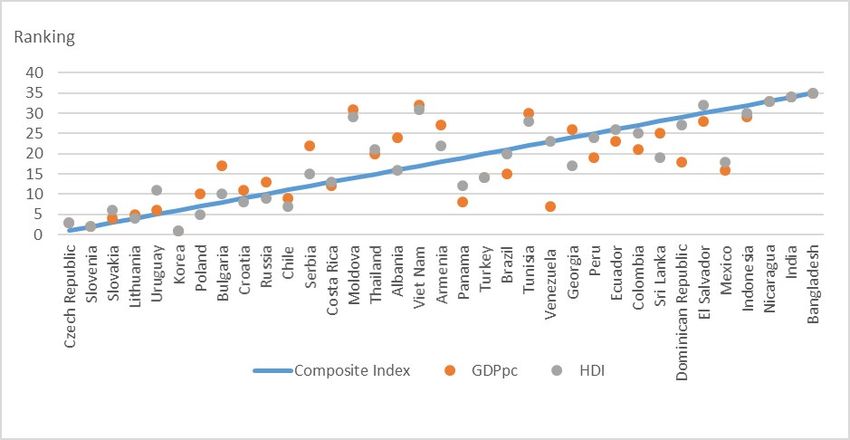
05      ILO Working Paper 34

     Introduction

     Income security has long been the hallmark of the aged. Nonetheless, along with health security, ensuring
     the quality and coverage of income security constitutes a major challenge for governments of countries
     with ageing populations, in which the proportion of the population aged 60 years and older is growing rap-
     idly. The International Labour Organization (ILO) (2000) defines income security as relating to income level
     (absolute and relative to need), assurance of receipt, expectation of income adequacy now, and expecta-
     tion of improvement or deterioration in the future, both during a person’s working life and in old age or
     disability retirement. Social protection, pension, savings, work and health are the most important pillars for
     supporting the income security of older persons. Policies in these areas have a cumulative effect later in a
     person’s life and are therefore critically important. This perspective may not be well imbedded within the
     priorities of policymakers, however, as they must simultaneously struggle with shorter-term policy needs.

     This paper considers the rapid demographic ageing trend experienced in many middle-income countries
     and examines how the dimensions of these demographic shifts can be combined with other factors relat-
     ed to employment, retirement and social protection to classify countries according to their level of prepar-
     edness to secure adequate income for their rapidly ageing population. This paper differs from other such
     studies as it deliberately incorporates employment measures and distributional aspects alongside economic
     and social protection measures in calculating a preparedness and vulnerability index.

     Patterns of work and income security up to and during old age were incorporated using data from 35 mid-
     dle-income and upper-middle-income countries, all of which will face ageing populations over the next 10
     to 30 years. The index presented in this paper differs from other indices as it incorporates current employ-
     ment dimensions relevant to the delivery of old-age income security in the future. Drawing from a wide
     array of country-specific indicators, the study seeks to identify configurations of descriptive variables that
     can approximate underlying relative differences between countries in terms of economic and social pre-
     paredness, distributional vulnerability and gender inequality.

     Factor analysis was used to simplify the task of comparing countries based on multiple variables, by identi-
     fying a handful of underlying factors. The results of the factor analysis suggest that, for social preparedness,
     the standard of living and strength of social protection in a country are two important underlying factors.
     For distributional vulnerability, the relative prevalence of low-quality employment and of poverty combined
     with inequality are the two dominant underlying factors that can be used to distinguish between countries.
     Finally, for gender inequality, the employment gender gap is the main factor of significance, comprising
     gender differences in labour force participation and in youth preparedness for employment, both of which
     heavily influence life-long earnings and retirement income.

     This study is intended to encourage further consideration of how employment aspects can directly contrib-
     ute to composite comparisons of income security in old age and to potential monitoring of national capa-
     bilities with a view to improving social preparedness, reducing vulnerabilities and narrowing gender gaps
     before the population ages considerably. Improving the measurement of such capabilities can shift policy
     towards a much-needed longer-term perspective.
06     ILO Working Paper 34

     XX   1 Conceptual approach

     The labour market plays a crucial role in all types of old-age income security systems, and patterns of la-
     bour market participation over an individual’s life course influence the relative differences in income secu-
     rity between individuals later in life. Labour market differences between countries and between men and
     women within a country are therefore significant.

     Income in old age may take various forms. It can come from wages or work-sourced income, support from
     family or the community, benefits from an enterprise where the individual currently works or previously
     worked, government support and transfers, and income from investments and savings. Differences in in-
     come security in old age largely stem from the economic inequalities that individuals experience during
     their working lives. Strong evidence already exists to support the importance of the accumulation of ad-
     vantages and disadvantages throughout the life course (Mason and Lee 2013; Weller and Newman 2020).
     Unlike in most highly industrialized countries, contributory pensions in middle-income countries have a
     minimal impact on income security in old age, particularly in contexts of high informality and non-stand-
     ard employment.

     Labour market reforms and life course trajectories deviate from the prevailing aim of regular full-time
     employment until retirement. The Organisation for Economic Co-operation and Development (OECD) has
     flagged additional factors that account for ongoing change in prospects for old-age income security, such
     as higher life expectancy, increasing mobility and migration of the labour force, segmented working lives,
     higher female labour force participation and, in some cases, an expanding informal sector workforce.
     Pension reforms have also weakened coverage and benefits for individuals who fall outside of formal, reg-
     ular employment records (ILO 2014a). Given that, in most countries, income insecurity is more pronounced
     among older women, gender gaps in work and in income security should be singled out for particular at-
     tention. Inequalities experienced in old age on the basis of gender and other factors, such as locality, are
     linked to labour gaps earlier in the individual’s life course, both during prime working age and at earlier
     points during education (OECD 2017).

     The OECD analysis further shows that differences in experiences of education, health, gender and em-
     ployment interact with one another and compound inequality, and that earnings inequality is increasing
     in part because of the rising share of non-standard work, labour market difficulties for women and youth,
     and high unemployment in some countries over the past decade. In middle-income countries, earning in-
     equalities are also prevalent (Vo et al. 2019).

     The concept of preparedness draws on the idea of making something ready for use or consideration or
     to be dealt with. Preparedness partly reflects the extent to which national policies and programmes are in
     place to support old-age income security in the near- and medium-term future. It can also reflect the rela-
     tive economic strength and security of the country. Preparedness can be thought of as the relative assets
     within a country available to support the delivery of old-age income.

     Distributional vulnerability, which can take the form of disadvantages and inequalities among individuals
     within the same country, is also related to a country’s level of preparedness. Vulnerability incorporates vari-
     ables that reflect the characteristics of marginalized groups, and the extent to which they are marginalized,
     such as their dependency on old age work or family support during old age, which suggests that they likely
     do not benefit from the wealth and social protection policies and programmes available in their countries.
     Indicators of distributional vulnerability capture the depth and breadth of the population that falls outside
     of adequate old-age income support systems compared with the population that can reasonably expect
     to receive income support from pensions, social assistance, savings and assets.
07 ILO Working Paper 34
By focusing on middle-income countries, this study was able to capture a wide range of country policies and
conditions. It provides a comparative insight into how well such countries are coping with their ageing popu-
lations in the face of numerous economic and social constraints. The focus on middle-income countries also
complements the more regular monitoring of ageing across OECD countries and within geographic regions.
Several indices already exist to capture relative differences across countries with aging populations in social
protection, financing and economic growth. However, almost none of these indices incorporate employ-
ment-related factors in their consideration of future preparedness. Several indices focus on gauging the ade-
quacy of national social protection systems, including financial sustainability elements. The Social Protection
Floor Index, for example, compares national gaps in social protection financing,1 particularly those related
to adequate coverage for poor and vulnerable individuals throughout the life cycle (Bierbaum, Schildberg
and Cichon 2017). Somewhat in contrast, the Global Aging Preparedness Index (Jackson, Howe and Peter
2013) combines two sub-indices, the first of which informs policy decisions based on the public burden, fis-
cal room and benefit dependence, and the second of which gauges living standards of the elderly relative
to the non-elderly in each country. The two indices suggest that countries face a trade-off between fiscal
sustainability and income adequacy. The third index worth mentioning is the Human Development Index
(HDI) of the United Nations Development Programme (UNDP), which ranks countries based on three main
dimensions: health, education and gross national income per capita. In thisindex, the scores for the three
indices are aggregated into a composite index using a geometric mean.
1.1 Indicators of preparedness and vulnerability regarding
old-age income security
1.1.1 Demographic factors indicating the characteristics of ageing populations
Life expectancies have been extending throughout much of the world, which has resulted in many older
persons living for several decades after their retirement from work. Life expectancy differences can reflect
differences in living standards between countries. Recognizing the diversity of life expectancies and retire-
ment situations, this study uses the employment-based economic dependency ratio (EbDR)2 (Loichinger et al.
2014) as it takes into account old-age work. In addition to capturing information similar to the more stand-
ard measures used in old-age dependency ratios, which calculate the proportion of the population over the
age of 65 divided by the proportion of the employed population of working age (15 to 64 years), the EbDR
also reflects the effects of varying levels of labour participation during prime working years and in old age.
1.1.2 Economic and human capital factors
The economic development situation of a country has a bearing on its capacity to deliver income security
to its older population. Gross domestic product (GDP) per capita is frequently used as a proxy measure-
ment for a country’s standard of living. It captures the value added of production in a country during a
designated period and divides this by the current population. Additional dimensions reflecting the relative
development situation of a country are captured in life expectancy and levels of educational achievement.
Indicators can also capture the vulnerability of a given country by measuring distributional aspects of devel-
opment. By measuring the proportion of the population with access to health facilities, safe drinking water
and improved sanitation facilities, it is possible to create a comparison of the state of basic services available
1
The minimum level of income and health security is based on requirements laid out in the ILO Social Protection Floors Recommendation,
2012 (No. 202).
2
The EbDR is the ratio between the number of individuals of working age (15 years or above) who are unemployed or inactive and the
size of the total employed population of working age.08 ILO Working Paper 34
to more marginalized segments of the population. The Gini coefficient is a common measure of income in-
equality that reflects how far a country’s wealth or income distribution is skewed from an equal distribution.
Poverty and inequality affect older persons differently depending on the country. In some countries, ine-
quality and poverty among older persons can decline where social security is effective in providing a social
protection floor. However, in other countries, many prime-aged individuals (25 to 54 years) who experience
poverty and inequality can expect to face similar hardships once they reach old age. National poverty rates,
which capture the proportion of the population living below the national poverty line, point to the extent
of the hardship faced by persons – both young and old – with low incomes in meeting their basic needs or
in saving for the future.
1.1.3 Employment characteristics of populations of prime age, nearing old
age and in old age
Employment is the most important source of income security for most individuals. Older workers transi-
tion out of employment in a variety of ways. While access to decent employment has accumulative bene-
fits up to and throughout old age, labour force participation at all life stages can differ widely. In countries
with a large proportion of rural and urban informal employment, relatively few individuals have access to
a pension, and older persons in informal employment tend to remain in the labour force for longer than
those working in formal employment. Individuals who achieve a number of years of formal employment
frequently benefit from pensions after retirement; work during old age may, in this case, signify a prefer-
ence for work, a need to complement an inadequate pension or a choice to postpone access to a pension
scheme until terms become more favourable later in life (ILO 2014a).
Employment prospects for older persons are influenced by the type of jobs that they can attain and by their
workplace environment. Compared to prime-age workers, older workers are somewhat over-represented
in self-employment, part-time work and unpaid family work. This situation appears to continue post-re-
tirement age for those in work. Likewise, the level of unemployment among persons nearing old age (55
to 64 years) can point to later vulnerability for those same groups in old age.
In addition to the quality of work accessed by older persons (65 years and over), lower quality work leading
up to retirement age can also signal the relative vulnerability of an individual with regard to savings, pen-
sion eligibility and other forms of security during old age. The proportion of total employment represented
by informal employment or agricultural employment aligns closely with the limited eligibility of workers to
access contributory retirement schemes.
Another possible indicator of the over-reliance on work for security among very old persons is the propor-
tion of the population over the age of 75 who are still in work.
1.1.4 Pensions, public assistance and medical coverage
Although pension systems are designed to provide income upon retirement, there are marked differences
with regard to eligibility, coverage and benefits. The type of pension schemes available can lead to large
differences between countries in terms of income security and labour supply at older ages. Nearly half (48
per cent) of all persons over pensionable age do not receive a pension (ILO 2018). For many of those who
do receive a pension, it is not adequate. As a result, the majority of the world’s older women and men have
no guarantee of income security and may continue working for as long as they can, often in badly paid and
precarious conditions. Large differences also exist between countries and regions; residents of European
countries are more likely to rely on pension income in old age, while those in Latin American and Asian
countries have tended to rely more on work, personal capital and family networks.09 ILO Working Paper 34
According to ILO research, long-term inequality, variable voluntary pension coverage and low pay-outs from
old-age social assistance all contribute to old-age poverty. Pension entitlements dictate the level of poverty,
as they are often the main source of income after retirement (Hinrichs and Jessoula 2012). The level of these
pensions depends directly on workers’ career paths during their working life and on the age at which they
exit the labour market (ILO 2014b). The OECD (2017a) has shown that, in countries with large formal econ-
omies, the greater the share of older persons’ incomes that comes from public pensions, the less old-age
poverty there is. In countries with large informal economies, the greater the coverage of non-contributory
pension schemes, the lower the rate of old-age poverty.
Key indicators of the adequacy of each country’s pension schemes include estimates of the proportion of
the population covered by an effective contributory pension scheme, the proportion covered by an effec-
tive non-contributory pension scheme, and the proportion of GDP represented by public social protection
expenditure for older persons (excluding healthcare).
Additionally, access to affordable health services and healthcare coverage for medical treatment are major
components of old-age income security. Old age brings a greater risk of chronic or acute health problems,
and poor or deteriorating health is a frequent reason for early exit from the labour market. The relative
health of older individuals and the relative quality of healthcare available to them are reflected in several
indicators, such as life expectancy and healthy life expectancy.
1.1.5 Gender inequality
Disparities in old-age income security can reflect accumulated disadvantages based on the individual’s lo-
cation, gender, socio‐economic status and other characteristics. Attitudes and practices towards older per-
sons, and the lack or inadequacy of laws and policies (and their enforcement) that provide for equality and
minimum standards of living, can widen the income security gap between population segments (OECD
2017b). Gender gaps can be found in many areas, including life expectancy, retirement age, pension eli-
gibility and coverage, quality of work, family situation, care and housework, health coverage, wealth and
savings, widowhood, divorce status, child situation and access to government transfer income.
Social policy configurations can influence the distribution of opportunities in diverse ways, including wom-
en’s participation in economic life. This can take the form of differences in paid employment, the skills and
education acquired and the quality of jobs accessible, as well as differences in access to, and adequacy of,
social protection. Non-standard work – typically part-time or temporary work, self-employment and unpaid
family work – are also more common among women and can widen gender-based inequality.
Gender inequality in old-age income security is also affected by lower levels of labour force participation
and wages among women, the large number of women who work in informal jobs, and the fact that wom-
en often have shorter, interrupted careers due to child‐bearing and care‐giving for children and other fam-
ily members in need. At the same time, women tend to live longer than men and so require income for
longer periods of time (Jolly, n.d.).
Key measures linked to old-age gender inequality include the gender gaps in life expectancy, retirement
age, contributory and non-contributory pension scheme coverage, labour force participation, informal and
unpaid family work and education.
1.2 Methods for measurement
To summarize and reduce indicators in a more logical manner and to explore potential patterns across di-
mensions, this study makes use of factor analysis. This method can help to identify appropriate means of
clustering and weighting various indicators. Factor analysis is a method of extracting underlying compo-
nents from a set of information provided by indicators. The statistical model for factor analysis is:10 ILO Working Paper 34
=^
∑ ′ + ^
LL ψ
where ^L is the loading matrix,
L′ is the loading matrix transposed and ψ ^ is the uniqueness, all of which are
estimated values. Through factor analysis, a series of weights (w ) or scores distribute the indicators’ degree
of association of each indicator with each of the calculated dimensions for a given country:
Social preparedness = Wv1 *Pre1i + Wv2 *Pre 2i + Wv3 *Pre 3i + … + Wvu * Uiv
Distributional vulnerability = Wv1 *Vul1i + Wv2 *Vul2i + Wv3 *Vul3i + … + Wvu * Uiv
Gender inequality = Wv1 *Ine1i + Wv2 *Ine2i + Wv3 *Ine3i + … + Wvu * Uiv
Using a range of indicators assessed for their feasibility and appropriateness with regard to the analytical
approach at hand, this study identifies and estimates underlying factors for preparedness, distributional
vulnerability and gender inequality. Insufficient data were available for some countries for certain promis-
ing variables (e.g. employment data and old-age poverty rates). The set of measures compiled and tested
for analysis are summarized in Table 1 below.
XX Table 1. Indicator matrix
Social preparedness Distributional vulnerability Gender inequality
GDP per capita Gini index Gender gap in life expectancy
Secondary education completion Not in education, employment or training Gender gap in retirement age
(NEET) rate
Public healthcare expenditure Poverty rate Gender gap in (contributory) pension
coverage
Labour force participation ages 55–64 Informal employment rate (as a Gender gap in rates of informal
and ages 65–74 proportion of total employment) employment and unpaid work
Old-age effective contributory pension Labour force participation rate for Gender gap in NEET rate
coverage (per cent) persons aged 75+
Social protection non-health Old-age effective non-contributory Gender gap in secondary education
expenditure on persons aged 65+ pension coverage (inverse relationship) completion
(per cent)
Social protection expenditure for all Proportion of employment represented Gender gap in labour force
by agricultural work participation
Life expectancy Proportion of persons engaged in unpaid Gender gap in rate of unpaid
family work family work
Economic dependency ratio
(inverse relationship)
1.3 Data and sampling
The analysis is based on a sample of 35 middle-income and upper-middle-income countries with labour
force data, covering, for the most part, the period from 2000 to 2018. A total of 90 countries were identified
for consideration in this study, based on predictions made by the United Nations Department of Economic
and Social Affairs (UNDESA) that over 20 per cent of their respective populations would be aged 60 and
above by 2050. Over half of the of the countries were subsequently dropped from the analysis due to labour
force data limitations (such as China and Morocco) or social protection data limitations (such as Argentina
and Bosnia and Herzegovina). Ultimately, 35 countries were included, covering a large number of sub-re-
gions: Eastern and Central Europe; South and Central America; South, Southeast and East Asia; and North
Africa. The countries included are profiled in Table 2 below.11 ILO Working Paper 34
XX Table 2. Descriptive indicators of sampled countries
Country Population over Population over GDP per capita Informal
the age of 65 the age of 65 (in thousands of employment
(2015) (2050) United States
dollars)
Albania 17.9% 33.4% 5.3 60.9%
Armenia 15.8% 29.7% 4.2 47.9%
Bangladesh 7.2% 21.9% 1.7 94.7%
Brazil 12.0% 29.4% 8.9 50.4%
Bulgaria 27.0% 36.4% 9.3 16.1%
Chile 15.3% 31.6% 15.9 40.7%
Colombia 11.5% 27.4% 6.7 60.9%
Costa Rica 12.6% 30.7% 12.0 36.9%
Croatia 26.3% 37.9% 14.9 13.5%
Czechia 24.9% 35.5% 23.0 9.2%
Dominican Republic 9.6% 21.4% 7.7 53.2%
Ecuador 9.8% 21.4% 6.3 62.4%
El Salvador 11.0% 28.5% 4.1 70.2%
Georgia 20.1% 21.7% 4.3 58.6%
India 8.9% 19.5% 2.0 91.5%
Indonesia 8.5% 21.1% 3.9 83.6%
Lithuania 24.5% 36.1% 19.1 12.7%
Mexico 10.0% 22.6% 9.7 54.7%
Nicaragua 7.4% 20.5% 2.0 78.7%
Panama 10.8% 23.0% 15.6 48.9%
Peru 10.7% 24.9% 6.9 67.9%
Poland 22.7% 38.8% 15.4 38.2%
Republic of Korea 18.3% 44.8% 31.4 34.4%
Republic of Moldova 16.5% 33.4% 3.2 32.1%
Russian Federation 20.0% 30.6% 11.3 35.5%
Serbia 24.3% 34.3% 7.2 19.8%
Slovakia 20.7% 36.4% 19.5 16.9%
Slovenia 25.1% 38.8% 26.2 5.7%
Sri Lanka 14.0% 28.1% 4.1 74.0%
Thailand 15.7% 35.8% 7.3 78.7%
Tunisia 11.8% 26.4% 3.4 58.8%
Turkey 11.5% 26.8% 9.3 35.0%
Uruguay 19.2% 27.6% 17.3 23.9%
Bolivarian Republic of Venezuela 9.6% 20.9% 16.1 39.7%
Viet Nam 10.2% 27.2% 2.6 73.4%
Note: All data on GDP per capita are from 2018, with the exception of the Bolivarian Republic of Venezuela (2014). For in-
formal employment, the last years for which data were available were: 2018 for Chile, Costa Rica, Ecuador, Serbia and
Uruguay; 2017 for Armenia, Bangladesh, El Salvador, Georgia, Indonesia, Panama, Peru, Turkey and Viet Nam; 2016 for Brazil,
Dominican Republic, Sri Lanka and Thailand; 2015 for Colombia and Mexico; 2014 for Nicaragua, Republic of Korea, Russian
Federation and Tunisia; 2013 for Albania; 2012 for Bulgaria, Croatia, Czechia, India, Lithuania, Poland, Slovakia, Slovenia and
Bolivarian Republic of Venezuela; 2010 for Republic of Moldova.12 ILO Working Paper 34
XX 2 Results
2.1 Descriptive analysis
Prior to submitting the indicators to a factor analysis, a descriptive analysis of country-level data was com-
pleted, with a focus on employment and social protection. The results show large disparities between coun-
tries with regard to the extent of labour force participation as individuals near and surpass national retire-
ment age. Figure 1 shows the effect of these differences on the EbDR. Compared with 2007 (or the closest
year for which data were available), by 2017, 20 of the 35 countries sampled had experienced a decrease
in EbDR, with Turkey, Georgia and Poland showing the largest decline. Meanwhile, Nicaragua, Brazil and
Peru underwent the highest increase in EbDR over the period of analysis.
All 35 countries are projected to see increases in EbDR by 2050, if employment rates and retirement trends
remain unchanged, with Thailand, Slovakia and Slovenia at the top of the projected increases. The 2050
projections capture the purely demographic effect of these trends, using UN projections of country popu-
lation growth and ageing (UNDESA 2015 and 2019), which suggest how population ageing will affect the
need for economic support from the working population. Tunisia, for example, will need almost two active
workers for each inactive or unemployed individual aged 15 years and over. As shown in Figure 2, major
gender gaps exist in EbDR, particularly in India, Bangladesh and Tunisia, where the EbDR for females aged
15 years and above is, respectively, 11.6, 6.9 and 6.3 times that of men.
The examination of labour force participation, in contrast, uncovers a general trend over time of slightly in-
creased labour participation among the population nearing old age (55 to 64 years), with a slightly larger
per cent increase among women. Figure 3 sheds some light on the extent to which countries depend on
older individuals staying active in the labour force. Georgia, the Republic of Korea and Ecuador have the
highest proportion of persons aged 70 years and over who are working; for many of these individuals, this
is likely a means of achieving income security in old age. At older ages, however, women exit the labour
market relatively earlier and at a larger scale than men. One exception is Brazil, which, since 2007, has ex-
perienced a decline in labour force participation among persons aged 55 years and above. Over the past
decade, major improvements in social pension coverage and healthcare, combined with strong economic
growth, are widely credited with reducing poverty among millions of Brazilians, including older persons,
which is linked to a reduction in old-age work (Guedes et al. 2019).
Five countries stand out for their high gender disparities in labour force participation. India, Tunisia,
Bangladesh, Sri Lanka and Turkey have the highest proportions of women who remain outside the labour
market for all age brackets. In Tunisia, there is also a sharp decrease in male labour participation after the
age of 55; in combination with the low rate of labour force participation among women, this explains in
great part why Tunisia ranks highest for EbDR. India presents one of the lowest labour force participation
rates for women, combined with a gradual exit from the labour market among older men.
The speed with which older workers transition into effective retirement influences the EbDR in a country.
Some countries with stronger pension systems, such as Slovakia, Croatia and the Russian Federation, reg-
ister a sharp decline in labour force participation among persons aged 60 and over, while other countries,
such as Indonesia, Georgia and El Salvador, experience slower transitions into retirement. A visual rep-
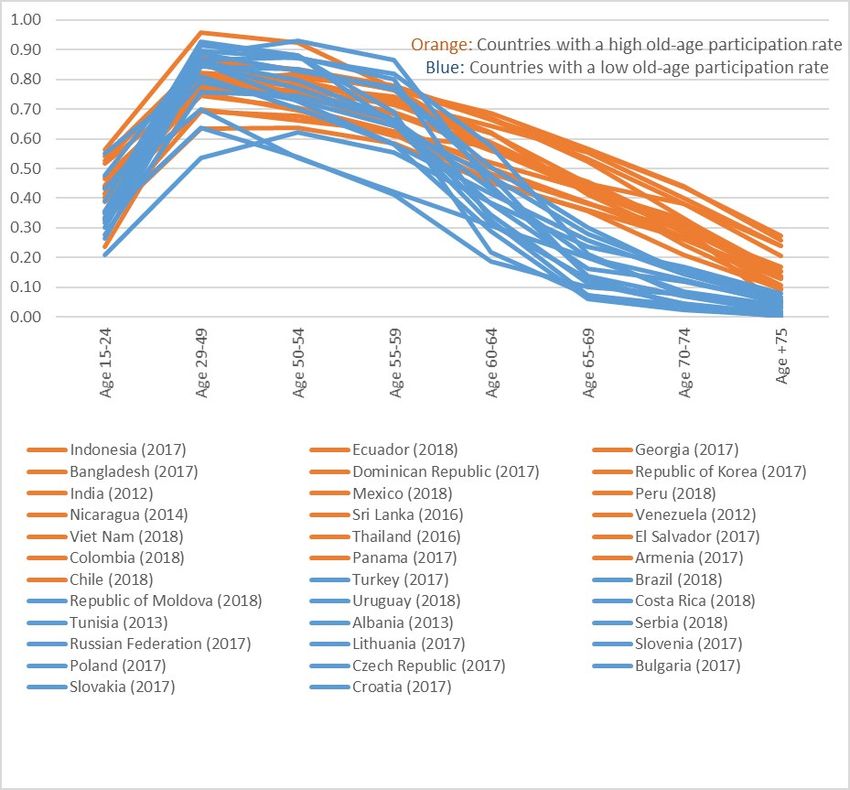
resentation of the two types of countries is shown in Figure 4. Nearly all of the countries with a sharp fall in
labour force participation after ages 55–59 (shown in blue) also have high levels of effective old-age social
protection coverage. With the exception of Tunisia and Turkey, the rapid exit from the labour market coin-
cides with a wider-reaching pension system.13 ILO Working Paper 34
However, several countries with a high level of effective old-age social security coverage also exhibit high
levels of old-age labour force participation, such as Chile, Georgia, the Republic of Korea and Thailand.
While cultural factors may be part of the reason for this, the inadequacy of pension benefits may also mo-
tivate older workers to remain in work longer. All of these countries spend less than 5 per cent of GDP on
social protection.
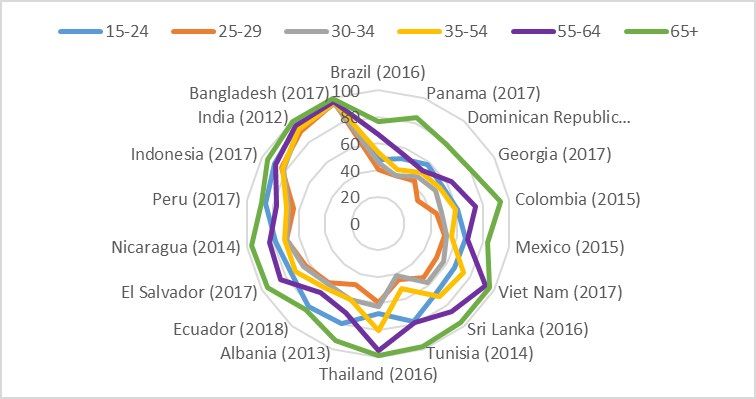
With regard to employment quality, near-old and old-age workers are over-represented in informal em-
ployment. This reliance on informal work increases with age and is higher among older women as a pro-
portion of total employment among older persons. Figures 5.a, b, c and d show the steady increase in the
rate of informal employment as people reach and pass retirement age. While the average informal employ-
ment rate is 45 per cent for workers aged 35–54 years, it rises to 53 per cent for workers aged 55–64 years,
jumping to 70 per cent for those aged 65 years and above. This shift to informal work is found even in the
countries that have a relatively low reliance on informal employment among the working age population,
which suggests that at least some older workers who remain in the labour market experience a deteriora-
tion in work quality. Even in countries such as Slovakia, Serbia and Uruguay, which have a rate of informal
employment below 20 per cent for workers aged 35–54 years, the informal employment rate is higher than
50 per cent (up to 70 per cent, in the case of Slovakia) for workers aged 65 years and above. For Slovenia,
the informal employment rate jumps from 5 per cent in the middle-age group to more than 30 per cent in
the old-age group, and in the Republic of Korea it jumps from 26 per cent to 82 per cent.
The shift to informal employment during older age also is more pronounced for women who remain in
work. On average, the informal employment rate is 4 percentage points higher among older women than
older men. While there are wide disparities between countries, in 26 of the 35 countries studied the rate of
informal employment is higher among older women than older men.
Policies differ between the countries studied with regard to retirement and pensions. Most maintain an
official retirement age, which differs for men and women in half the countries, with official retirement for
women set at a younger age. Twelve countries have a retirement age of below 60 years for women; only
three countries (Bangladesh, Indonesia and Sri Lanka) have a retirement age below 60 years for men. (See
Table 3.) When it comes to effective retirement, the labour force participation rate among men aged 60
years and above is 58 per cent in Bangladesh, 65 per cent in Indonesia and 48 per cent in Sri Lanka, plac-
ing them in the upper rankings in terms of old-age active labour participation.
With regard to the rate of effective old-age coverage through pension schemes (namely, the proportion of
the population of at least statutory retirement age that benefits from a pension scheme), 14 of the 35 coun-
tries have achieved effective coverage for less than half of their old-age population, with the Dominican
Republic, El Salvador, Indonesia and Peru providing effective coverage to less than 20 per cent. In contrast,
15 of the 35 countries provide effective coverage to more than 75 per cent of the old-age population. When
comparing public expenditure on old-age social protection (excluding healthcare), countries’ expenditure as
a proportion of GDP ranges from as low as 0.1 per cent in Bangladesh to as high as 12.7 per cent in Serbia.
There is, as expected, an important association between old-age social protection expenditure, effective so-
cial protection coverage and labour force participation. The countries with effective coverage rates of more
than 75 per cent of their population have a lower rate of old-age labour force participation. Eleven coutries
present a sharp decrease in old-age labour force participation rates after retirement age. (See Figure 4.)14 ILO Working Paper 34
XX Figure 1. Employment-based economic dependency (EbDR) by country
Source: Own elaboration based on ILO (n.d.).15 ILO Working Paper 34
XX Figure 2. Gender gap in EbDR16 ILO Working Paper 34
XX Figure 3. Change in EbDR if persons aged 70+ cease working
Source: Own elaboration based on ILO (n.d.).17 ILO Working Paper 34
XX Figure 4. Labour force participation rate by age group
Source: Own elaboration based on ILO (n.d.).XX Figure 5. Informal employment rate by age group (most recent data)
18
XX 5.a. Men: Countries with a low rate of infor- XX 5.b. Men: Countries with a high rate of infor-
mal employment mal employment
ILO Working Paper 34
XX 5.c. Women: Countries with a low rate of in- XX 5.d. Women: Countries with a high rate of in-
formal employment formal employment
Source: Own elaboration based on ILO (n.d.).19 ILO Working Paper 34
XX Table 3. Key demographic and social protection indicators
Country Retirement Effective Social protection expenditure Life
age old-age as a proportion of GDP expectancy
coverage at birth
(%) (2010–2015)
M F Including Older
healthcare persons,
excluding
healthcare
Albania 65 60 77.0 11.9% 7.5% 77.49
Armenia 63 63 68.5 7.6% 5.6% 73.99
Bangladesh 59 59 33.4 1.7% 0.1% 70.79
Brazil 65 60 78.3 18.3% 9.6% 74.34
Bulgaria 64 61 100.0 18.5% 8.9% 74.25
Chile 65 60 78.6 15.3% 3.0% 79.29
Colombia 62 57 51.7 14.1% 3.8% 75.99
Costa Rica 65 65 68.8 13.6% 5.7% 79.16
Croatia 65 61 57.6 21.6% 9.3% 77.45
Czechia 63 58 100.0 19.5% 8.9% 78.16
Dominican Republic 60 60 11.1 6.4% 0.9% 72.62
Ecuador 60 60 52.0 7.8% 0.2% 75.59
El Salvador 60 55 18.1 11.6% 1.1% 71.82
Georgia 65 60 91.9 10.6% 4.4% 72.31
India 60 60 24.1 2.7% 4.3% 67.77
Indonesia 58 58 14.0 1.1% 1.0% 70.01
Lithuania 63 61 100.0 14.7% 6.6% 73.99
Mexico 65 65 25.2 12.0% 1.7% 74.94
Nicaragua 60 60 23.7 6.3% 1.6% 73.10
Panama 62 57 37.3 9.8% 2.7% 77.29
Peru 60 60 19.3 5.5% 2.5% 75.11
Poland 65 60 100.0 19.4% 10.4% 77.15
Republic of Korea 61 61 77.6 10.1% 2.7% 81.27
Republic of Moldova 62 57 75.2 18.1% 7.5% 70.97
Russian Federation 61 56 91.2 15.6% 8.7% 70.27
Serbia 65 60 46.1 23.4% 12.7% 74.75
Slovakia 62 62 100.0 19.4% 7.5% 76.23
Slovenia 64 64 100.0 22.4% 12.0% 80.14
Sri Lanka 55 55 25.2 6.5% 1.4% 75.89
Thailand 60 60 83.0 3.7% 2.2% 75.18
Tunisia 62 62 33.8 10.4% 5.2% 75.45
Turkey 60 58 20.0 13.5% 8.3% 75.59
Uruguay 60 60 76.5 17.0% 8.9% 77.05
Bolivarian Republic of Venezuela 60 55 59.4 8.8% 7.4% 73.07
Viet Nam 60 55 39.9 6.3% 5.5% 74.9620 ILO Working Paper 34
Note: For effective old-age coverage, the most recent year for which data were available was 2015, with the exception of:
Thailand (2016); Czechia, Lithuania, Poland, Slovakia, Slovenia and Turkey (2014); Bolivarian Republic of Venezuela (2012);
Albania, India, Nicaragua and Uruguay (2011); Croatia, Republic of Korea and Serbia (2010); Dominican Republic, El Salvador
and Mexico (2009); and Panama (2008). For social protection expenditure including healthcare expenditure, the most re-
cent year for which data were available was 2015, with the exception of: Bangladesh, Bulgaria, Croatia, Dominican Republic,
Ecuador, India, Lithuania, Serbia and Turkey (2014); Tunisia (2011); and Nicaragua (2005). For social protection expendi-
ture for older people, the most recent year for which data were available was 2015, with the exception of: Republic of Korea,
Bulgaria, Croatia and Lithuania (2014); Czechia, Slovakia, Slovenia, Sri Lanka and Turkey (2013); Poland and Ecuador (2012);
India (2011); Peru (2010); and Nicaragua (2009).
Source: ILO (2017: 75–99); UNDESA (2019).
2.2 Multivariate results
A descriptive analysis of selected indicators points to the complexity of the issues that influence old-age
income security. For the purpose of simplicity, factor analysis was applied to all three sets of indicators to
identify correlating dimensions for social preparedness, distributional vulnerability and gender inequality
in countries with ageing populations. The results identified underlying factors which might have remained
hidden if only observable or single indicators were considered, or if all indicators were combined into a
single factor analysis. Factor analysis is a means of modelling the correlation matrix using a lower number
of variables, known as “factors”.
As a first step, the correlations between variables were checked to include only variables with at least one
correlation coefficient of an absolute value of at least 0.3 (Kinnear and Gray 1994). Using normalized data,
the correlated variables were initially used to perform a principal component analysis in order to identify,
through the eigenvalues, the number of factors of significance that captured the related underlying rela-
tionships (eigenvalues of at least 1). This was followed by a bounded factor analysis based on initial results,
in addition to orthogonal factor rotation. The overall Kaiser-Meyer-Olkin value was used to measure the
sampling adequacy of the factors retained, with 0.5 as the designated threshold. The results and their in-
terpretation are presented below.
2.2.1 Social preparedness for old-age income security
Nine socio-economic indicators were used as input variables for factor analysis with the aim of identifying
underlying dimensions of preparedness in the provision of old-age income security. Table 4 shows the cor-
relation matrix between these variables, and Table 5 summarizes the two significant factors and the asso-
ciated factor loadings assigned to each factor based on these correlations. Only two factors registered ei-
genvalues of at least 1: the first factor accounts for 55 per cent of variance and the second for 41 per cent.
The interpretation of factors is essentially a qualitative process, based on identifying which variables load
strongly on each factor. The first factor is positively related to the proportion of the population that is effec-
tively covered by contributory or non-contributory pensions and to the proportion of the population that
contributes to pension coverage, as well as to life expectancy and GDP per capita. This could be interpret-
ed as capturing diverse aspects associated with the relative standard of living in a country, including the
extent of formality in employment and of pension eligibility and coverage. Indeed, almost all the countries
with higher factor values are identified in Figure 4 as having a more rapid reduction in the labour partici-
pation rate after the age of 55.
Differences in GDP per capita and life expectancy are also associated with differences in relative standards
of living. The first factor also considers the level of social protection expenditure as a proportion of GDP, the
labour force participation rate among individuals ages 65 and above and the level of public expenditure on
the population aged 65 and above. It therefore includes a broader perspective of living conditions that goes
beyond economic wealth. In this study, this factor is therefore referred to as the “social standard of living”.21 ILO Working Paper 34
The second factor has a high positive factor loading for the EbDR indicator, denoting that it is associated
with having a relatively high proportion of the population that is not in work. This could suggest that ade-
quate forms of social protection are in place to make not working feasible for individuals. This factor’s pos-
itive relationship with the level of social protection expenditure as a proportion of GDP and with the level of
public expenditure on the population aged 65 and above further points to the adequacy of social protection.
This factor negatively correlates with labour force participation among near-old (55 to 64 years) and old-
age (65 to 74 years) groups. It appears to capture relative differences in the effectiveness of social protec-
tion for older persons who tend to work less at advanced ages, and it is negatively associated with work at
older ages. For the purposes of this study, this factor is therefore referred to as “old-age social protection”.
By plotting the two factor scores for the countries in the study (Figure 6), it is possible to identify four quad-
rants of relative social preparedness. The countries that are mapped onto the two right-hand quadrants
register a higher level of relative wealth and investment in social standards of living, and those in the top
two quadrants register relatively high scores with regard to social protection in old age. Those in the top
right quadrant are considered to be the most well prepared with regard to old-age income security, while
those in the lower left quadrant are the least prepared.
XX Table 4. Correlation matrix of social preparedness indicators
EbDR Life Effective Active Tot socpro Old socpro LFP LFP GDPpc
exp coverage contributors expenditure expenditure 55–64 64–74
EbDR 1.000 - - - - - - - -
Life exp -0.002 1.000 - - - - - - -
Effective 0.055 0.378 1.000 - - - - - -
coverage
Active 0.169 0.619 0.775 1.000 - - - - -
contributors
Tot socpro 0.382 0.446 0.615 0.756 1.000 - - - -
expenditure
Old socpro 0.416 0.250 0.597 0.636 0.821 1.000 - - -
expenditure
LFP 55–64 -0.749 0.033 0.066 -0.171 -0.399 -0.497 1.000 - -
LFP 64–74 -0.573 -0.256 -0.496 -0.697 -0.756 -0.804 0.691 1.000 -
GDPpc -0.193 0.679 0.572 0.758 0.522 0.390 0.061 -0.354 1.000
Variable Description
EbDR Employment-based economic dependency ratio
Life exp Life expectancy at birth
Effective coverage Old-age effective pension system coverage
Active contributors Active contributors to a pension scheme among the working-age population
Tot socpro expenditure Total social protection expenditure including healthcare (percentage of GDP)
Old socpro expenditure Public social protection expenditure on older persons (percentage of GDP, without
healthcare)
LFP 55–64 Labour force participation among persons aged 55–64 years
LFP 64–74 Labour force participation among persons aged 65–74 years
GDPpc GDP per capita22 ILO Working Paper 34
XX Table 5. Orthogonal varimax rotation factor matrix for preparedness
Factor analysis/correlation Method: principal factors
Rotation: orthogonal varimax
Factor Variance Difference Proportion Cumulative
Factor 1 3.72691 0.94277 0.5502 0.5502
Factor 2 2.78414 - 0.411 0.9612
LR test: independent vs saturated: chi2(36) = 261.47 Prob>chi2 = 0.000
Rotated factor loadings (pattern matrix) and unique variances
Variable Factor 1 Factor 2 Uniqueness
EbDR - 0.7846 0.3828
Life exp 0.6653 - 0.5533
Effective coverage 0.7916 - 0.3638
Active contributors 0.9195 - 0.0971
Tot socpro expenditure 0.7107 0.5239 0.2204
Old socpro expenditure 0.5747 0.6344 0.2556
LFP 55–64 - -0.8917 0.2014
LFP 64–74 -0.5159 -0.7847 0.1181
GDPpc 0.8331 - 0.296423 ILO Working Paper 34
XX Figure 6. Scoreplot for social preparedness
2.2.2 Distributional vulnerability to old-age income insecurity
Seven indicators were used as inputs in the factor analysis to capture the relative distributional vulnerabil-
ities of countries to old-age income security. Correlations between variables are shown in Table 6. A high
correlation is noted between agricultural work and unpaid family work. Factor analysis was applied, which
resulted in two factors with an eigenvalue greater than 1. A rotated factor solution, shown below (Table 7),
associates the first factor with 67.2 per cent of the variable error and the second factor with 36.2 per cent.
Based on positive loadings associated with five explanatory variables, the first factor appears to capture
aspects of vulnerable employment associated with informality, agricultural work and unpaid family work,
as well as the relative proportion of the workforce under the age of 25 that is neither working nor in school.
This factor is therefore referred to as “vulnerable employment”.
The second factor registers a positive association with measures of poverty, income inequality, a popula-
tion aged 75 and above that is still in work, and informal employment, thereby capturing these dimensions
of vulnerability. This factor is therefore referred to as “inequality/poverty”. As shown in Table 7, the Gini
coefficient and the rate of labour force participation among persons aged 75 and over are the two main
weighted variables, followed by the poverty rate.
Figure 6 plots the relative factor scores for vulnerability. The countries that are mapped onto the lower two
quadrants register relatively higher levels of inequality and have greater segments of the population liv-
ing in poverty, and those in the left two quadrants register higher vulnerable employment or low-quality
work. Countries that fall into the lower left quadrant face the highest distributional vulnerability to old-age
income insecurity, while those in the top right quadrant face the lowest.24 ILO Working Paper 34
XX Table 6. Correlation matrix of old-age distributional vulnerability indicators
Poverty Gini NEET Family LFP >75 Agri work Informal
work emp
Poverty 1.000 - - - - - -
Gini 0.406 1.000 - - - - -
NEET 0.222 0.167 1.000 - - - -
Family work -0.104 -0.137 0.465 1.000 - - -
LFP >75 0.316 0.424 0.239 0.329 1.000 - -
Agri work -0.073 -0.089 0.580 0.847 0.425 1.000 -
Informal emp 0.113 0.320 0.521 0.590 0.619 0.740 1.000
Variable Description
Poverty Poverty headcount ratio at national poverty lines (percentage of population)
Gini Gini coefficient
NEET Proportion of young persons not in employment or education
Family work Proportion of persons engaged in unpaid contributory family work
LFP >75 Labour force participation among persons aged over 75
Agri work Proportion of workers in the agricultural sector
Informal emp Informal employment
XX Table 7. Orthogonal varimax rotation factor matrix for old-age distributional vulnerability
Factor analysis/correlation Method: principal factors
Rotation: orthogonal varimax
Factor Variance Difference Proportion Cumulative
Factor 1 2.70203 1.24733 0.672 0.6723
Factor 2 1.4547 - 0.362 1.0343
LR test: independent vs saturated: chi2(21) = 125.14 Prob>chi2 = 0.000
Rotated factor loadings (pattern matrix) and unique variances
Variable Factor 1 Factor 2 Uniqueness
Poverty - 0.546 0.6969
Gini - 0.7187 0.4789
NEET 0.5615 - 0.6146
Family work 0.862 - 0.2504
LFP >75 0.4036 0.5987 0.4787
Agri work 0.9593 - 0.0795
Informal emp 0.7423 0.4525 0.244225 ILO Working Paper 34
XX Figure 7. Scoreplot for distributional vulnerability3
2.3 Gender gap in old-age income security
The final dimension of income security in old age that must be considered is the divergence between men
and women. To construct the gender inequality dimension, all gender gap variables were initially consid-
ered. Some were eliminated due to their low correlation coefficients with the rest (You can also read