DEMOGRAPHY, MIGRATION, AND LABOUR MARKET IN QATAR - GULF LABOUR MARKETS AND MIGRATION EXPLANATORY NOTE
←
→
Page content transcription
If your browser does not render page correctly, please read the page content below
Demography, Migration, and Labour Market in Qatar

MIGRATION
POLICY CENTRE

                     Demography, Migration, and
                     Labour Market in Qatar

                Gulf Labour Markets and Migration

                       GLMM - EN - No. 8/2014

                                                        Explanatory Note No. 8/2014

                    explanatory note
Françoise De Bel-Air

      Terms of use : By using any information from Gulf Labour Markets and Migration programme publi-
      cations, the user: (a) acknowledges having read the legal notices concerning copyright, terms of use and
      disclaimers and agrees to comply with them in full; (b) agrees to assure himself/herself whether and to
      what extent copyrights exist on information published by the GLMM prior to using this information;
      (c) agrees not to use information published by GLMM in any way that would result in the infringement
      of existing copyrights; (d) agrees to always follow precisely and fully the citation instructions provided
      by the GLMM. GLMM publications may be copied and distributed only in their entirety and together
      with any copyright statements they may contain, as long as they are properly attributed and used for
      non-commercial, educational, or public policy purposes. Photographs, logos, graphs, tables or any other
      images from the GLMM publications may not be used separately.

      Copyright : © European University Institute (EUI) and Gulf Research Center (GRC), 2014
      All rights reserved. No part of this publication may be reproduced, stored in a retrieval system,
      or transmitted in any form or by any means, electronic, mechanical, photocopying, recording or
      otherwise, without the prior permission of European University Institute and Gulf Research Center.

      Disclaimer : The Gulf Labour Markets and Migration (GLMM) programme cannot be held responsi-
      ble in any way for the correctness and accuracy of the information and data published on its website, on
      paper and in other forms, including the database and its publications. The GLMM strongly encourages
      users to verify the correctness and accuracy of the information and data with the source, which is always
      indicated with the greatest accuracy and detail possible. Any opinions expressed in any GLMM publica-
      tion are those of the author(s) alone and do not necessarily state or reflect the opinions or position of the
      Migration Policy Centre, the European University Institute or the Gulf Research Center.

      Support : The Gulf Labour Markets and Migration Programme receives support from the
      International Migration Initiative (IMI) of the Open Society Foundations (OSF) and
      relies on the institutional resources of the GLMM partners.

2     Gulf Labour Markets and Migration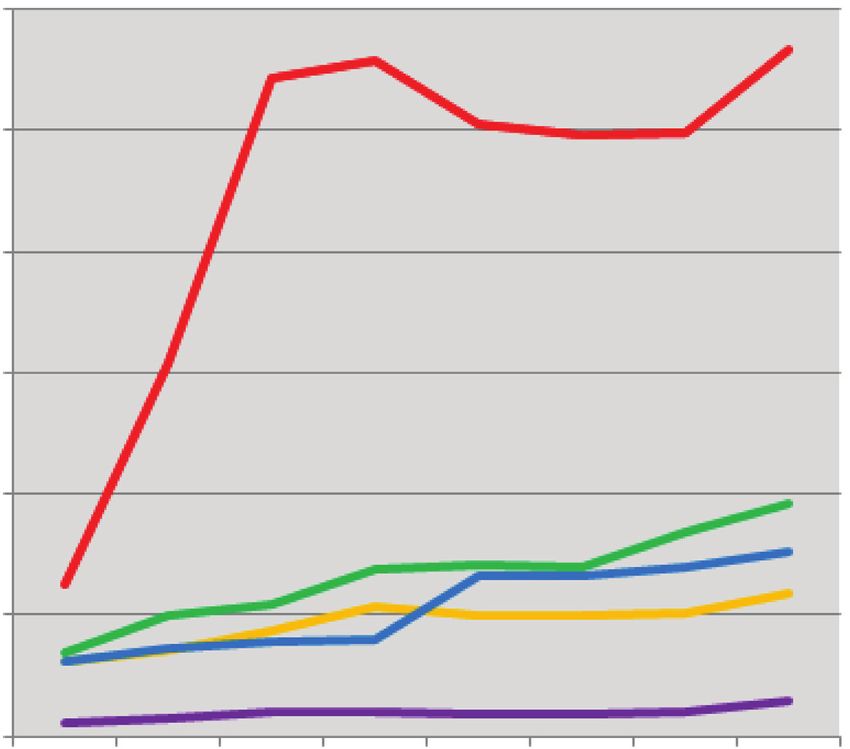
Demography, Migration, and Labour Market in Qatar

              Demography, Migration, and Labour Market
                             in Qatar

                                               Françoise De Bel-Air

          Abstract: In 2013, Qatar ranked second worldwide in terms of per capita GDP. This is due to its
          huge endowment in hydrocarbons and the small size of its national population, the smallest in all GCC
          countries. Exploiting the resources and channeling them into ambitious development policies required
          massive imports of foreign labour. The country’s total population has quintupled since the mid-1980s;
          moreover, foreign nationals made an estimated 85.7 per cent of all residents and up to 94.1 per cent of
          all employed population in 2013. The awarding of the 2022 FIFA World Cup to Qatar in December
          2010 turned the spotlight on the country’s dilemma regarding the “number vs. rights trade-off ” issue:
          Qatar has one of the most constraining kafala systems in the region. Paradoxically, however, demo-
          graphic data also indicate that a growing share of foreigners live with their families, give birth in the
          country, and intermarry with Qataris. The strict separation between nationals and migrants could thus
          start slowly eroding.

          Keywords: Qatar; Foreign Population; National Population; Nationals and Foreign Labour;
          Migration Policy; Statistics; Labour Camp; Human Rights; Sponsorship; Family Reunification;
          Second Generation.

I
    n 2013, Qatar ranked second worldwide in terms of per capita GDP, with about $100,000 per resi-
    dent annually. This is due, first, to its huge endowment in hydrocarbons: the country has the third
    largest natural gas reserves worldwide as well as sizable oil reserves; it is also the top producer and ex-
porter of liquefied natural gas (LNG) in the world. Second, reaching such a level of individual wealth is
actually made possible by the modest size of the country’s national population, the smallest in the GCC.
      When the exploitation of Qatari oil fields started in 1949, the country had hardly 16,000 inhabit-
ants, down from about 27,000 as recorded half a century earlier in 1908.1 The collapse of the traditional

                                                                                                 Explanatory Note No. 8/2014   3
Françoise De Bel-Air

      economy based on pearl trade in the 1920s, and economic and political tensions with Bahrain in the
      1930s had dispersed Qatar’s elusive and mobile population– local semi-nomad and nomad Bedouin
      groups, fishermen, merchant families with slaves, and a few thousand of Persian origin, some of them
      Shiites and the others Sunni Arabs (the hawla). Qatar’s ruling family and the British Protectorate au-
      thorities who set up the oil sector resorted to importing workers from the Indian subcontinent and from
      the Arab Middle East, due to the local manpower’s low level of literacy and industrial skills. In 1970,
      shortly before Qatar gained independence (1971), the first census was conducted. It estimated the total
      population at 111,113, of which 45,039 were Qataris and 66,094 foreigners. This was the first and last
      time that population estimates for nationals and non-nationals would be disclosed in the country.
            Indeed, the small size of the national population, even if it has been expanded to include some
      naturalised families from Iran and the Arab Middle East, is considered a great challenge in Qatar. It can
      be argued that the oil rent guaranteed each of the few Qatari citizens a high standard of living, protection
      and security such as free health care, housing grants, subsidised utilities and education to university level.
      Expenditure per student in education, for example, was one of the highest in the world in the 2010s2 and
      Qatar stands high in the Human Development Index rankings (0.834, the top one in the Arab region,
      and ranked 36 worldwide in 2013). However, fulfilling the rulers’ ambitions to modernise the country’s
      institutions and infrastructure to a world-class level, and more generally, investing the huge hydrocarbon
      revenues requires equally huge numbers of foreign manpower, too large to ever be fully replaced by the
      small numbers of Qataris. Therefore, in the view of many Qatari citizens, the high population imbal-
      ance is not so much a blessing (many foreign workers cater for the needs of the few nationals) as a curse
      (Qatari identity, constructed after independence, is under considerable strain).3
            This dilemma has deepened since 2003. The increase in hydrocarbon prices spurred a hike in pro-
      duction and attracted growing amounts of FDI into the country until the 2008 financial crisis. Qatar’s
      economic growth rate shot up to 15 per cent yearly during the period,4 as infrastructure investments
      boomed (for example, in real estate, tourism, and education). Immigration rates, at the same time, rose
      tremendously, especially that of low-skilled, Asian construction workers. The awarding of the 2022 FIFA
      World Cup to Qatar in December 2010 and the debates surrounding this event which pointed at abuses
      of unskilled foreign labourers5 on the country’s building sites actually underlined Qatar’s dilemma. Qatar
      has one of the most constraining kafala systems in the region and no category of expatriates is exempted
      from Qatari sponsorship.6 And yet, a survey conducted in 2010 showed that citizens felt sponsorship
      laws needed to be even stricter.7 The “number vs. rights trade-off ”8 is indeed at work in Qatar, whereby
      the bigger the expatriate population, and especially “blue collars” among them, the less rights they are
      likely to be granted. Considering that leaving the situation unchanged is not an option in view of the
      tremendous international pressure exerted on Qatar, the country is faced with two choices. The first is to
      limit the numbers while increasing foreign workers’ rights; the second is to sustain high levels of immi-
      gration while at the same time loosening the demographic imbalance between nationals and foreigners,
      through blurring the distinctions of status and identity separating the two parties.
           Until mid-May 2014, the first option seemed to be the favoured policy target. In Qatar’s National
      Vision 2030, the master plan for Qatar’s development planning launched in 2008, two of the five main
      challenges to address were: “Modernisation and the preservation of tradition” and “the size and quality

4     Gulf Labour Markets and Migration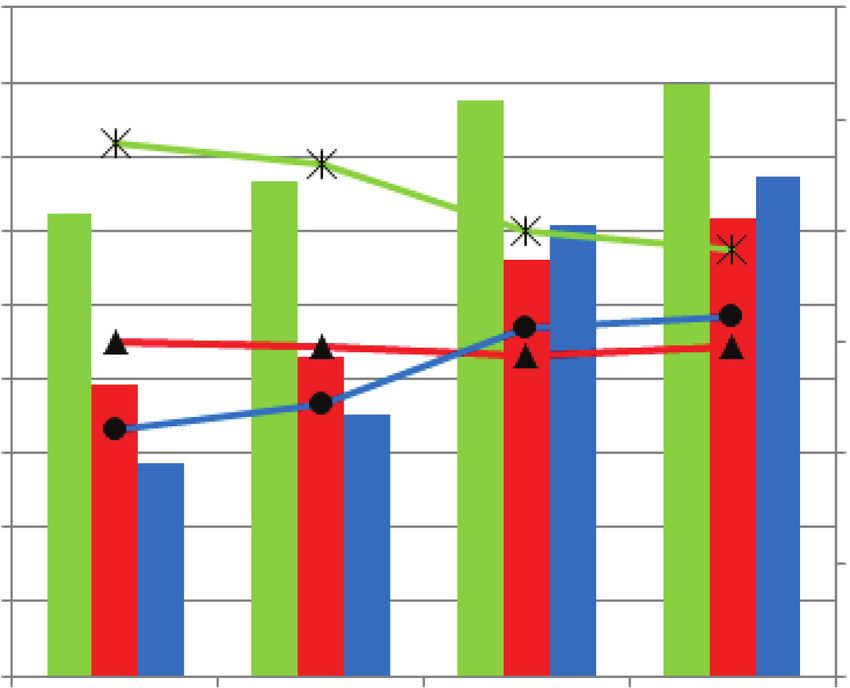
Demography, Migration, and Labour Market in Qatar

of the expatriate labour force and the selected path of development.” Qatar Population Policy passed in
2009 tackles both, first, by promoting higher fertility rates among Qataris and second, through advocat-
ing for “improving recruitment policies in line with a knowledge-based economy” (i.e., limit the recruit-
ment of unskilled labourers and substitute technology to number).9 This seemed in line with official an-
nouncements made for several months, which promised substantial reforms to the country’s labour and
migration policies. It was expected that the sponsorship rule, which conditions exit from the territory
and change of employer to the sponsor’s consent, would undergo substantial revisions or even be can-
celled altogether. However, decisions released on May 14 by the Ministries of Interior and Labour and
Social Affairs enforced more state oversight and regulation of the foreign workers’ exits and professional
mobility but for fixed-term contracts holders only, harsher penalties in case of labour law violations,
and electronic wage payments, for instance.10 The kafala and the exit permits were not abolished as was
hoped. Moreover, such amendments still have to be endorsed by Qatar’s Shura (Advisory) Council, and
no timeline was set for the approval.

Inward Migration

Stocks
As mentioned previously, Qatar’s demographic data conceal figures for total national and non-national
populations. Only aggregated figures for the total resident population (Qataris and non-Qataris to-
gether) are made available, of which the validity cannot be assessed.11 Available data indicate that in
mid-2013, Qatar’s total population stood at 2,003,700, up from an estimated 373,392 in 1986.12 The
country’s population thus more than quintupled in a twenty-seven year span, at an average rate of 6.2
per cent yearly.

            Figure 1: Evolution of Qatar’s population and growth rate (1986-2013)

                                  2,500,000                      20,0

                                                                 18,0

                                  2,000,000                      16,0

                                                                 14,0
                                                                        Annual growth rate (%)

                                  1,500,000                      12,0
               Total population

                                                                                                 females
                                                                 10,0                            males
                                                                                                 total
                                  1,000,000                       8,0
                                                                                                 growth rate total population
                                                                  6,0

                                   500,000                        4,0

                                                                  2,0

                                         0                        0,0
                                              1986
                                              1988
                                              1990
                                              1992
                                              1994
                                              1996
                                              1998
                                              2000
                                              2002
                                              2004
                                              2006
                                              2008
                                              2010
                                              2012

         Source: QSA (Statistical Yearbook, 2014)

                                                                                                     Explanatory Note No. 8/2014   5
Françoise De Bel-Air
Growth rates rose after 2003 to peak at an amazing 17.3 per cent in 2008 and seem to have picked
up again since 2010.13 If accurate, newest data for 2013 may confirm the start of the massive rise in
workers’ recruitment which was forecasted since the awarding of the Football World Cup bid to Qatar.
Moreover, the stocks of males, mostly foreign, in the country had already increased spectacularly over
the period 2003-2008.
Indeed, in 2010, non-Qataris were estimated at 1,456,362 or 85.7 per cent of the total resident
population of 1,699,435, a significant increase from previous decades.14 Between 2004 and 2010, Qatari
population thus grew at a rate of 3.9 per cent. As for non-Qataris, estimates suggest that their rate of
growth reached 14.6 per cent on average over the period, a very high figure.
Figure 2: Qatar’s total population and estimates of the proportion of non-nationals
at census years (1970; 1986; 1997; 2004; 2010)
1,800,000
1,600,000
1,400,000
1,200,000
Total population
1,000,000 Non-Qataris
85.7
Qataris
800,000
600,000
75.9
400,000
71.7
200,000 73.3
59.5
0
1970 1986 1997 2004 2010
Year*
* 1986; 1997; 2004: mid-year population estimate.
Source: GLMM calculations using QSA data.
Qatar’s foreign population is heavily distorted demographically. Men outnumber women by almost
1 to 5 (sex ratio for the population aged 15 and above reached 493 males for 100 women in 2013) and
those in working-age groups (15 to 64 years) made up as much as 90 per cent of foreign nationals in
2010.15 On average, this population is relatively less educated (60 per cent have below secondary level
education) as compared to the Qatari nationals (37 per cent only at similar education levels). At the same
time, 17.8 per cent of non-nationals held a university degree (as compared to 30.9 per cent of Qataris)
in 2012.16
At first sight, Qatar also displays an amazing pattern of spatial segregation of its expatriate popula-
tion: the share of those living in labour camps,17 presumably non-nationals, went markedly up between
6 Gulf Labour Markets and MigrationDemography, Migration, and Labour Market in Qatar
2004 and 2010. By that date 918,150 persons, i.e., more than half of Qatar’s total resident population
and 70 per cent of all resident men alone, actually dwelt in this type of housing. Labour camps host a
relatively young (average age: 34 years) and less educated population than the non-nationals as a whole:
73.5 per cent have a primary school education level or less while 5 per cent hold a university degree.18
Figure 3: Proportion of Qatar’s total population living in labour camps, by sex (1997; 2004; 2010)
80,0
70,0
60,0
% of total population
50,0
males
40,0 females
total
30,0
20,0
10,0
0,0
1997 2004 2010
Source: 1997; 2004; 2010 Censuses, QSA
This emphasises the spectacular levels of economic growth experienced in Qatar over the 2000s,
which gave an impetus to the import of foreign, mostly male, labourers.19 Indeed, non-nationals are large-
ly dominant on Qatar’s labour market. In 2013, out of a total 1,543,265 strong labour force, 1,450,703
were non-nationals. Of those, 1,448,007 were employed, or 94.1 per cent of the total employed popu-
lation, which is higher than in any other GCC state.20 Within the foreign employed population, men
outnumber women by 1 to 8.
Public wealth allows for a large public sector21 in the country, which employs 80.6 per cent of the
working Qataris. By contrast, 78.4 per cent of all employed non-nationals are involved in the private
sector. Non-Qataris make up 99 per cent and 60.8 per cent, respectively, of the private sector and public
sector manpower, due to their overwhelming share in the country’s total workforce.
Non-nationals, in effect, dominate numerically in every occupation level (from 80 per cent of all
managers to 99 per cent of those in unskilled positions). Yet, most remain clustered in the lowest occupa-
tion categories (“craft and related trade workers” to “elementary occupations” account for 72 per cent of
the non-nationals). Among Qataris, 81 per cent are in “white collar” positions, from managers to clerks.22
Explanatory Note No. 8/2014 7Françoise De Bel-Air
Figure 4: Foreign labourers by activity (Qatar, 2006-2013, selected activities)
600,000
500,000
Number of workers in the sector
400,000 Manufacturing
Construction
Wholesale and
retail trade
300,000
Education
Domestic services
200,000
100,000
0
2006 2007 2008 2009 2010 2011 2012 2013
Year
Source: Labour Force Surveys, 2006 to 2013 and Population Census 2010.
As regards activity sectors, 54 per cent of Qataris, males and females, work in “public administra-
tion”; besides, many of the female citizens are employed in education. For expatriates, the construction
sector stands out by far as the main employer. In 2006, 125,000 workers were recorded in that sector, a
quarter of all employed foreign nationals. Three years later, in 2009, recruitment in this activity had more
than quadrupled and was peaking at 558,000 workers, or 47 per cent of the total foreign workforce. In
2013, the sector still employed 39.2 per cent of all foreign labourers23 and, as shown in the graph, started
gaining in absolute size, probably a sign of the construction fever ahead of the 2022 World Cup. Work-
ers in domestic labour, in retail trade, and in education also more than doubled their numbers during the
years 2006-2013.
It is worth mentioning that females display a more contrasted employment pattern than males.
Most non-national females (58.6 per cent) are recorded in the domestic sector, but the governmental
sector also employs 14 per cent of them. Thirty per cent of female expatriates are in “white collar” oc-
cupations, in the education and health sectors (10.4 and 7 per cent), as well as in public administration,
retail trade, and transportation.
In Qatar, like in the other GCC states, foreign manpower is mainly recruited in Asia. As Table 1
shows, four of the major suppliers of manpower to the country (India, Nepal, the Philippines and Bang-
ladesh), with 1,088,556 workers as of September 30, 2013, made up about three quarters of the foreign
workforce.24 Indians, like elsewhere in the GCC, made the bulk of all expatriate labourers – 31.2 per cent
of all employed non-nationals– with the Nepalese close behind. Arabs workers25 accounted for no more
8 Gulf Labour Markets and MigrationDemography, Migration, and Labour Market in Qatar
than 10 per cent of the total.26 Among them, Egyptians alone account for a half but make up 5 per cent
only of all foreign labourers.
Table 1: Foreign workers in Qatar by country of citizenship
(selected nationalities, 2013)
Country / region of
citizenship Workers %
India 452,578 31.2
Nepal 339,901 23.5
Philippines 165,447 11.4
Bangladesh 130,630 9.0
Arab countries 146,577 10.1
of which Egypt 72,487 5.0
Syria 18,474 1.3
Sudan 14,147 1.0
Lebanon 10,222 0.7
Jordan 8,341 0.6
Palestine 4,312 0.3
Total employed
population 2013 (Q.4) 1,449,234 100
Sources:
Asian countries: Qatar National Human Rights Committee (NHRC) estimates as of September 30,
2013 published in Al-Raya Newspaper, October 1, 2013.
http://gulfmigration.eu/estimates-of-non-nationals-by-country-of-citizenship-and-migration-status-
selescted-nationalities-qatar-26-30092013/
Arab countries: Qatar Ministry of Labour data for August 2013, Zahra Babar, “Working for the
Neighbours: Arab Migrants in Qatar”, paper presented at the Arab Migrant Communities in the
GCC Working Group Conference, Centre for International and Regional Studies (CIRS), School of
Foreign Service in Qatar, Georgetown University, Doha, Qatar, March 15 - 16, 2014.
Total non-Qatari employed population 2013 (Q.4): QSA Labour Force Survey 2013, Fourth Quar-
ter (Oct. – Dec. 2013)
Since the boom years of the 2000s, and even more so since the country was awarded the hosting of
the 2022 World Cup, international public attention has been drawn, for obvious reasons, towards Qatar’s
massive expatriate groups of mostly Asian, low-skilled, single male workers in labour camps. Yet, does
this national, occupational, and spatial clustering of foreign residents mean that Qatar is only a place for
temporary, labour-bound sojourn? Indeed, the proportion of inactive (i.e., family dependents) among
Explanatory Note No. 8/2014 9Françoise De Bel-Air
non-Qataris decreased over the years: from 16 per cent of all foreign residents in 2004 down to 8 per cent
in 2009, at the peak of economic growth and recruitment in the construction sector. In 2010, moreover,
half of the non-Qataris surveyed in the census had been residing in the country for only two years and
less. Another third had spent five years and more in Qatar, and 8.4 per cent of non-nationals had been
residents for 15 years and more.27
Table 2: Non-nationals in Qatar by migration status and country/region of citizenship
(selected nationalities, 2013)
Workers Family dependents
Country/region numbers % numbers % Total
India 452,578 83.1 92.224 16.9 544,802
Nepal 339,901 99.8 778 0.2 340,679
Philippines 165,447 89.6 19,201 10.4 184,648
Bangladesh 130,630 95.2 6,615 4.8 137,245
Arab countries 146,577 52.0 135,229 48.0 281,806
Sources:
Asian countries: Qatar National Human Rights Committee (NHRC) estimates as of September 30,
2013 published in Al-Raya Newspaper, October 1, 2013
http://gulfmigration.eu/estimates-of-non-nationals-by-country-of-citizenship-and-migration-status-
selected-nationalities-qatar-26-
Arab countries: Qatar Ministry of Labour data for August 2013,
Zahra Babar, “Working for the Neighbours: Arab Migrants in Qatar”, paper presented at the conference
of the Arab Migrant Communities in the GCC Working Group, School of Foreign Service in Qatar,
Centre for International and Regional Studies (CIRS), Georgetown University, Doha, Qatar,
March 15-16, 2014.
As it appears, the nationality or regional origin factor plays an essential role in defining the condi-
tions of stay in Qatar. Nepalese and Bangladeshis are quasi-exclusively workers, thus clustered to the
lowest tier of the occupation and income ladder (and presumably housed mostly in labour compounds).
On the opposite end,28 half of resident Arab nationals are family dependents. In Qatar, a minimum sal-
ary of QR10,000 and a certified rent contract in the worker’s name condition the possibility for a worker
to sponsor his family members as dependents.29 The large amount of dependents among the Arab resi-
dents as a whole, thus, suggests that most of them perform skilled and highly-skilled, well-paid activities.
Up to 92,220 Indian expatriates (17 per cent of this national group), are also classified as dependents,
which means that this very large community comprises a diversity of skill levels and occupation profiles.
Moreover, the likelihood of some non-nationals in the highly-skilled and upper-income brackets
settling, at least for some time, with their family in Qatar is first confirmed by the proportional increase
in female expatriates classified as “house makers,” a category of the inactive foreign population. Indeed,
this can be taken as a proxy to assess the relative share of foreign households within all families (Qatari
10 Gulf Labour Markets and MigrationDemography, Migration, and Labour Market in Qatar
and non-Qatari) residing in the country, hence roughly indicating the scale of family reunification.30
For twenty years,31 indeed, foreign housewives accounted steadily for half of the total; yet their share in-
creased throughout the 2000s to finally reach 75 per cent of all housewives in 2012-2013. Among these,
most were Arabs (63 per cent).32
The increase in the number of non-Qatari school students since 2003 also confirms this growing
trend towards family reunification. As compared to Qatari pupils’ population, the “other nationalities”
(Asians as well as Westerners) gained in number and in relative share, while the Arab students also in-
creased in number but remained steady at 30 per cent of the total during the decade.33 It is interesting
to note that as early as 2003-2004, before the hike in recruitment of foreign labourers, all foreign school
students were already outnumbering Qatari students.34
Figure 5: School children in Qatar by nationality group, in numbers and in
proportion of total (2003-2012, available years)
90,000 60,0
80,000
50,0 Qataris
70,000
number of students (bars)
Arabs
% of all students (lines)
60,000 40,0
Other
50,000
nationalities
30,0
40,000 Qataris
30,000 20,0 Arabs
20,000
Other
10,0 nationalities
10,000
- -
2003/2004 2005/2006 2010/2011 2011/2012
Academic year
Sources: Annual Statistical Abstracts, Ministry of Education/Supreme Education Council (2003 - 2012)
This suggests that parallel to the massive hiring of low-skilled workers for turnkey construction
projects, Qatar had also started pursuing a policy of upgrading its workforce by attracting highly-skilled
manpower, in line with the objectives defined for Qatar National Vision.
Flows
In Qatar, the Ministry of Interior’s data on residency permits are not made available to the public in
yearly statistical publications, and the Ministry of Labour and Social Affairs does not disclose records
of labour permits granted by occupation level. It is, therefore, impossible to assess the hypothesis that,
parallel to the recruitment of unskilled labourers, an upgrading of the workforce did bring into Qatar
highly-skilled personnel and their families.
Explanatory Note No. 8/2014 11Françoise De Bel-Air
The distribution of students in schools by nationality group, nonetheless, suggested that non-Qatari
pupils (Arab and other expatriates) had already outnumbered Qataris in the same age groups. The dis-
tribution of births by nationality group of child35 confirms the assertion that inflows of Arab and Asian
newborns, after nosediving during the 1990s in the aftermath of the First Gulf War, rose steadily from
the beginning of the 2000s alongside the growing stocks of foreign residents. As of 2011 (last year avail-
able), Qataris made only 36.8 per cent of all newborns in the country.
Figure 6: Registered live births by nationality group of child (1981-2011)
9,000 60
8,000
50
7,000
Qataris
6,000 40
GCC Arabs
Registered live births
% of Qatari births
5,000 Non-GCC
Arabs
30
4,000 Asians
Others
3,000 20
% of Qatari
births in total
2,000
10
1,000
0 0
81 83 85 87 89 91 93 95 97 99 01 03 05 07 09 11
19 19 19 19 19 19 19 19 19 19 20 20 20 20 20 20
Source: Bulletin of Vital Statistics, QSA.
Interestingly, this may also imply that Qatar is increasingly becoming a multicultural society, which
includes infants born not only to wealthy, highly-skilled expatriates financially able to sponsor their
inactive family members, but also children born to any legally-residing couple. In effect, article 17 of
law no. 9 of 2004 which regulates expatriates’ entry, departure, residence, and sponsorship matters, states
that “A residence permit may be applied for within sixty days of the date of birth or the date of entering
the country in respect of a child born to an expatriate whose family has obtained residence permits. If
the child was born outside the country and one or both parents have a valid residence permit, the child
shall be permitted to enter the country within two (2) years of its birth.”36 Births on Qatari territory or
migration of infants thus should contribute to diversifying non-Qatari resident population in terms of
occupation level (workers of every skill level may still be living with their spouse, if the latter came as a
12 Gulf Labour Markets and MigrationDemography, Migration, and Labour Market in Qatar
labourer, thus sponsored individually), and also ethnically, as we have seen that most Asians, in contrary
to Arabs, are active.
Another factor signals the quiet emergence of a demographic diversification in Qatar: the increase
in mixed marriages (i.e., between a Qatari and a foreign spouse) from 8.5 per cent to 13.7 per cent of all
marriages between 2000 and 2011 (last available data).37
Figure 7: Marriages of Qatari men with foreign women (2000-2011)
GCC Others Arabs Asians Others
2010
2008
2006
2004
2002
2000
0.0 5.0 10.0 15.0
% of all mariages
Source: Bulletin of Marriage and Divorce, QSA, given years.
Figure 8: Marriages of Qatari women with foreign men (2000-2011)
GCC Others Arabs Asians Others
2010
2008
2006
2004
2002
2000
0.0 5.0 10.0 15.0
% of all marriages
Source: Bulletin of Marriage and Divorce, QSA, given years.
Explanatory Note No. 8/2014 13Françoise De Bel-Air
Female Qataris marry foreign nationals in higher numbers than male Qataris;38 however, they
most often choose citizens from other GCC states (between 4 and 10 per cent of all female unions).
Male Qataris, by contrast, started turning to non-GCC Arabs and Asians, in modest, yet slightly grow-
ing proportions. Obtaining naturalisation in Qatar is a constraining process for non-nationals: it requires
25 years of continuous presence in the country. However, the foreign spouse of a Qatari male can obtain
citizenship after five years of marriage; similarly, children of a Qatari mother, as well as individuals with
exceptional skills useful to the country, are all granted a priority status in qualifying for naturalisation.39
Rising numbers of highly-skilled residents with family members born on Qatari territory and of mixed
marriages, therefore, could lay the ground for future ethnic diversification and demographic expansion
of the national Qatari population. For the time being, therefore, Qatar’s policy choice does not seem to
be that of a reduction of migration inflows alongwith a significant increase in workers’ rights. It could
be, rather, a very slow and highly selective absorption of some foreign nationals into Qatar’s citizenry.
Sources
Amnesty International. The Dark Side of Migration: Spotlight on Qatar’s Construction Sector Ahead of the
World Cup. London: Amnesty International, 2013.
Babar, Zahra. Free Mobility within the Gulf Cooperation Council. Doha: CIRS, Georgetown University,
2011.
Bertelsmann Stiftung. BTI 2012, Qatar Country Report. Gütersloh: Bertelsmann Stiftung, 2012.
Crystal, Jill. Oil and Politics in the Gulf. Rulers and Merchants in Kuwait and Qatar. Cambridge: CUP,
1990.
Gulf Labour Markets and Migration. Demographic and Economic module of the GLMM Database,
http://gulfmigration.eu/glmm-database/demographic-and-economic-module/.
L’investissement direct étranger au Qatar en 2012, https://www.tresor.economie.gouv.fr/File/395138.
Nagy, Sharon. “Making Room for Migrants, Making Sense of Difference: Spatial and Ideological Ex-
pressions of Social Diversity in Urban Qatar,” Urban Studies 43, 1 ( January 2006): 119-137.
Permanent Population Committee. Qatar Population Status 2012, Three Years after Launching the Popula-
tion Policy. Doha: PPP, October 2012.
Qatari and Gulf Press, partially through: “Gulf in the Media: Gulf Labour Markets and Migration.”
Ruhs, Martin, and Philip Martin, “Numbers vs. Rights: Trade-Offs and Guest-Worker Programs.” In-
ternational Migration Review 42, 1 (Spring 2008): 249-265.
14 Gulf Labour Markets and MigrationDemography, Migration, and Labour Market in Qatar
Endnotes
1. Jill Crystal, Oil and Politics in the Gulf. Rulers and Merchants in Kuwait and Qatar (Cambridge: CUP,
1990), 117.
2. Bertelsmann Stiftung, BTI 2012, Qatar Country Report (Gütersloh: Bertelsmann Stiftung, 2012). The total
number of students being awarded overseas scholarships increased by 61.5 per cent during 2009 and 2010.
3. On internal differentiation amongst the Qatari citizenry, see Sharon Nagy, “Making Room for Migrants,
Making Sense of Difference: Spatial and Ideological Expressions of Social Diversity in Urban Qatar,”
Urban Studies 43, 1 ( January 2006): 119-137.
4. L’investissement direct étranger au Qatar en 2012, https://www.tresor.economie.gouv.fr/File/395138.
5. Amnesty International, The Dark Side of Migration: Spotlight on Qatar’s Construction Sector Ahead of the
World Cup (London: Amnesty International, 2013).
6. In contrast to Bahrain, which (at least on paper) scrapped it altogether, or Saudi Arabia, where foreign
investors do not require Saudi sponsorship since 2000, for example. The UAE also reformed its rule of
conditioning sponsorship change to the obtaining of a non-objection certificate from the worker’s spon-
sor.
7. http://gulfnews.com/news/gulf/qatar/qatari-citizens-want-sponsorship-rules-tightened-further-sur-
vey-1.742530.
8. Martin Ruhs and Philip Martin, “Numbers vs. Rights: Trade-Offs and Guest-Worker Programs,” Inter-
national Migration Review 42, 1 (Spring 2008): 249-265.
9. Permanent Population Committee, Qatar Population Status 2012, Three Years After Launching the Popula-
tion Policy (Doha: PPP, Oct. 2012): 11-13, http://www.gsdp.gov.qa/portal/page/portal/ppc/PPC_home/
ppc_news/ppc_files_upload/populations_status_2012_en.pdf
10. http://dohanews.co/qatar-officials-propose-changes-kafala-system/.
11. Qatar Statistics Authority provides figures disaggregated by nationality (Qataris/non-Qataris) for the
population aged 15 and above only. The UN Statistics Division stated in 2008 that civil registration of
births and deaths in Qatar had reached a coverage rate of 97% in the 1990s: https://www.google.com/ur
l?sa=t&rct=j&q=&esrc=s&source=web&cd=2&cad=rja&uact=8&ved=0CCUQFjAB&url=http%3A%2
F%2Funstats.un.org%2Funsd%2Fvitalstatkb%2FAttachment80.aspx&ei=6PymU5YdyaQ787yBsAY&u
sg=AFQjCNHOywW3issTrFW9qYFnAMUfHXHJ9w. However, other issues can be raised as regards
the quality of population statistics in the country: population and housing census 2004, for instance, was
conducted on the total Qatari population, but only on a sample of the non-Qatari resident population.
Census 2010, however, covered the whole of the resident population.
12. Mid-year population estimates, QSA, Annual Statistical Abstracts.
13. Providing population estimates published before 2010 census were accurate (see note 10), this fall could
be an effect of 2008 financial crisis.
Explanatory Note No. 8/2014 15Françoise De Bel-Air
14. The figures have not been published by QSA which does not release figures of total population disaggre-
gated by nationality as explained earlier, either for the Qatari or for the non-Qatari population. These are
GLMM estimates based on QSA data. See http://gulfmigration.eu/population-by-nationality-qatari-
non-qatari-census-1970-2010/.
15. See above, note 10.
16. Population aged 15 and above, Labour Force Survey 2012, http://gulfmigration.eu/population-aged-
15-and-above-by-nationality-qatari-non-qatari-sex-and-level-of-education-2012/.
17. Labour camp or labour gathering population is defined as follows by the Qatar Statistics Authority: A
group of persons of the same gender usually staying in housing units. They live as a group (collectively)
but there is no relationship between them and they do not form a living household. They are 2 to 6 (small
cluster) or seven or more persons (big clusters) who usually belong to one organization (company, estab-
lishment, etc).
18. http://gulfmigration.eu/qatar-large-and-small-labor-camp-population-15-years-and-above-by-
10-years-age-group-sex-and-educational-level-qatar-2010/.
19. Al Khor area, for example, where as many as 87.4 per cent of all residents are recorded living in labour
camps in 2010 (48 per cent in 1997) is home to many employees of the oil industry http://en.wikipedia.
org/wiki/Al_Khor. To date, in 2014, labour camp dwellers are known to be also construction workers
involved in the many building sites related to the 2022 World Cup.
20. http://gulfmigration.eu/percentage-of-nationals-and-non-nationals-in-employed-population-in-gcc-
countries-national-statistics-latest-year-or-period-available/.
21. Government department, government company, or corporation.
22. The other 19 per cent are distributed between the “services and trade”, “crafts and related trades” and
“elementary occupations” categories.
23. Labour Force Surveys, 2006 to 2013, and Census, 2010. The figures of workers include domestic workers.
24. Other Asian nationalities are also present in Qatar in sizable numbers: Pakistanis, Indonesians, Sri Lan-
kans, and Iranians, for instance.
25. Non-Qatari GCC nationals may not be accounted for in MoL’s figures, which are drawn from labour
permit data. In the GCC countries, the Unified Economic Agreement between the Countries of the Gulf
Cooperation Council (chapter 2, art. 8), guarantees no distinction between nationals and other GCC
countries’ citizens as regards freedom of movement, work and residence, ownership, exercise of economic
activity in every GCC state. See Zahra Babar, Free Mobility within the Gulf Cooperation Council (Doha:
CIRS, Georgetown University, 2011), 3. Therefore, they may be working in Qatar without holding a per-
mit.
26. Apart from probably numerous other Asian nationalities, the remaining 15 per cent of foreign workers
also comprise Europeans, North Americans, Australians and New Zealanders. Non-Arab Africans (espe-
cially from the Horn and Eastern parts of Africa as well as from Ghana) are also present in Qatar.
27. http://gulfmigration.eu/percent-distribution-of-non-qatari-population-by-duration-of-stay-in-qatar-
for-each-municipality-2010/. No data is available on the profile of residents in each category of length of
stay.
16 Gulf Labour Markets and MigrationDemography, Migration, and Labour Market in Qatar
28. Data for Western expatriates are not available.
29. QR10,000 is equivalent to $2,747, or 2005 Euros (May 10, 2014). Obtaining a rent contract and bills
in their name is also difficult for most resident workers, who often have to sub-rent their flat for the real
estate prices are very high in Qatar. http://thepeninsulaqatar.com/news/qatar/219493/getting-family-
visas-tough-for-some-expats.
30. The indicator is imperfect because: a) some females may be also part of a household, while working in
Qatar (sponsored as an individual worker, by a Qatari national or establishment); and b) it assumes that
Qatari family formation process has not changed significantly over the years (increase in age at marriage
or in divorce rates, for instance). However, this remains the only way to estimate the number of foreign
households, which is not published in Qatari statistics.
31. Between 1986 and 2004 censuses.
32. Zahra Babar in her study of Arab immigrants in Qatar quoted MoL’s figure of 50,550 Arab housewives
as part of the 135,229 Arab family dependents recorded in August 2013. However, Arabs might be over-
represented among foreign households, due to their generally low activity rates.
33. Some MoE-SEC’s yearbooks in the decade did not display detailed information on students’ nationality
groups.
34. 67,893, as compared to 62,329 Qatari pupils enrolled (from Kindergarten to secondary level).
35. Unsmoothed curve. Late registered births are not counted in the year of birth, but the year of declaration.
36. http://gulfmigration.eu/law-no-4-of-2009-regulating-the-entry-exit-residence-and-sponsorship-of-
expatriates-2/.
37. Source: Bulletin of Marriage and Divorce, QSA, given years. This is in spite of Law number 21 of 1989
which regulates the marriage of Qataris to foreigners. According to the law, a committee of officials from
different government institutions, including the Ministry of Awqaf, examines applications for such mar-
riages (from male and female citizens) and gives its recommendation to the Ministry of Interior, which
has the final decision. The law makes an exception for those wanting to marry someone from another
GCC country, their cousin, or the son/daughter of a Qatari mother. http://gulfmigration.eu/law-no-
21-0f-1989-regulating-marriage-to-foreigners-2/.
38. This is worth noting, as anywhere else in the GCC, males marry away more than females, due to rising
bride prices.
39. Law No. 38 of 2005 on the Acquisition of Qatari Nationality, http://gulfmigration.eu/qatar-law-no-
38-of-2005-on-the-acquisition-of-qatari-nationality/.
Explanatory Note No. 8/2014 17Françoise De Bel-Air
About the Author
Françoise De Bel-Air (Ph.D.) is a researcher and consultant based in Paris, France.
A socio-demographer by training, she specialises in the political demography of Arab
countries, with an emphasis on the Middle Eastern and Gulf States. She has been a
research fellow and programme manager in the French Institute for the Near East
(IFPO) in Amman, Jordan. She is currently involved in several European and inter-
national projects focusing on recent changes in family structures in the Arab world,
highly-skilled and female migration, as well as GCC countries’ demographic dynam-
ics and policies. She has published over thirty-five book chapters, scientific articles and research papers,
and an edited volume on Migration and Politics in the Middle East (2006). She is currently working on
a book on Jordan and the refugee issue. Contact: f_dba@hotmail.com
Publication Reference : Citations and quotations should always include either the long or the short
reference provided here. Generally the long reference should be used but in exceptional cases (e.g., not
enough room), the short reference may be used.
Long Reference: Françoise De Bel-Air , “Demography, Migration, and Labour Market in Qatar,”
Explanatory Note No. 8/2014, Gulf Labour Market and Migration (GLMM) programme of the
Migration Policy Center (MPC) and the Gulf Research Center (GRC), http:// gulfmigration.eu
Short Reference: F.De Bel-Air, “Demography, Migration, and Labour Market in Qatar,” Explanatory
Note No. 8/2014, GLMM, http:// gulfmigration.eu
GLMM Mission : The Gulf Labour Markets and Migration programme is an international independ-
ent, non-partisan, non-profit joint programme of a major Gulf think tank, the Gulf Research Cent-
er (GRC - Jeddah, Geneva, Cambridge, Tokyo), and a globally renowned academic migration centre,
the Migration Policy Centre (MPC - Florence). The GLMM programme provides data, analyses, and
recommendations contributing to the improvement of understanding and management of Gulf labour
markets and migration, engaging with and respecting the viewpoints of all stakeholders.
GLMM Activities : The Gulf Labour Markets and Migration programme will have a wide range of
activities, including: Collecting and elaborating data and documents; Researching and analysing key is-
sues; Publishing various types of papers; Providing a daily news service; Training; and Organising panels
and workshops.
GLMM Publications : The Gulf Labour Markets and Migration programme produces an array of
publications addressing all major issues in different formats. Initially, it focuses on Facts Sheets, Explana-
tory Notes and Conference Papers. Subsequently, it will add Research Papers, Policy Briefs, Academic
Publications as well as Proceedings & Reports.
Downloading and Further Information : The paper can be downloaded from the Gulf Labour Markets
and Migration programme website: www.gulfmigration.eu. For further information: info.glmm@grc.net
18 Gulf Labour Markets and MigrationDemography, Migration, and Labour Market in Qatar
MIGRATION
POLICY CENTRE
Explanatory Note No. 8/2014You can also read