MOVING TOWARDS A LOW-CARBON TRANSPORT FUTURE - Increasing Rail Share in Freight Transport in India Freight Performance of Indian Railways - Shakti ...
←
→
Page content transcription
If your browser does not render page correctly, please read the page content below
THE ENERGY AND
                 RESOURCES INSTITUTE
Creating Innovative Solutions for a Sustainable Future

  MOVING TOWARDS A LOW-CARBON
  TRANSPORT FUTURE
  Increasing Rail Share in
  Freight Transport in India
    Freight Performance of Indian Railways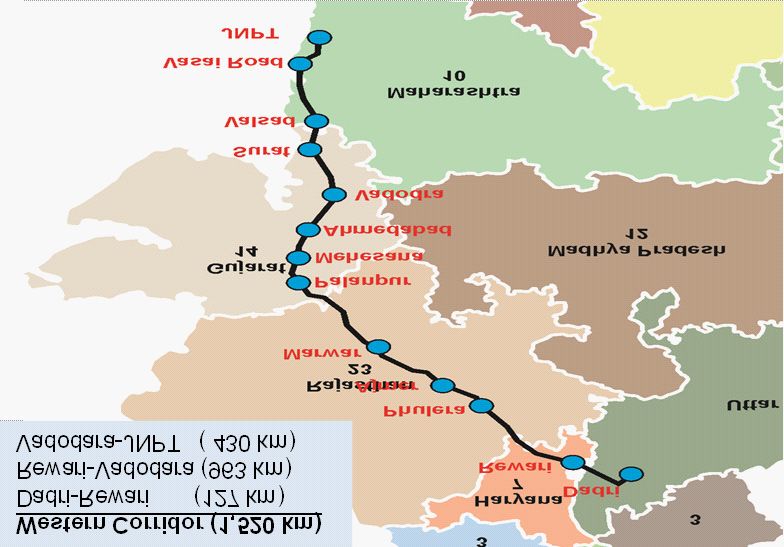
INCREASING RAIL SHARE IN FREIGHT TRANSPORT IN INDIA

                 THE ENERGY AND
                 RESOURCES INSTITUTE
Creating Innovative Solutions for a Sustainable Future

MOVING TOWARDS A LOW-CARBON
TRANSPORT FUTURE
Increasing Rail Share in
Freight Transport in India
 Freight Performance of Indian Railways

                                                                                                               1
WORKING PAPER – FREIGHT PERFORMANCE OF INDIAN RAILWAYS
© The Energy and Resources Institute 2019
T E R I. 2019
Increasing Share of Rail in Freight Transport in India: Working Paper-Freight Performance of Indian Railways
New Delhi: The Energy and Resources Institute.
[Project Report No. 2016UD05
About Shakti: Shakti Sustainable Energy Foundation works to strengthen the energy security of India by aiding the
design and implementation of policies that support energy efficiency, renewable energy and sustainable mobility.
Disclaimer: The views/analysis expressed in this report/document do not necessarily reflect the views of Shakti
Sustainable Energy Foundation. The Foundation also does not guarantee the accuracy of any data included in this
publication nor does it accept any responsibility for the consequences of its use.
For more information
Project Monitoring Cell
TERI Tel. 2468 2100 or 2468 2111
Darbari Seth Block E-mail pmc@teri.res.in
IHC Complex, Lodhi Road Fax 2468 2144 or 2468 2145
New Delhi – 110 003 Web www.teriin.org
India India +91 • Delhi (0)11
2INCREASING RAIL SHARE IN FREIGHT TRANSPORT IN INDIA
TABLE OF CONTENTS
Freight Performance of Indian Railways 1
Decoupling of Rail Traffic and GDP growth rates 1
Plan period – Targets and Achievements 9
Focus on infrastructure development 10
Committees to Determine the Cause of Market Share Decline 12
Key Challenges faced by IR 14
Commodities carried by IR 17
Initiatives by IR 18
Rationale for selection of commodities 21
ANNEXURE 24
3WORKING PAPER – FREIGHT PERFORMANCE OF INDIAN RAILWAYS
LIST OF FIGURES
Figure 1: Investment in road and rail infrastructure under the last three Five Year Plans (Rs crore) 7
Figure 2 : Growth of IR’s passenger and freight traffic and India’s GDP 8
Figure 3: Sources of revenue and expenditure heads of Indian Railways 9
Figure 4: IR’s expenditure sources over the last three Five Year Plans 9
Figure 5: IR’s operating ratio trend 9
Figure 6: Construction and investment in New Lines (route km, Rs crore) T: Target; A: Achievement 10
Figure 7: Construction work and investment related to Gauge Conversion (route km, Rs crore) 11
Figure 8: Construction and investment related to Doubling work (route km, Rs crore) 11
Figure 9: Work and investment related to Electrification (route km, Rs crore)T: Target; A: Achievement 12
Figure 10: Timeline of key committee reports related to Indian Railways 13
Figure 11: Track utilization during the last three Five Year Plan periods 15
Figure 12: Average turnaround time of wagons during the last Five Year Plan periods (days) 16
Figure 13: Wagon utilization during the last three Five Year Plan periods 16
Figure 14: Average speed of goods train during last three Five Year Plan periods (km/hour) TY: Terminal year; 16
Figure 15: Average lead of freight tonne carried by IR (km) 17
Figure 16: Composition of IR’s freight traffic for 2017-18 (share in total NTKM) 17
Figure 17: Traffic trend of key bulk materials carried by Indian Railways (2013-14 to 2017-18) 17
Figure 18: Route map of Eastern DFC 20
Figure 19: Route map of Western DFC 20
Figure 20: IR’s investment towards track renewals 21
4INCREASING RAIL SHARE IN FREIGHT TRANSPORT IN INDIA
LIST OF TABLES
Table 1: Growth rate of NTKM, PKM and GDP during the last three Five Year Plan periods (CAGR %) 18
Table 2: Growth rate of freight and passenger earnings during the last three
Five Year Plan period (CAGR %) 20
Table 3: Targets and achievements of Passenger and Freight traffic during the last three Five Year Plans 21
Table 4: Line Capacity Status of High Density Network on IR (No. of sections) 24
Table 5: Key freight-related policy initiatives undertaken by the Indian Railways 25
5INCREASING RAIL SHARE IN FREIGHT TRANSPORT IN INDIA
ACKNOWLEDGMENT
The Energy and Resources Institute (TERI) would like to express deep gratitude to the Member Traffic and Railway
Board directorates (Traffic, Commercial, Freight Marketing, and Coaching) for their support and guidance throughout
the study. TERI also thanks the officers at different zonal railways in sharing valuable inputs for the study. This report
would not have been possible without the support and guidance of the Indian Railways (IR).
TERI extends sincere thanks to various stakeholders and industry representatives who shared their insights and ideas
towards increasing the share of IR’s freight loading.
We also extend sincere gratitude to Shakti Sustainable Energy Foundation in supporting TERI to undertake this study.
The project team also acknowledges the contribution of Mr Shri Prakash, Distinguished Fellow, TERI, and Mr Deepak
Nath, Independent Consultant and Ex-Railway Personnel towards reviewing and enriching the study with their
valuable suggestions and experience of the railways sector. We take this opportunity to thank the editorial and design
team at TERI for their contribution.
Project Team
Team Lead
Mr Shri Prakash
Project Investigator
Mr Sharif Qamar
Advisor
Mr Deepak Nath
Team
Mr Narendra Verma
Mr Aravind Harikumar
Mr Manmeet Singh Loomba
Ms Saloni Gupta
Mr Sarbojit Pal
Mr Thomas Layzell
Secretarial Assistance
Ms Sonia Khanduri
7INCREASING RAIL SHARE IN FREIGHT TRANSPORT IN INDIA
FREIGHT PERFORMANCE OF INDIAN RAILWAYS
1,000,000
The Indian Railways (IR) is a mammoth organization. The
900,000
size of this organization can be gauged by the number 800,000
700,000
of people it employs (13 lakh direct employment), the
600,000 57%
number of passengers carried (about 23 million in a 500,000
44%
day), and the volume of freight traffic carried (about 3 400,000 66%
201,237
453,121
127,107
300,000
million tonnes per day). However, these are also the
84,100
914,536
519,221
200,000
areas of concern for IR’s growth right now. Massive fund 100,000
0
is required to pay its employees – retired and present, 10th PLAN (2002-07) 11th PLAN (2007-12) 12th Plan (2012-17)
and the growth rates for both passenger traffic and
Road Rail
freight traffic are declining. The financial position of Figure 1: Investment in road and rail infrastructure under the last three
rising expenditure and lower growth in revenues makes Five Year Plans (Rs crore)
Note: Figures in box indicate rail investment as a percentage of road investment
it difficult for the IR to manage its capacity expansion Source: Five Year Plan Documents and NTDPC
initiatives. ‘The operating ratio, which should be between
massive infrastructure, and the lack of commercial and
80–85%’, 1 was reported at 96.5% in 2016-17 (Annual
marketing initiatives to attract traffic. The perception of
Statistical Statement, 2016-17).
industry about Indian Railways has always been that of a
transporter with a ‘take it or leave it’ approach. Railways,
Decoupling of Rail Traffic and on the other hand, witnessed a slowdown in investment
GDP growth rates in capacity augmentation and consistently higher tariff
The contribution of transport sectors in the growth of rates to subsidize the passenger movement.
an economy is undisputed. It is seen that its contribution
Further, since the effect of investment in physical
is higher than the proportion of the expenditure being
infrastructure comes with a lag on account of gestation
used to improve and maintain the transport sector.2 The
period, the decline in railway freight traffic is expected
Indian Railways has always played an important role in
to extend in the coming years as well, at least till the
the economy’s growth rate. However, there has been
two on-going Dedicated Freight Corridor (DFC) projects
rising dominance of the road sector in passenger as well
are fully functional and other capacity augmentation
as freight transportation. This is largely on account of
projects are realized.
increased investment in improving road infrastructure
(Figure 1) as well as the declining cost of road TERI analyses the growth in IR’s traffic during last three
transportation. Economic Survey, 2017-18 highlighted five year plan vis-à-vis economic growth (in terms of
this major constraint of increasing competitiveness gross domestic product [GDP]).
(tariff ) from other modes of transport, mainly road that
has resulted in IR’s slowdown in freight traffic3. Other Without doubt, the Tenth Five Year Plan Period (2002-
reasons cited by various committee reports as well as 07) was one of the most successful years for Indian
previous economic surveys include severe capacity Railways in terms of transportation output – passenger
constraints on trunk routes, non-flexible policies, km for passenger movement and tonne km for freight
limited financial resources to maintain or develop movement. Indian Railways exceeded most of the
1
http://planningcommission.nic.in/plans/planrel/12appdrft/appraoch_12plan.pdf
2
http://www.oecd.org/derec/adb/39066399.pdf
3
https://mofapp.nic.in/economicsurvey/economicsurvey/pdf/120-150_Chapter_08_Economic_Survey_2017-18.pdf
9WORKING PAPER – FREIGHT PERFORMANCE OF INDIAN RAILWAYS
targets set for the Tenth Five Year Plan 4. Such outcome Notably, the rate of growth of the gross domestic product
was achieved by the Railway Board by adopting supply (GDP) remained on a higher side throughout the three
side strategy of running faster, longer and heavier trains; plan periods, indicating a de-coupling of GDP and IR’s
and demand side strategy of dynamic and differential traffic growth. There could be various factors leading to
pricing (Mehrotra, 2009). the rail traffic decline, even though GDP remained on the
higher side, including infrastructural constraints, inability
For the freight movement, the decision was taken to
to cater to changing customer needs, etc. (these have
increase the load ability of wagons on select routes by
been elaborated in later sections).
15% during mid-2000. The tariff rates were also tweaked
based on the market competition and the kind of Table1: Growth rate of NTKM, PKM and GDP during
services rendered by IR for certain commodities also the last three Five Year Plan periods (CAGR %)
improved. As a result, significant improvement in loading CAGR_ CAGR_PKM CAGR_GDP
was reported for commodities, such as coal, iron ore, NTKM
cement, and containers. 10th Plan 8.0% 7.8% 8.6%
The transportation output growth during the Eleventh 11th Plan 6.4% 8.0% 7.3%
Five Year Plan tapered, where the achievement was 12th Plan -1.2% 1.3% 7.3%
lower than the target. For instance, the revised terminal Source: Indian Railways and Reserve Bank of India 6
year target for passenger km was set at 1,100 billion;
however, the actual achievement was 1,062 billion, a
shortfall of about 4%. In terms of freight transportation, Finances of the Indian Railways
IR reported 640 billion tonne km (btkm) during 2011-12
The Indian Railways is dependent on a number of
as compared to the revised target of 674 btkm, a shortfall
sources for funding their day-to-day requirements as
of 5% 5.
1,400 100,000
800 100,000 92,687
92,687
682 1,147 86,140 90,000
668 666 86,140 90,000 1,140
700 650 1,200 1,098
1,047 80,000
80,000 1,150 1,158
600 654 1,000 80,056
80,056 620 70,000
70,000 74,195
481 74,195 68,762 60,000
billion NTKM
billion PKM
500 68,762 800
Rs crore
60,000 695 63,787
Rs crore
63,787
50,000
400 333 50,000
600 491
45,324 40,000
300 45,324 40,000
400 30,000
30,000
200 29,901 20,000
29,901 20,000 200
100 10,000
10,000
0 0
0 0
2001-02 2006-07 2011-12 2012-13 2013-14 2014-15 2015-16 2016-17
2001-02 2006-07 2011-12 2012-13 2013-14 2014-15 2015-16 2016-17
9th Plan 10th Plan 11th Plan 12th Plan
9th Plan 10th Plan 11th Plan 12th Plan
PKM (billion) GDP (Rs crore)
NTKM (billion) GDP (Rs crore)
Figure 2 : Growth of IR’s passenger and freight traffic and India’s GDP
Source: Indian Railways
The rate of growth of pkm and tkm witnessed rapid well as infrastructure augmentation. There are three
decline during the Twelfth Plan period (Table 1). This key sources—budgetary allocation, extra budgetary
compared to relatively higher rate of growth during the resources like market borrowing, and internal resource
previous two plan periods (Tenth and Eleventh). The generation mainly through traffic income.
Eleventh Plan witnessed economic slowdown due to
A trend analysis of the sources of revenue for the Indian
global financial crisis and despite this, the tkm and pkm
Railways is as follows:
grew at a healthy rate.
4
http://www.indianrailways.gov.in/railwayboard/uploads/directorate/infra/downloads/ReportoftheWorkingGroupfortheXIfiveyearPlan.pdf
5
http://planningcommission.gov.in/plans/planrel/fiveyr/12th/pdf/12fyp_vol2.pdf
6
Please note that comparison on the basis of growth rates (CAGR over the five year plans) overcomes the data challenge related to the change in base
year from 2004-05 to 2011-12
10INCREASING RAIL SHARE IN FREIGHT TRANSPORT IN INDIA
IR Finances
Sources of receipts in a Rupee (Paise)
instead of focussing on the rising passenger earnings.
Sources of funds Table 2: Growth rate of freight and passenger earnings
Extra Internal
Passenger, 28
during the last three Five Year Plan period (CAGR %)
Budgetary
budgetary resources Freight, 63
CAGR_ CAGR_ CAGR_ CAGR_
Miscellaneous, 6
Parcels and other Freight Passenger Total GDP
coaching, 3
Sources of expenditure in a Rupee (Paise)
Earnings Earnings Traffic
Earnings
Capital Revenue
Contribu on to
funds, 25
Repairs &
maintenance, 24
10th 12.0% 8.2% 10.8% 8.6%
Expenditure Expenditure
Genl.
Superintendence, 4
Plan
Misc wkg exp, 4
Expenditure heads Opera ng expenses,
38
Staff welfare, 4 11th 10.0% 9.3% 9.8% 7.3%
Other misc exp, 1
Plan
Figure 3: Sources of revenue and expenditure heads of Indian Railways 12th 5.2% 10.3% 6.6% 7.3%
Note: Revenue and expenditure shares are for 2016-17; Source: Indian Railways\
Plan
¾¾ There is a rapidly increasing dependence on extra Source: Indian Railways
budgetary resources like market borrowing due
to lower share of internal resources in total fund Operating ratio
required for infrastructure expansion.
As mentioned in the opening remarks to this chapter,
Indian Railways is facing stiff challenge of high operating
140,000
120,000
100,000
ratio. Operating ratio is defined as the amount spent to
80,000
earn every Rs 100. IR’s operating ratio has consistently
Rs crore
60,000
40,000
20,000 remained above 90 since 2008-09.
0
2013-14
2014-15
2015-16
2016-17
2008-09
2009-10
2010-11
2011-12
2012-13
2005-06
2006-07
2007-08
2002-03
2003-04
2004-05
2017-18 (R)
10th PLAN 11th PLAN 12th PLAN
GBS EBR/Market borrowing Internal Resources Total Opera ng ra o
100 96.0 94.9 96.5
93.6
90.2 91.3 90.5
90
Figure 4: IR’s expenditure sources over the last three Five Year Plans 78.7
80
Source: Budget documents, Indian Railway
70
¾¾ The spike in the internal resources during 2014-15 in 60
Figure 4 is on account of increase in passenger and 50
freight tariff rates in June 2014. 2001-02 2006-07 2011-12 2012-13 2013-14 2014-15 2015-16 2016-17
TY 9th TY 10th TY 11th 12th Plan
¾¾ Budgetary support has also consistently increased in Plan Plan Plan
the last 5–6 years.
Figure 5: IR’s operating ratio trend
Source: Indian Railways
Traffic Earnings of Indian Railways
Despite decline in passenger traffic growth during Plan period – Targets and Achievements
Twelfth Plan, growth in passenger earnings remained A look at the targets set during the Five Year Plans and
on a positive side. In fact, it grew more than the Tenth the actual achievements for freight and passenger traffic
and Eleventh Five Year Plans. This is mainly due to the indicates that performance under the Tenth Plan was
significant revision in tariff rates during 2014-15. As a higher as compared to the following two plans. In fact,
government-managed service provider, Indian Railways performance under the Twelfth Plan has been extremely
should devise ways to stall the declining passenger poor with under-achievement of 42% in freight traffic
traffic and increase passenger traffic in the longer run, and 23% in passenger traffic (see Table 3).
11WORKING PAPER – FREIGHT PERFORMANCE OF INDIAN RAILWAYS
Table 3: Targets and achievements of Passenger and Freight traffic during the last three Five Year Plans
Five Year Freight Traffic Loading Achievement Passenger Traffic (billion Achievement
Plan (billion NTKM) (%) PKM) (%)
Target Actual Target Actual
10th Plan 396 481 21.5% 593 695 17.2%
11th Plan 642 668 4.0% 924 1,047 13.3%
12th Plan 1,070 620 -42.1% 1,509 1,158 -23.3%
Note: Target for the terminal year of Five Year Plans
Source: Indian Railways and NTDPC
Focus on infrastructure development Construction of New Lines
The achievements with regard to development of key With 10% over achievement in constructing new lines,
infrastructure by the Indian Railways during the last three the target for the Twelfth Plan was set ambitiously high.
five year plans have been mixed. Construction of new IR has, however, been unable to achieve the targets
lines surpassed the target only during the Eleventh Plan, under the last Five Year Plan. Investment witnessed a
gauge conversion surpassed the target only during Tenth rapid jump since 2015, the result of which is expected in
Plan, and doubling surpassed the target only during the next 4–5 years. The compound annual growth rate
Eleventh Plan. Electrification targets were surpassed (CAGR) of investment related to new lines for the Tenth,
during all the last three five year plans. Notably, the Eleventh, and Twelfth plans are 27%, -4%, and 12%,
respectively.
Twelfth Plan period witnessed severe shortfall in targets
set for new line construction, gauge conversion, and
doubling. One of the key reasons for the consistent under Gauge conversion
achievement in these segments has been slow growth in Gauge conversion has missed its target during the last
fund allocation for these categories7. It is observed that two Five Year Plans. The investment allocated towards
investment for infrastructure development increased gauge conversion has also fluctuated over the years. The
significantly during the Twelfth Plan period, the result for CAGR of investment related to gauge conversion for the
which is expected to be realized in the coming years on Tenth, Eleventh and Twelfth plans are 27%, -4%, and 12%,
account of high gestation period of these projects8. respectively. There are about 3,500 route km of metre
Construc on of new lines (Route kms) Investment in new lines (Rs crore)
4,500 16,000
4,000 14,000
3,500 12,000
3,000 10,000
Rs crore
10%
Route km
2,500 8,000
2,000 6,000
1,500 -30% 4,000
1,000 2,000
1,310
2,000
2,205
4,000
3,030
0
920
500
2002-03
2003-04
2004-05
2005-06
2006-07
2007-08
2008-09
2009-10
2010-11
2011-12
2012-13
2013-14
2014-15
2015-16
2016-17
-
T A T A T A
10th PLAN 11th PLAN 12th PLAN 10th PLAN 11th PLAN 12th PLAN
Figure 6: Construction and investment in New Lines (route km, Rs crore) T: Target; A: Achievement
Source: Planning Commission, Standing Committee report on Railways (2014-15), Working Group for the XI Five Year Plan (2006-07); and IR Year Books of respective years.
http://niti.gov.in/writereaddata/files/document_publication/Appraisal%20Document%20Five%20Year%20Plan%202012%20-%2017-Final%20
7
%281%29.pdf (assessed on July 29, 2018)
8
Note: Figures related to investment in various infrastructure development are given in Appendix 1
12INCREASING RAIL SHARE IN FREIGHT TRANSPORT IN INDIA
gauge and 2,200 route km of narrow gauge in IR’s rail IR’s infrastructure development plan. IR plans to electrify
network9 which would eventually be converted to broad 90% of the total railway routes in the years to come . As
gauge in the future. The priority for conversion of gauge seen in other projects, investment towards electrification
is dependent upon traffic growth on a particular stretch. has witnessed significant boost in the last three years.
The CAGR of investment related to electrification for
the Tenth, Eleventh, and Twelfth plans are -1%, 16%, and
Doubling
31%, respectively.
Doubling work has been given emphasis since 2015, with
quantum jump in investment. During the Tenth, Eleventh,
and Twelfth Plan periods, CAGR in investment were
Focus on Freight Traffic
reported at 20%, 8% and 39% respectively. Consistently Over the last few decades, not only has the volume
higher investment level for doubling works is likely to of freight transport increased exponentially, given a
ease the congestion situation on the IR network. rapidly growing economy, there have also been changes
in the way the movement of goods take place. From
carrying about 62% of the share of freight transport
Electrification in the country in 1990-91, the share of railways has
Electrification remains a major area of improvement in gone down to about 27% by 2014-15. As a result of the
Gauge conversion (Route kms) Investment in gauge conversion (Rs crore)
7,000 4,000
-12% 3,500
6,000
3,000
5,000 7% -35%
2,500
Rs crore
Route km
4,000 2,000
1,500
3,000
1,000
2,000 500
4,000
4,289
6,000
5,290
5,500
3,599
1,000 0
2002-03
2003-04
2004-05
2005-06
2006-07
2007-08
2008-09
2009-10
2010-11
2011-12
2012-13
2013-14
2014-15
2015-16
2016-17
0
T A T A T A
10th PLAN 11th PLAN 12th PLAN 10th PLAN 11th PLAN 12th PLAN
Figure 7: Construction work and investment related to Gauge Conversion (route km, Rs crore)
Source: Year Books, Indian Railways
Doubling (Route kms) Investment in doubling (Rs crore)
9,000 12,000
8,000
10,000
7,000
-48% 8,000
6,000
Rs crore
Route km
5,000 6,000
4,000 10% 4,000
3,000
1,300
-17% 2,000
2,000
2,500
2,756
7,653
3,972
0
1,575
1,000
2002-03
2003-04
2004-05
2005-06
2006-07
2007-08
2008-09
2009-10
2010-11
2011-12
2012-13
2013-14
2014-15
2015-16
2016-17
-
T A T A T A
10th PLAN 11th PLAN 12th PLAN 10th PLAN 11th PLAN 12th PLAN
Figure 8: Construction and investment related to Doubling work (route km, Rs crore)
Source: Year Books, Indian Railways
9
http://www.indianrailways.gov.in/railwayboard/uploads/directorate/stat_econ/IRSP_2016-17/Facts_Figure/17.pdf
13WORKING PAPER – FREIGHT PERFORMANCE OF INDIAN RAILWAYS
Electrifica
on (Route kms) Investment in Electrifica
on
8,000 3,500
14%
7,000 3,000
6,000 2,500
0.02%
Rs crore
5,000 2,000
Route km
4,000 1,500
3,000 1,000
1%
2,000 500
4,500
4,501
7,418
6,500
0
1,800
1,810
1,000
2002-03
2003-04
2004-05
2005-06
2006-07
2007-08
2008-09
2009-10
2010-11
2011-12
2012-13
2013-14
2014-15
2015-16
2016-17
-
T A T A T A
10th PLAN 11th PLAN 12th PLAN 10th PLAN 11th PLAN 12th PLAN
Figure 9: Work and investment related to Electrification (route km, Rs crore)T: Target; A: Achievement
Source: Planning Commission, Standing Committee report on Railways (2014-15), Working Group for the XI Five Year Plan (2006-07); and Year Books, Indian Railways
pertinent challenges faced by the Indian Railways and Committees to Determine the Cause of
the benefits of alternate mode of transportation—the
Market Share Decline
roadways, the share of IR in total freight transportation
The Indian Railways has conducted studies from time to
has been declining continuously. The ever expanding
time to examine the causes of decline in its market share
road networks, cost competitiveness over railways, and
and to take remedial action for arresting the downward
door-to-door service have worked in favour of the high-
trend.
carbon mode of transportation.
There have been Railway Convention Committees and
This trend not only has implications on the economic
Fare and Tariff Fixation/Enquiry Committees along
growth trajectory of country, but also on the levels of
with reports of Expert Groups on Capital Structure,
energy and emissions from the sector. Being the most
Restructuring as well as Modernization of Indian
environmentally benign mode of land transport, it is
Railways. Reports of Railway Reforms Committees and
critical for the country to first retain and then to increase
White Papers on Indian Railways are also available. More
the share of railways. This has also been quantified
recent reports on Indian Railways have been highlighted
under the Government of India’s obligations under
in Figure 10; these discuss in detail the challenges faced
the Nationally Determined Contributions (NDCs). One
by Indian Railways as well as the steps that should be
of the key strategies to meet the NDC targets, ratified
undertaken to overcome such challenges.
by India in December 2015, is to increase the share of
railways in total land-based freight transportation from Declining Rail Share in Freight Transportation: The
36% in 2012-13 to 45% by 2030. This implies that there Ministry of Railways commissioned RITES Ltd to
is a huge task before the Indian Railways to first restrict undertake a study on ‘Decline in Railways’ Share of
the declining traffic growth and then to substantially Total Land Traffic’, which was submitted in 1997. The
increase the volume it transports vis-à-vis the road primary objective of the study was to understand the
sector by 2030. Of course, a lot of hope has been pinned reasons behind the declining share of railways in total
on to the upcoming DFCs. However, the challenges freight movement and suggest measures to reverse
related to the existing system will continue to trouble IR the declining share. One of the key conclusions of the
till the dedicated freight corridors (DFCs) are operational, study was that Indian Railways was unable to carry
which need to be resolved at the earliest. There are other ‘traffic on demand’, which resulted in movement of
factors, such as marketing and tariff strategies, inter- such commodities via roadways. The study also talked
modal operability, availability of allied infrastructure like about improving terminal infrastructure and operational
terminals and warehouses, etc., as well that need to be efficiency, and developing a healthy relationship with
reviewed for the DFCs to be successful, which is beyond the truck operators to augment multi-modal or smooth
the scope of this study. transit facilities.
14INCREASING RAIL SHARE IN FREIGHT TRANSPORT IN INDIA
Expert Group for
Rakesh Mohan Modernisa
on of Indian Bibek Debroy
Commi ee Report Railways Commi ee report
2001 2009 2012 2014 2015
Vision 2020 NTDPC report
Document
Figure 10: Timeline of key committee reports related to Indian Railways
Source: Compiled by TERI
In addition, factors such as inadequate rail infrastructure, While there has been a continuous effort by the Railways
changing patterns of commodity wise demand for to retain, and further increase its share in freight
transport, increasing rail transport costs, lack of transit transport by various kinds of policy measures, there
time guarantee, etc., have all resulted in a decline in the IR’s is lack of focused integrated view towards meeting
share in freight transportation. A shortcoming on behalf this objective. Certain key bulk commodities, such as
of the railways in meeting changing customer needs coal, cement, fertilizers, iron ore, etc., still remain the
and rising up to meeting the competition from other mainstay of the Indian Railways – while the national
transport modes like roadways and other operational freight commodity basket has been undergoing a
and organizational issues of the Railways have been significant amount of change over the last few years. The
cited in the above mentioned committee reports as much more fragmented, yet flexible, road-based freight
major impediments in incentivizing movement of transport sector has been much more responsive to such
freight traffic on the Railways. These together have led to changing trends in traffic types and volumes and has
a perception issue for the railways, for which customers captured most of these new and increasing demands.
with limited demands have often shied away from using
the Railways. The report of the Committee for Mobilization of
Resources for Major Railway Projects and Restructuring
The National Transport Policy Committee, NTPC, 1980, of Railway Ministry and Railway Board (2015), chaired
recommended a market share of over 70% for railways in by Bibek Debroy, has aptly put the issue faced by
freight transport primarily on account of energy saving Indian Railways as ‘a wide gap between the supply side
potential as compared to roadways. NTDPC (2014) improvements and the demand side expectations’12.
again endorsed a primary role for railways in freight
transport and recommended a massive investment in “Railway is on the path of gradual recovery but it
capacity enhancement. It also spoke about the low fare-
still has to be kept in the ICU as it needs to be strong
freight ratio (indicating cross subsidization of passenger
enough.” – Mr Suresh Prabhu, Former Minister,
segment by charging higher tariff rates for freight) for
Ministry of Railways (July 2017)
Indian Railways as compared to some foreign rail systems
like China and France11. While these documents and “If I had not increased rail fare, believe me, the Indian
reports have made useful suggestions on the possible Railways would have come to a grinding halt. It was
measures that would help the Railways get back some headed for the ICU, and I have pulled it out.” – Mr
of its shares, there is no dedicated white paper or report Dinesh Trivedi, Former Minister, Ministry of Railways
which focusses on the specific measures that would (March 2012) (The Minister had to resign and fare
help the Railways in aggressively increasing its shares in hike was partially rolled back.)
overall national freight mobility.
http://planningcommission.nic.in/sectors/NTDPC/volume3_p1/railways_v3_p1.pdf (Page 49 of 124, assessed on August 18, 2018)
11
12
http://www.indianrailways.gov.in/railwayboard/uploads/directorate/HLSRC/FINAL_FILE_Final.pdf (accessed on August 14, 2018)
15WORKING PAPER – FREIGHT PERFORMANCE OF INDIAN RAILWAYS
Report of the Committee for Mobilization of Resources for Major Railway Projects and Restructuring of
Railway Ministry and Railway Board
The Ministry of Railways constituted a committee under the chairmanship of Mr Bibek Debroy in 2014. As the name
suggests, the key objective of the committee was to make recommendations related to mobilization of resources
for various railway projects as well as restructuring of the Railway Board. The committee submitted its final report
to the Ministry of Railways in June 2015.
Some of the key recommendations of the committee are as follows:
¾¾ Railway Board to function like Corporate Board for Indian Railways
¾¾ Re-organize Indian Railways into two groups – first one looking into Track and Infrastructure, and the other
looking into Operations of trains
¾¾ Empowerment of General Managers and decentralization of powers to Divisional Railway Managers
¾¾ Zonal construction organizations to be brought under one or more Public Sector Undertakings
¾¾ Private participation in train operation and developing infrastructure
¾¾ Recommendations related to freight marketing schemes/policies like Container Train Operator (CTO), Special
Freight Train Operator (SFTO), Automobile Freight Train Operator (AFTO), Liberalized Wagon Investment Scheme
(LWIS) and Wagon Leasing Scheme (WLS) are as follows:
• Merging of all the freight marketing schemes
• Increase the tenure to match the life of wagons (approx. 40 years)
• Liberalizing ownership of general purpose wagons
• Opening of railway good sheds for private investment and use
• Single window clearance for development of ICDs and PFTs
¾¾ Lateral inflow of talent from outside in technical and non-technical departments
¾¾ Establish a responsive and transparent accounting and costing system
¾¾ Set-up a Railway Regulatory Authority of India
¾¾ Discontinue in phases, separate Rail Budget
¾¾ Subsidies to be borne by Union Government and passenger concessions by respective Ministries
¾¾ Separation of off-line activities such as medical, schools and security
Key Challenges faced by IR of adequate infrastructure and sharing of lines by
Based on the interactions with the industry stakeholders passenger and freight trains have resulted in significant
as well as reports submitted by various committees shift of traffic from rail to road. IR’s line capacity, terminal
mentioned earlier, broad challenges or impediments to infrastructure, and rolling stock asset have not grown
faster growth of freight traffic moved by rail have been as per the demand of the logistics sector. TERI analyzes
listed below. These have been discussed in detail in these impediments below.
respective commodity-specific reports.
¾¾ Line capacity: As per IR’s White Paper (2015), 40% of
Infrastructural constraints: Delay in provision all 1,219 sections across zones were running at line
16INCREASING RAIL SHARE IN FREIGHT TRANSPORT IN INDIA
capacity of 100% or above. Majority of the Zonal ¾¾ Terminal infrastructure and operation: Basic
Railways are in the range of optimal and higher than infrastructure facilities required for smooth and
optimal utilisation of line capacity. Further, 65% of efficient operation of terminals and sidings are
the 247 high-density sections are running at a line missing or not functioning. Lack of modern
capacity of 100% or above. equipment, mechanization, maintenance of fixed
Table 4: Line Capacity Status of High Density Network on IR (No. of sections)
Zonal Rail 150% Total sections
CR 12 4 7 12 5 40
ECoR 5 – 6 8 1 20
ECR 1 5 4 3 3 16
ER – 3 7 – – 10
NCR – 1 5 19 1 26
NER 1 3 6 1 3 14
NFR – 3 – 5 1 9
NR 3 4 5 7 2 21
SCR – 14 2 2 2 20
SER 2 2 6 6 – 16
SECR – – 3 5 1 9
SR 5 8 4 – – 17
WCR 1 – 2 2 2 7
WR – 9 2 9 2 22
Total 30 56 59 79 23 247
Source: White Paper, Indian Railways (February 2015)
¾¾ Track utilization: IR’s performance with regard to assets, security and safety issues, and poor access/
track utilization has been declining in the recent approach road condition are some of the concerns
years. The CAGR of NTKM per route km declined from raised by the stakeholders. There are issues related
5.6% in Tenth Plan and 4% during Eleventh Plan to to terminal policy of IR with difficulty faced by
-3% during the Twelfth Plan period. interested private players in acquiring land to
develop green-field terminals. Indian Railways
Track u liza on
need to put in place long term perspective plan for
14
12 terminal infrastructure backed by adequate policy
NTKM/route km in million
10 tool to (1) encourage private participation in the
8
operation and management of terminals, and (2)
6
4 optimum utilization of terminal resources.
2
¾¾ Wagon turnaround time: Wagon turnaround time
0
has also registered a continuous decline over the last
2002-03
2003-04
2004-05
2005-06
2006-07
2007-08
2008-09
2009-10
2010-11
2011-12
2012-13
2013-14
2014-15
2015-16
2016-17
three Five Year Plans, with maximum plunge reported
2013-14
2014-15
2015-16
2016-17
10th PLAN 11th PLAN 12th PLAN
during the Tenth Plan period. The CAGR recorded
NTKM/route km in million
12th PLAN
Figure 11: Track utilization during the last three Five Year Plan periods
during Tenth, Eleventh, and Twelfth Plan periods are
Source: Indian Railways
17WORKING PAPER – FREIGHT PERFORMANCE OF INDIAN RAILWAYS
-5.9%, -0.7%, and 0.7%, respectively. It is to be noted Higher transit time: One of the primary and determining
that the wagon turnaround time is also dependent factors of modal choice for freight transportation is
upon the speed of freight trains, which has been time-component of logistics. IR has under-performed in
discussed in the following section. providing timely delivery of services, which is one of the
Wagon turnaround me (days)
reasons for shift of short lead bulk traffic (cement, steel
7.5 7
6.7
products, containers, etc.) or in some cases long lead
7 6.4
6.5 6.08 traffic (like automobile, parcels, etc.) to roadways. For
6 5.49 5.32
5.5
5.23 5.19
4.98 4.97 5.08 5.18 5.13 4.98 5.18 commodities like automobile and parcel trains, where
Days
5
4.5
IR has assured/guaranteed transit time, it has under-
4
3.5
performed miserably.
3
2016-17
2013-14
2014-15
2015-16
2011-12
2012-13
2007-08
2008-09
2009-10
2010-11
2005-06
2006-07
2002-03
2003-04
2004-05
Infrastructural constraints as well as priority of ‘moving
people’ have resulted in lower average speed of freight
10th PLAN 11th PLAN 12th PLAN
trains. The average speed of goods train, which improved
Wagon turnaround me (days)
26.5
25.9
Figure 12: Average turnaround time of wagons during the last Five Year 26.0
25.5
25.5
Plan periods (days) 24.9 25.0
25.0
Source: Indian Railways
24.5 24.2
km/hr
24.0 23.8 23.7
23.4
¾¾ Rolling stock: 23.5
23.0
Wagon utilization as well as track utilization rate has 22.5
22.0
2001-02 2006-07 2011-12 2012-13 2013-14 2014-15 2015-16 2016-17
declined during the Twelfth Five Year Plan. The CAGR 9th Plan (TY) 10th Plan (TY) 11th Plan (TY) 12th Plan
recorded for wagon utilization during the Twelfth Plan
was 3.4%. The CAGR for track utilization for freight Figure 14: Average speed of goods train during last three Five Year Plan
periods (km/hour) TY: Terminal year;
and passenger segment during the Twelfth Plan were Source: Indian Railways
-3% and 0.5%, respectively. One of the key measures
during the Tenth and Eleventh Five Year Plan periods,
to increase the wagon utilization level is to induct
declined during the Twelfth Plan period. As per IR’s
commodity-specific wagons instead of common
Annual Statistical Summary, the average speed of goods
pool of wagons for loading of key bulk commodities.
train dropped at a CAGR of 1.8% from 25.5 km per hour
The NTKM per wagon per day is comparatively very
in 2012-13 to 23.7 km per hour in 2017-18. The CAGR of
small than the railway systems of China and Russia 13.
average speed of goods trains during Tenth and Eleventh
Plan were 0.2% and -0.4%, respectively.
Wagon u liza on (NTKMs per wagon per day)
Track u liza on
8,000 Price competitiveness of IR: When compared its
14
7,000
biggest competitor – road transport, IR’s tariff rates are
12
NTKMs per wagon per day
NTKM/route km in million
6,000 10
on the higher side. As per IR’s White Paper (2015), the
5,000 8
4,000
high
6 density networks of the Indian Railways are facing
3,000 acute
4
capacity constraints coupled with a low passenger
2
2,000 fares
0
thereby leading to increases in freight tariffs to
2002-03
2003-04
2004-05
2005-06
2006-07
2007-08
2008-09
2009-10
2010-11
2011-12
2012-13
2013-14
2014-15
2015-16
2016-17
1,000
cross subsidize passenger revenues. The uncompetitive
0
freight10thcharges associated with Indian Railways are
2002-03
2003-04
2004-05
2005-06
2006-07
2007-08
2008-09
2009-10
2010-11
2012-13
2013-14
2014-15
2015-16
2016-17
2011-12
PLAN 11th PLAN 12th PLAN
regularly sighted byNTKM/route
stakeholders
km in million as a key reason why
10th PLAN 11th PLAN 12th PLAN
significant amounts of freight have moved away from
Figure 13: Wagon utilization during the last three Five Year Plan periods railways. Further, improvement in road infrastructure
Note: Wagon utilization calculated in terms of 8 wheelers since 2008-09 and faster transit through roadways have enabled
Source: Indian Railways
13
https://www.edelresearch.com/showreportpdf-35319/RAILWAYS_-_SECTOR_REPORT-JAN-17-EDEL
18INCREASING RAIL SHARE IN FREIGHT TRANSPORT IN INDIA
road transporters to operator at lower cost and offer accounted for 40% of the total NTKMs conducted by the
competitive rates as compared to railways. Indian Railways during 2017-18.
Lack of marketing approach to tap ‘traffic on- When the commodities are segregated in terms of
demand’: Indian Railways has essentially followed the door-to-door service (one of the factors of freight
‘take-it or leave-it’ approach of freight transportation. IR competitiveness), it is seen that key commodities like
has to adopt customer centric approach to (1) increase coal, raw material for steel plants (RMSP), clinker for
loading of existing/bulk commodities, and (2) diversify cement plants and iron ore, falls into this category (site
its freight basket. In recent times, IR has undertaken to plants).
several measures (special wagon schemes, commodity-
specific operator schemes, terminal-related policies, etc.) Commodity-wise share in total freight NTKM
to cater to the specific needs of the consignors; however,
it has under-performed in almost all areas. Regular Container Others
Coal
8% 40%
dialogue with the stakeholders to understand their 9%
POL
requirements and challenges should be initiated by the 4%
Indian Railways. Fer lizers Door-to-door
6%
Sta on-to-sta on/
Average Lead: The average lead of freight carried by Door-to-Sta on/
Foodgrains Sta on-to-door
IR has also become shorter over the period. The fall in 9%
average lead was significantly higher during the Twelfth Steel
7%
Iron ore
Plan from 644 km in 2012-13 to 561 km in 2016-17 (CAGR Cement 6%
3% Clinker RMSP
of -3.4%). There was a marginal increase in average lead 6% 2%
during the Eleventh Plan from 657 km in 2007-08 to 689
km in 2011-12. In comparison, the average transport Figure 16: Composition of IR’s freight traffic for 2017-18
distance of freight trains in China is around 700 km, (share in total NTKM)
Source: Indian Railways and TERI Analysis
which has been declining over the years, however at a
much slower rate than India14. The remaining commodities can be categorized under
those where movement takes place from station-to-
station (example, automobiles, cement, steel, etc.),
Average lead (km)
door-to-station (example, cement, steel, fertilizers, etc.)
750
681 684 677 679 689 or station-to-door (fly ash, etc.). Besides other factors
700 660 661 657 662 676 644 633
622
650 594 (transit time, volume, and distance), this plays a key role
600 561
km
550
in determining the freight rates for freight commodities
500 by IR.
NTKM trend of key bulk commodi es
450
80,000
400
2016-17
2014-15
2015-16
2012-13
2013-14
2009-10
2010-11
2011-12
2007-08
2008-09
2005-06
2006-07
2002-03
2003-04
2004-05
70,000
60,000
10th PLAN 11th PLAN 12th PLAN
million NTKM
50,000
40,000
Average lead (km)
30,000
Figure 15: Average lead of freight tonne carried by IR (km)
Source: Indian Railways 20,000
10,000
Commodities carried by IR 0
2013-14 2014-15 2015-16 2016-17 2017-18
Indian Railways is termed as a bulk carrier since nine bulk Iron ore RMSP Cement
Steel Foodgrains Fer lizers
commodities account for about 90% of the total freight
Figure 17: Traffic trend of key bulk materials carried by Indian Railways
(in NTKMs) in 2017-18 . Of the nine commodities, coal
(2013-14 to 2017-18); Source: Indian Railways
http://data.stats.gov.cn/english/easyquery.htm?cn=C01 (assessed on August 14, 2018)
14
http://www.indianrailways.gov.in/railwayboard/uploads/directorate/stat_econ/MTHSTAT/2018/Freight_March_2018_R.pdf
15
19WORKING PAPER – FREIGHT PERFORMANCE OF INDIAN RAILWAYS
While the Railways have been losing their share in the would be implementable and that could be taken up
overall freight transport pie, the share of railways in the by the railways and the industries alike, TERI selected six
movement of different commodities has been different. specific commodities for this study. These commodities
For commodities, such as coal and iron ore, which are the are cement, automobiles, containers, steel, fly ash, and
mainstay of the Railway business, the shares of transport parcels.
on railways have declined marginally over the last five
The multi-year study has been undertaken in two phases.
years. Foodgrain traffic on Indian Railways declined at a
Under the first phase, three commodities (Cement,
CAGR of about 2.5% during 2013-14 to 2017-18. In case
Automobiles, and Containers) were selected while under
of commodities, such as cement and petroleum products the second phase three additional commodities (Steel,
(POL), the railways have been losing shares, mainly on Fly ash, and Parcels) were selected for detailed analysis.
account of availability of alternative mode transport – The rationale for selection of each of these commodities
road for cement and pipeline for POL. The situation is is enumerated in the following section.
particularly acute in the case of cement, where the shares
of loading have come down from almost 44% to 38%
in a period of 5 years (2013 to 2018). Other than these
Initiatives by IR
bulk commodities, which have historically moved on IR has undertaken several initiatives, with regard
Railways, commodities such as containers, automobiles, to policy as well as infrastructure development,
to enhance its capability and attract freight onto
fly ash, parcels, break-bulk, and other white goods have
railways. These have been discussed, in brief, in this
seen limited movement on rail.
section.
However, demands for most of the commodities
mentioned above can be met by Indian Railways, and Policy-related initiatives
given that the demands for these commodities are In the last 10 years, IR has undertaken several policy
expected to increase in the future it is important to initiatives to boost private participation in increasing
identify strategies for capturing their shares on rail. share of railways in freight transportations. These have
To be able to draw up specific recommendations, that been listed in Table 5.
Table 5: Key freight-related marketing policies undertaken by the Indian Railways
Area Policy Details
Terminals Private Freight The PFT policy was launched in 2010 and later revised in 2015. The aim
Terminal (PFT) of the policy is to attract private investment in setting up of freight
policy terminals. 16
Wagon Leasing The WLS was launched in 2008, which was revised in 2014. The aim of the
Scheme (WLS) policy is to ‘develop strong leasing market by encouraging third party
leasing of wagons.’
Rolling stock Liberalised Wagon The LWIS policy was launched in 2008, which was revised last year in
Investment July 201817 . It allows private players to invest to procure special purpose
Scheme (LWIS) wagons and high capacity wagons to operate on specific routes/circuits.
These wagons are not merged with wagon pool of IR.
General Purpose The policy was introduced in April 2018 to encourage private investment
Wagon Investment in general purpose wagons like BOX, BCN, BOXN, etc. IR has not covered
Scheme (GPWIS) special purpose wagons under this scheme.
16
http://www.indianrailways.gov.in/railwayboard/uploads/directorate/traffic_comm/Master_Circulars/MC_PFT_020115.pdf
17
http://www.indianrailways.gov.in/railwayboard/uploads/directorate/traffic_comm/downloads/Freight_Marketing_2018/Liberalized_02072018.pdf
20INCREASING RAIL SHARE IN FREIGHT TRANSPORT IN INDIA
Table 5: Key freight-related marketing policies undertaken by the Indian Railways
Area Policy Details
Special Freight IR launched the SFTO policy in 2010, and revised it in 2014. 18It aims to
Train Operator provide opportunity to private operators to offer rail services through
(SFTO) policy owned rakes.
Special Parcel Train It was launched by IR in 2014 to increase parcel loading on to its trains
Operator (SPTO) through private participation. The policy allows private parties to procure
Train operation scheme rolling stock, including general service parcel vans, refrigerated vans, etc.,
and operate it as special parcel trains.
Automobile Freight The AFTO was launched in 2010 and was revised in 2014. The policy
Train Operator provides opportunity to the private logistics companies/transporters
(AFTO) policy to run freight trains catering to the automobile sector. The operator can
induct new higher capacity wagons, provided it meets the conditions set
by IR’s Research Design and Standard Organization (RDSO).
Development of In parallel to the AFTO policy in 2010, the Railways also launched
Automobile & “Development of Automobile and Ancillary Hub” policy to facilitate
Logistics facility
Ancillary Hub end to end logistics for automobiles. The aim of the policy is to provide
opportunities to automobile manufacturers to do bulk transportation by
rail and do secondary distribution to consuming centres in the immediate
catchment areas from such hubs.
Long-term Tariff The LTTC scheme was introduced by IR in 2017. Through this, both the
Contract (LTTC) parties agree to a pre-determined price escalation principle, where
Tariff-related
scheme cement companies can avail freight rebate on incremental loading/
scheme
revenue.
Comprehensive The policy with regard to parcel space leasing was brought in by the
Parcel Leasing Indian Railways in March 2006. Indian Railways launched the modified
Policy (CPLP) CPLP in April 2014. The objective is to increase private/lease holder
Parcel business
participation in carrying parcels by Indian Railways.
Parcel Cargo PCET policy was introduced in 2007. It set out the set of rules for the
Express Train operation of leased trains for parcel movement.
(PCET) policy
Source: Indian Railways
During the period of policy implementation, several Infrastructure development-related initiatives
issues arise which the Indian Railways try to resolve Besides new line, doubling, gauge conversion,
by bringing in amendments to the policy. One of the electrification, track renewal, etc., the Indian Railways has
key recommendations, which also emerged from the been engaged in mega projects to augment its capacity
discussions TERI had with various groups of stakeholders, to handle freight. Some of these have been discussed
is the need to make customer-centric policies. Rounds here.
of deliberations with non-railway parties need to be
Dedicated Freight Corridor project
undertaken before finalizing the policies, so as to reduce
the number of amendments required later and to ¾¾ DFC project was conceived in 2004-05 and the
maintain consistency of policies. Dedicated Freight Corridor Corporation of India Ltd
18
http://www.indianrailways.gov.in/railwayboard/uploads/directorate/traffic_comm/Master_Circulars/sfto0001_221214.pdf
21WORKING PAPER – FREIGHT PERFORMANCE OF INDIAN RAILWAYS
(DFCCIL) was set up in October 2006 to undertake ¾¾ Projected to cater to several traffic streams – coal for
the project. The Ministry of Railways has a 100% the power plants in Uttar Pradesh, Delhi, Haryana,
equity stake in the special purpose vehicle. Punjab, and Rajasthan. Other key commodities
¾¾ With an investment of over Rs 81,459 crore, DFC is projected to be transported on this corridor include
finished steel, foodgrains, cement, fertilizer and
one of the biggest ongoing infrastructure projects in
limestone, and general goods.
the country19 .
Western Corridor - WDFC
¾¾ The DFC project is expected to be fully commissioned
by 2020-21. ¾¾ The 1,520 km Western Dedicated Freight Corridor
Benefits envisaged under the DFC Project
Faster (100 kmph), higher (5.1-7.1 m) Quantum jump in transporta on Focus on bulk as well as lighter
and longer (1,500 m) train service capacity (up to 13,000 tonne) commodi es (including roll on-roll off)
Connec vity to major ports of Induc on of modern technology in
Gujarat and JNPT in Maharashtra as maintenance, train opera on and low
well to new and upcoming ports opera ng cost
Schedule me -tabled trains
Eastern Corridor - EDFC (WDFC) is being developed between Ludhiana in
Punjab to Dankuni in West Bengal at an estimated
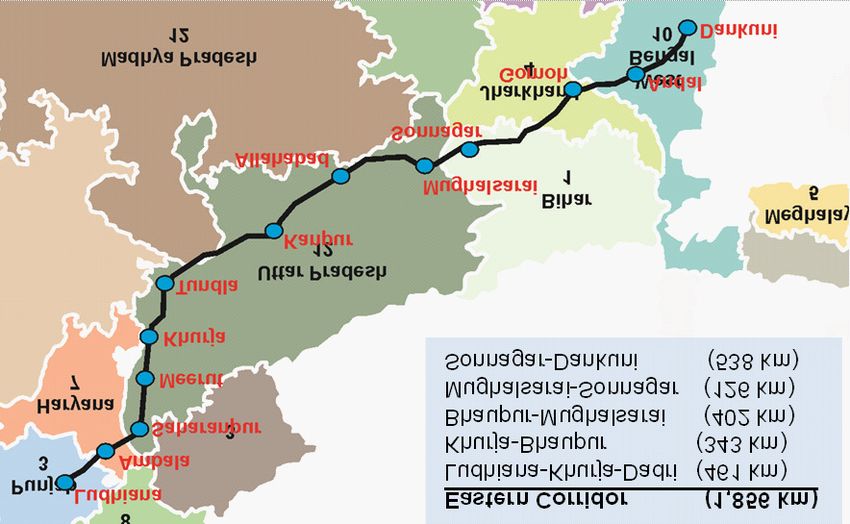
¾¾ The 1,856 km Eastern Dedicated Freight Corridor cost of Rs 51,101 crore22. The key funding agency for
(EDFC) is being developed between Ludhiana in the corridor is the Japan International Cooperation
Punjab to Dankuni in West Bengal at an estimated Agency (JICA), contributing a total of about Rs 38,772
cost of Rs 30,358 crore20. The key funding agency for crore (76% of the total cost of WDFC).
the corridor is the World Bank, contributing a total of
Rs 13,625 crore21 , (45% of the total cost of EDFC).
Figure 18: Route map of Eastern DFC Figure 19: Route map of Western DFC
Source: DFCCIL Source: DFCCIL
19
http://www.dfccil.gov.in/dfccil_app/Project_Funding
20
http://164.100.47.190/loksabhaquestions/annex/15/AU1357.pdf
21
http://164.100.47.194/Loksabha/Questions/QResult15.aspx?qref=2363&lsno=16
http://164.100.47.190/loksabhaquestions/annex/15/AU1357.pdf
22
22INCREASING RAIL SHARE IN FREIGHT TRANSPORT IN INDIA
¾¾ The traffic will mainly comprise containers from Cement: Cement forms about 10% of the total freight
JNPT and the ports of Mumbai, Pipavav, Mundra, moved on the railways both in terms of originating
and Kandla. Besides containers, other commodities tonnes and tonne kilometres moved, and it is the
moving on the Western DFC will be petroleum-oil- commodity with the second highest share in railway
lubricant (PoL) products, fertilizer, food grains, salt, freight revenues. However, this is a commodity for
coal, iron, steel, and cement. which the average leads (i.e. distance) carried on the
railways has been continually on the decline and both
Track renewal the Railway statistics and the numbers published by the
In addition to the investments made in infrastructure Cement Manufacturers Association of India show that
projects (new line, doubling, gauge conversion, and there has been an increasing shift of cement traffic away
electrification) discussed earlier, Indian Railways has from the railways onto roads. While the cement industry
been spending substantial amount of money towards has continually shown its interest in moving larger
track renewal. IR’s spending under the programme stood shares of their traffic by rail, they have been unable to
at Rs 15,741 crore during the Tenth Plan, Rs 15,918 crore do so and have cited several reasons ranging from high
during the Eleventh Plan, and Rs 20,448 crore during the costs of carriage to lack of wagons for carrying their
Twelfth Plan. The CAGR of investment related to track loads. Given the apparent interest shown by both the
renewal for the Tenth, Eleventh, and Twelfth plans are Railways and the cement industry in increasing cement
11%, 1%, and 9%, respectively. shares, this commodity becomes a natural first choice in
the commodity list chosen for this study.
Track renewals Automobiles: Auto plants are located at a handful of
6,000 locations in the country but transport finished vehicles
5,000 all across the country. Given these long-lead movements,
4,000
automobiles have a natural advantage in moving
Rs crore
3,000
2,000
by railways. Apart from the long-distance criterion,
1,000 automobile traffic is amenable to be aggregated into
0 train load. These factors make the ‘manufactured’
2015-16
2016-17
2012-13
2013-14
2014-15
2010-11
2011-12
2008-09
2009-10
2005-06
2006-07
2007-08
2002-03
2003-04
2004-05
automobile a perfect commodity to be moved by
rail. However, almost all the traffic of the automotive
10th PLAN 11th PLAN 12th PLAN
industry is moved by road transport. The Railways have
Figure 20: IR’s investment towards track renewals repeatedly, through measures, such as introduction of
Source: Annual reports, Indian Railways
special wagons and the Automobile Freight Transport
Operator (AFTO) service policy, shown interest in hauling
a greater volume and share of the automotive industry
traffic. However, the AFTO policy received a limited and
Rationale for selection of commodities lukewarm response until recently. Some interest has
The aim of this study is to identify the underlying factors been generated in the recent past; however, critical
which have resulted in such declining railway shares as traffic volume has not reached yet. Given the large
well as to draw up specific implementable strategies for growth potential projected for the automotive industry,
the Railways to retrieve some of its declining shares. In the study of freight movement of this industry, and
addition, the study would identify the barriers or hurdles identifying the limitations holding back its movement
which might exist in the present nature of operations via railways makes this an important commodity to
and organization of the Railways which might be limiting study.
the growth of the Railways.
Container: Largely driven by a services sector growth,
The rationale for the selection of each of the commodities India has been seeing a rapid growth in the white goods
mentioned herein is detailed as follows: and fast moving consumer goods markets. Given the
23You can also read