EURO project, 20 years on - europa.eu
←
→
Page content transcription
If your browser does not render page correctly, please read the page content below
IN-DEPTH ANALYSIS
Requested by the ECON committee

                       EURO project,
                        20 years on
               Monetary Dialogue January 2019

         Policy Department for Economic, Scientific and Quality of Life Policies
                  Author: Eddie Gerba (London School of Economics)
                       Directorate-General for Internal Policies                   EN
                              PE 631.037 - January 2019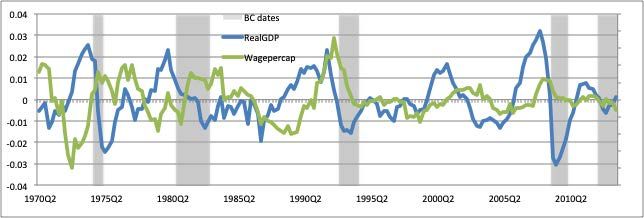
EURO project,
             20 years on
A critical assessment and the road ahead

   Abstract
   20 years have passed since EURO was first introduced in 1999.
   Several restructurings and crises later, the Monetary Union
   remains, but in a different shape and size to when it was first
   introduced.
   Against this background, the current paper critically explores the
   following dimensions of the Euro Area project: Credibility and
   stability, economic performance, uneven developments, and the
   main avenues/challenges for the project in the years to come.
   The document includes two comparative aspects: a domestic
   dimension from a historical perspective and a global comparison
   in terms of economic and monetary performance to other
   advanced economies during the past two decades.
   This document was provided by Policy Department A at the
   request of the Committee on Economic and Monetary Affairs.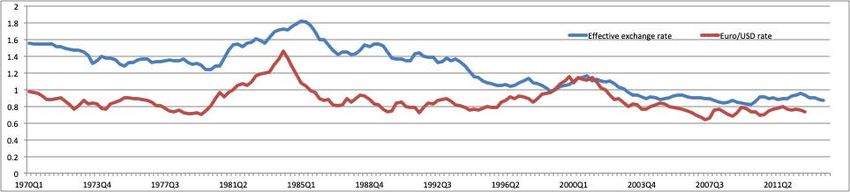
This document was requested by the European Parliament's Committee on Economic and Monetary
Affairs.

AUTHORS
Eddie GERBA, London School of Economics (E.E.Gerba@lse.ac.uk)

ADMINISTRATOR RESPONSIBLE
Dario PATERNOSTER

EDITORIAL ASSISTANT
Janetta CUJKOVA

LINGUISTIC VERSIONS
Original: EN

ABOUT THE EDITOR
Policy departments provide in-house and external expertise to support EP committees and other
parliamentary bodies in shaping legislation and exercising democratic scrutiny over EU internal
policies.

To contact the Policy Department or to subscribe for updates, please write to:
Policy Department for Economic, Scientific and Quality of Life Policies
European Parliament
L-2929 - Luxembourg
Email: Poldep-Economy-Science@ep.europa.eu

Manuscript completed in January 2019
© European Union, 2019

This document is available on the internet at:
http://www.europarl.europa.eu/committees/en/econ/monetary-dialogue.html

DISCLAIMER AND COPYRIGHT
The opinions expressed in this document are the sole responsibility of the authors and do not
necessarily represent the official position of the European Parliament.
Reproduction and translation for non-commercial purposes are authorised, provided the source is
acknowledged and the European Parliament is given prior notice and sent a copy.
For citation purposes, the study should be referenced as: GERBA, E., EURO project, 20 years on, Study for
the Committee on Monetary and Economic Affairs, Policy Department for Economic, Scientific and
Quality of Life Policies, European Parliament, Luxembourg, 2019.
EURO project, 20 years on

CONTENTS
LIST OF ABBREVIATIONS                                                                    4
LIST OF FIGURES                                                                          5
LIST OF TABLES                                                                           5
EXECUTIVE SUMMARY                                                                        6
1.   INTRODUCTION                                                                        8
2.   CREDIBILITY AND STABILITY                                                           9
     2.1.    Exchange rate volatility                                                    9
     2.2.    International currency status                                              11
     2.3.    Reserve currency status                                                    15
     2.4.    Capacity to deliver stable prices                                          17

3.   ECONOMIC PERFORMANCE                                                               19
     3.1.    GDP and income growth                                                      19
     3.2.    Income distribution and disparities inside the EMU                         21

4.   OPPORTUNITIES AND CHALLENGES AHEAD                                                 24
REFERENCES                                                                              26

PE 631.037                                             3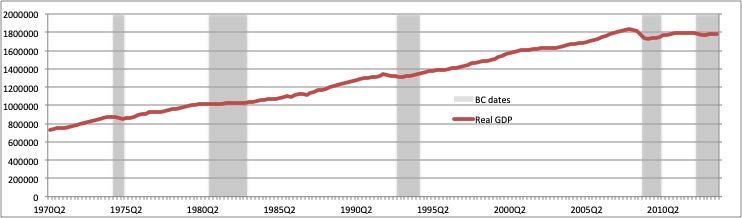
IPOL | Policy Department for Economic, Scientific and Quality of Life Policies

LIST OF ABBREVIATIONS

 CAD                Canadian Dollar

 CB                 Central Bank

 CHR                Chinese Rimmibi

 EA                 Euro Area

 EC                 European Commission

 ECB                European Central Bank

 EMU                European Monetary Union

 ESRB               European Systemic Risk Board

 EU                 European Union

 GDP                Gross Domestic Product

 HICP               Harmonized Index of Consumer Prices

 JPY                Japaneese Yen

 MU                 Monetary Union

 QE                 Quantitative Easing

 Trojka             EU rescue mission involving the European Commission, the ECB, and the IMF

 UMP                Unconventional Monetary Policy

 USD                United States Dollar

 UST                United States Treasury

                                                       4                                  PE 631.037
EURO project, 20 years on

LIST OF FIGURES

Figure 1:    Evolution of the effective exchange rate and the Euro/USD exchange rate                     9
Figure 2:    Evolution of the nominal and real effective exchange rate for Euro                         10
Figure 3:    Value of Euro in USD over time                                                             11
Figure 4:    Indices measuring the international role of the Euro                                       12
Figure 5:    International Monetary System in 2017:Q1                                                   13
Figure 6:    Distribution of allocated reserve currency around the globe                                15
Figure 7:    Share of USD and Euro of total global reserve currency                                     16
Figure 8:    Time-varying inflation in Euro area                                                        17
Figure 9:    Evolution of producer price (PPI) and consumer price indices (CPI) in Euro area            18
Figure 10:   Time-varying trend of real GDP in the Euro area                                            19
Figure 11:   Evolution of Euro area - and Global GDP in business cycle frequency                        20
Figure 12:   Evolution of GDP and wage per capita for EMU in business cycle frequency                   21
Figure 13:   Cluster Analysis for EMU in 2002                                                           22
Figure 14:   Cluster analysis for EMU in 2013                                                           23

LIST OF TABLES

Table 1:     Share of Euro in international monetary and financial markets                              14
Table 2:     Euro reserves in third-party central banks                                                 17

PE 631.037                                         5
IPOL | Policy Department for Economic, Scientific and Quality of Life Policies

EXECUTIVE SUMMARY
20 years after the EURO was first introduced, the economic and financial landscape looks very different.
The euro area has undergone geographical expansion, two severe financial crises, economic
stagnation, and a deepening. From the initial 11 members in 1999, the area has expanded to the
current 19 members. Moreover, realizing some of the shortcomings of the initial monetary union, the
project has deepened by including a (weak) fiscal backstop, extended capacities for the European
Central Bank, (imperfect) banking union, and a capital markets union in progress. However, these
changes have occurred during very difficult times involving a severe financial crisis, several sovereign
debt runs, and a stagnating growth in income.
Against this background, the time has arrived to critically assess the monetary union and explore in
detail some of the dimensions of the euro project. In particular, the current paper will focus on:
credibility and stability; economic performance; and the main avenues and challenges ahead.
Credibility and stability of the single currency in relation to its international dimension – e.g. in terms
of exchange rate movements, global payment currency shares, and in terms of capacity to deliver
stable prices. Economic performance of the monetary union in terms of long-term per capita GDP
growth compared to other advanced economies such as the US, Japan, UK, or other EU member states
outside of the euro area. Here, heterogeneities inside the union as well as uneven developments inside
and outside of the euro will also be considered. The paper will also briefly lay out the main threats,
challenges and opportunities for the Euro project in the years to come.
Euro has delivered a stable currency, both in terms of exchange rate and price stability target. The
effective exchange rate against a basket of major currencies (including USD, GBP, JPY, CHR, CAD) has,
since the introduction of the Euro in 1999 been more stable than at any point since 1970. It has also
fallen since the introduction of the Euro. Moreover, gap in nominal versus real effective exchange rate
has reduced, pointing towards an increase in purchasing power in the EMU. With respect to inflation,
the ECB has been successful in maintaining it close to its 2% target, although over recent times it has
consistently undershot it. Price levels, on the other hand, have indeed been more stable and grown
more moderately since 1999.
Empirical evidence shows that Euro has partially succeeded in achieving the goal of international
currency status. A new ECB index of the euro’s international role – computed as a simple arithmetic
average of the share of the euro across a broad range of indicators was at the end of the sample period
in 2018 lower than at the start of the Euro project. While its role increased at the early stages of the
Euro, it reverted starting from the sovereign debt crisis. Yet, a snapshot of the international monetary
system in 2017:Q4 shows that Euro remains the second most used currency, both for monetary and
financial settlements. It’s strongest position is in the global payment systems, and weakest in the
foreign exchange market. Despite the second position of the Euro, the distance to the USD remains
large, and represents on average a third of its volume.
In terms of economic performance, the EA economy enjoyed the longest period of growth around the
time it was formally established. If you compare to earlier episodes of upturns, the 15-year period
between 1996 and 2011 was the longest without any interruption or negative business cycle shocks.
However, this smoothness came at the cost of slower growth compared to previous historical episodes.
Since the establishment of the Euro and until the subsequent recession in 2011, GDP grew by 30%. In
contrast, during the previous expansion, GDP had grown by 40%. Expressed differently, the 30%
growth rate had been achieved in only 9 years during the previous upturn (1984-1993).
At the same time, the degree of disparity and uneven distribution in economic performance has indeed
increased over time inside the EMU. The North, represented by Germany, France, Netherland, Belgium,

                                                       6                                        PE 631.037
EURO project, 20 years on
Finland, and Austria remain at the core throughout, sharing a number of similarities. They experienced
low inflation all the way through and more recently, they share similar low long-term interest rates. On
the other hand, countries such as Spain and Ireland have increasingly distanced themselves from the
core. They were closer to the core at the launch of the single currency, suggesting an idea at the time
that they might converge towards it, but by 2013 the distance had increased considerably. Italy made
a U-turn during this period, evolving from a country closer to cluster 1 to a country in cluster 3. Even
within the cohort of the newly joined smaller member states, there is significant heterogeneity.
Countries that are geographically closer to the Northern core managed to perform better and climb
the cluster ladder compared to those further away (Grancay, et al., 2015). Buti and Turrini (2015) argue
that the post crisis challenges of managing divergence were exacerbated by the lack of structural
economic convergence in the preceding years.
While it is hard to speculate on the precise road ahead for the Euro, we look at a number of
opportunities and challenges ahead. This includes the recent policy packages (fiscal, structural,
financial) and the banking and capital-market unions. We also propose measures to boost Euro’s
international status, both as an asset and reserve currency. Most importantly, though, we look at the
challenges of boosting growth and reduce income disparities across the member states, and propose
a social contract 2.0 for the bumpy road ahead.
Questions for the Monetary Dialogue
• What are the concrete steps that the ECB expects to take in order to boost Euro as an international
currency? Is there an action plan or does it simply remain a political ideal?
• How challenged does the ECB feel about the emerging market currencies? How realistic do you
believe that JPY or CHR will take up the territory lost by the Euro since the sovereign debt crisis?
• Disparities in economic performance within the EMU have increased over the past decade. Looking
ahead, several EU member states are waiting to join the Euro. How do you expect to avoid further
divergences or disparities between EMU member states over the coming decade considering that
several candidate states have weaker economies and there is prospect of Low for Long?
PE 631.037 7IPOL | Policy Department for Economic, Scientific and Quality of Life Policies
1. INTRODUCTION
In 1999, one of the largest projects in monetary history had begun. A union of 11 European states had
decided to give up their national currencies, sovereignty in monetary policy, and an aggregate demand
booster for the sake of price stability, removal of currency transaction costs in trade, access to
international finance, and a common (political) objective. The idea was that only a monetary union
could lead to a genuine integration of markets in the EU, and pave the way to the Single Market.
20 years on, and the monetary-, economic-, financial-, and political situation are very different from
those early days. First, the monetary union has expanded in multiple ways. Currently, the number of
member states adds up to 19, and more are expected in the near future. Moreover, six other states are
using the currency without actually being a part of the union (Montenegro, Kosovo, Andorra, Monaco,
San Marino, and the Vatican City). Second, European economies have experienced challenging
economic times since the start of the 2007-08 financial crisis. At first, financial and real estate markets
were affected by the downturn in the US. However, as the number of bank bailouts increased and the
real economy became constrained by the poor financial performance, the problem turned from a
financial into an economic. Intra-euro area trade also declined as a result of falling income. It then
turned into a fiscal-and financial issue, which the union still struggles to recover from. Third, this wave
of shocks and poor economic performance has pushed the ECB into unchartered territory, both in
terms of number of policies it has employed and in terms of stretching its mandate. What has been
denominated as unconventional monetary policy has in the case of the euro area been unconventional
in terms of its size, composition, design, and reach, extending as far as into the territory of national
fiscal policies and political sovereignty. Fourth, out of the crises came a realization that the initial
monetary union was incomplete, and that in order to make it more resilient and shock absorbent, the
monetary union needed to be complemented by a banking-and financial market union. Over the past
years, a large share of union efforts has been put into integrating the banking market, increasing the
cross-border banking activities, creating a joint supervisory mechanism, and a coordinated
macroprudential platform (ESRB-ECB). Fifth, and as a result of these challenging times, the political
landscape has also changed. Anti-euro sentiment has increased, primarily in the countries subject to
the sovereign bailout rules. However, with fiscal strain and migration issues, the sentiment has spread
to other member states that were not subject to the Trojka (or equivalent debt restructuring plans).
Meanwhile, disparities in economic performance between different regions inside the EMU has
resulted in further divisions and segregation between the member states, and between the parties
within the member states, creating a tense and difficult political landscape for members of the
monetary union, as well as those outside of it but inside the EU.
In light of this, the time has come to reflect on the Euro project, assess its achievements and failures, as
well as speculate on the road ahead. In particular, this paper evaluates the following dimensions of the
MU: Credibility and stability of the single currency in relation to its international dimension - e.g. in
terms of exchange rate movements, global payment currency shares - as well as its domestic dimension
- e.g. in terms of capacity to deliver stable prices (inflation); economic performance of the Monetary
Union in terms of long-term per-capita GDP growth and in terms of uneven developments within the
union. The paper will finish by briefly speculating on the main opportunities and challenges for the
Euro project in the years to come.
8 PE 631.037EURO project, 20 years on 2. CREDIBILITY AND STABILITY A large part of the success of the Euro comes from its low volatility over time, its success in achieving price stability, and a strong and stable exchange rate against other global currencies. Its legacy comes from the strong and stable position of the Deutsche Mark, which for decades provided a solid benchmark for many other European currencies. Institutional set-up of the EMU, and ECB in particular, has largely ensured that this tradition is continued. With 20 years of track record, it is time to evaluate Euro’s performance and achievements in terms of stability and credibility. 2.1. Exchange rate volatility Under non-turbulent (or normal) times, the relative strength of a currency with respect to its peers is determined by mainly three factors in the foreign exchange market. The market is one of the biggest financial markets in the world and trades 5.3 trillion USD a day. The demand for the currency is determined by the interest rate. The higher the interest rate, the more the currency appreciates, and investors will exchange their currency holdings for the more valued currency. They proceed to save it in that country’s bank (or paper) to receive a higher return. The value of the currency is also determined by the money supply. The higher the money supply (i.e. the lower the interest rate), the higher the inflationary pressure is in the economy, pushing the real value of the currency down. Finally, the rate of growth of the economy and the degree of confidence in the financial system of that currency determines the demand for its goods and services. The higher the rate of growth and confidence, the higher the demand for that country’s goods and services from abroad, and consequently the higher the demand for its currency. The common difficulty in valuing the currency is the fact that the exchange rate is a relative price, which requires the analyst to value the three factors above of the currency of the host economy relative to that of the foreign economy (economies). For the Euro, the track record has, so far, been good. The effective exchange rate against a basket of major currencies (including USD, GBP, JPY, CHR, CAD) has, since the introduction of the Euro in 1999 been more stable than at any point since 1970, as Figure 1 shows. The figure depicts the evolution of the Euro since 1970. For the pre-1999 period, the series had been constructed as an index using weighted shares of the constituent currencies of the current Euro. Two things are evident from the graph. First, the exchange rate has decreased since the formal introduction of the Euro. Notice that the trend of the effective exchange rate has been downward sloping. Second, the exchange rate with respect to the major currencies has lied just below 1 ever since early 2000’s. Figure 1: Evolution of the effective exchange rate and the Euro/USD exchange rate Source: Gerba et al (2017a). PE 631.037 9
IPOL | Policy Department for Economic, Scientific and Quality of Life Policies
With respect to the nominal versus real effective exchange rates in Figure 2, we see considerable
differences between the two prior to the Euro introduction. While the nominal rate has increased over
time, the real rate has maintained a relatively constant fluctuation around 100. This means that over
time, inflation differential has been reduced so that the nominal and real exchange rates have been
brought to very similar levels. In other words, the purchasing power of Euro Area has increased over
time to such extent that, relative to the other major global currencies, investors and economic agents
in EA can buy more of foreign goods and services. The reasons behind this can be several, including a
better control of domestic inflation, worse control of inflation abroad, higher demand for the domestic
currency, lower demand for foreign currency, higher domestic productivity, or lower productivity in
the foreign economies. In the case of the Euro, the first factor has a very high contribution since inflation
has remained low and stable in the entire union, and for some member states much lower than the
inflation rate enjoyed prior to joining the Euro.
Moreover, since mid-2000 the effective exchange rate against the basket of goods has lied somewhere
between 90 and 110. Together with the previous graph, this shows that the exchange rate with most
major currencies has remained stable, an important achievement of the Euro project.
Figure 2: Evolution of the nominal and real effective exchange rate for Euro
Source : Gerba et al (2017a).
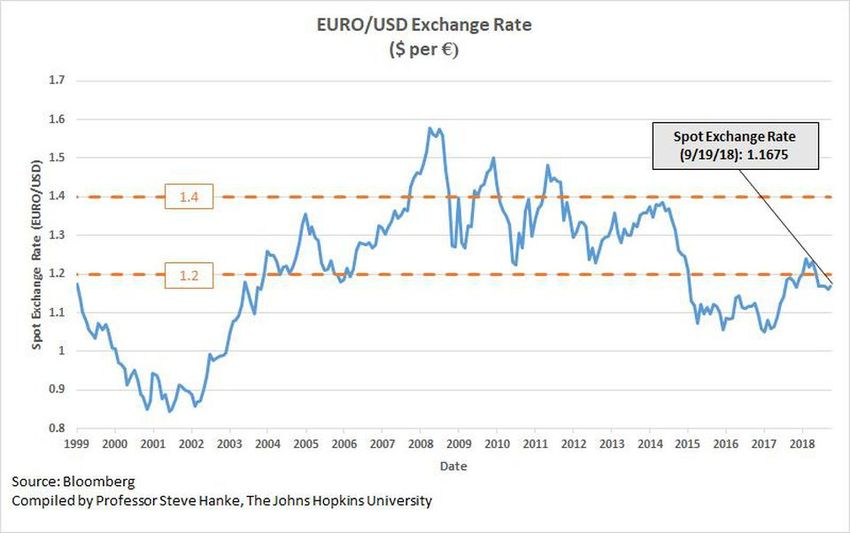
A closer look at the USD-to-EUR exchange rate in Figure 3 confirms this stability since 2004. Ever since
the Euro surpassed parity in 2003, it has fluctuated somewhere between 1.1 and 1.5 USD per Euro.
Considering that this interval has remained constant for 15 years (despite the turbulent times), this
interval could be taken as the fair value of the Euro with respect to the USD. Hanke (2018) goes even
further to propose that in order to induce further stability in trade and cross-border financial
transactions, these two largest global currencies should, via a formal agreement, trade at between 1.2
and 1.4 USD per Euro. Under such peg, the ECB would be obliged to maintain this peg interval by
defending a weak Dollar via Dollar purchases. Likewise, the UST would be obliged to defend a weak
euro by purchasing Euros. When the Euro-Dollar exchange rate was less than 1.20 USD per Euro and
the Euro was weak in Figure 3, the UST would have been purchasing euros. When the Euro-Dollar
exchange rate was above 1.40 USD per Euro and the Dollar was weak, the ECB would have been
purchasing Dollars.
10 PE 631.037EURO project, 20 years on Figure 3: Value of Euro in USD over time Source : Steve H. Hanke (2018). 2.2. International currency status A currency acquires the status of international money if it assumes the role of a vehicle in international transactions, if it is used internationally to denominate assets, and if it is stored as official reserve. During its early days, ECB argued that the economic size of the country, a sound institutional and regulatory framework of the issuing economy as well as the previous use of the currency are fundamental determinants of international money (Issing, 2003). The key issue here is whether EMU and ECB have achieved this, and if other factors may interfere in a currency’s international status. Before assessing, however, let us first look at the specific concepts that ECB uses to self evaluate. In relation to economic size, Issing (2003) mentions GDP and a country’s degree of openness as two determining factors for a currency’s international status. Regarding the second, a large cross-border trade volume generally implies lower transaction costs in using this country's currency to channel global trade. If traders find it convenient to use this country's currency as a means of exchange also for transactions with other countries' traders, then it becomes a vehicle currency and its status is enhanced to international money. More recently, the depth and width of financial markets of a country has also been pointed out as an important economic determinant since the likelihood that its money is chosen as an international currency is higher. Large and liquid markets imply low transaction costs. In other words, to conduct their financial transactions, foreign agents have an economic incentive to use this country's financial markets or financial instruments denominated in its currency as opposed to another currency with larger transaction costs. The role of institutions, political stability, and good governance in the issuing country provides important supporting infrastructure for agents using that currency, as well as their confidence in it. Thus, the country with a wise fiscal authority, a sound legal and judicial system, efficient regulatory authorities and with a monetary authority geared towards achieving price stability is more likely to have its currency used as international money. In this regard, price stability is an important precondition for the development and maintenance of the international role of a currency. It is a necessary condition for foreign investors' confidence that their purchasing power will be preserved. Internal monetary stability is also a precondition for external stability in the sense of contributing to lower exchange rate volatility and helping in preserving the confidence in the currency (Issing, 2003). PE 631.037 11
IPOL | Policy Department for Economic, Scientific and Quality of Life Policies
Lastly, past track record of the currency is equally important (Issing, 2003). Traders' preferences for a
specific currency appear to change very slowly, because imperfections in goods and asset markets
generate economies of scale in using the existing currency. As often pointed out, the pound sterling
kept its international status for decades despite the strength of the US economy relative to the British
economy. In the case of the Euro, the track record is still very short, and continues to partially rely on
the attainments of its main constituent, Deutsche Mark.
Empirical evidence shows that Euro has partially succeeded in achieving this goal. A new ECB index of
the euro’s international role – computed as a simple arithmetic average of the share of the euro across
a broad range of indicators was at the end of the sample period in 2018 lower than at the start of the
Euro project (ECB, 2018). While its role increased at the early stages of the Euro, it reverted starting from
the sovereign debt crisis.
Figure 4: Indices measuring the international role of the Euro
Source: ECB (2018).
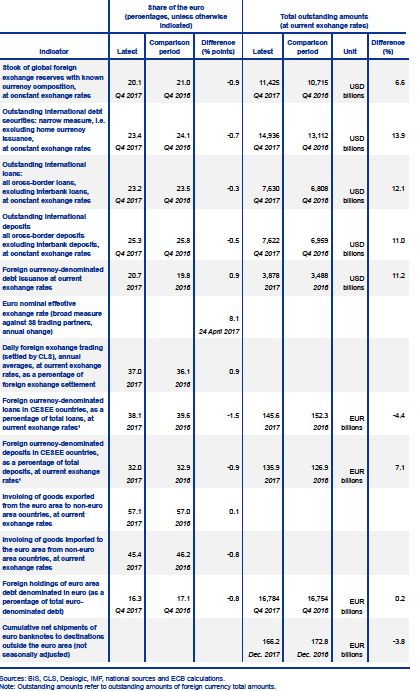
Yet, a snapshot of the international monetary system in 2017:Q4 shows that Euro remains the second
most used currency, both for monetary and financial settlements. It’s strongest position is in the global
payment systems, and weakest in the foreign exchange market. Despite the second position of the
Euro, the distance to the USD remains large, and represents on average a third of its volume.
However, a longitudinal analysis shows that in some of the international markets the share of the euro
has declined. In particular, this was the case for outstanding amounts of international debt,
international deposits, and for shipments of Euro banknotes to destinations outside the Euro area.
Likewise, other persistent factors continue to supress the international role of the Euro. One such factor
is the increasing importance of emerging market economies as issuers of foreign currency debt since
the global financial crisis. This may explain some of the decline in the share of the Euro in international
debt markets despite the historically low levels of interest rates prevailing in the Euro Area. Many
emerging markets have a traditional preference for the US dollar. Another factor is the on-going
deleveraging by Euro Area banks, which have cut lending abroad to restore their capital ratios. The
12 PE 631.037EURO project, 20 years on stock of cross-border loans in Euro remains well below its peak prior to the global financial crisis of 2007-08. Figure 5: International Monetary System in 2017:Q1 Source: ECB (2018). PE 631.037 13
IPOL | Policy Department for Economic, Scientific and Quality of Life Policies

Table 1:          Share of Euro in international monetary and financial markets

Source: ECB (2018).

Reconnecting with the three categories of factors, it is accurate to say that the EA partially satisfies the
first two. While the economy grew during the first decade of the Euro project and the financial system

                                                       14                                        PE 631.037
EURO project, 20 years on expanded, times have been very challenging since the onset of the 2007-08 financial crisis. In particular, since the sovereign debt crises, the economy has stagnated and the financial system has contracted. Moreover, the confidence in the global financial system remains well below the 2007 level, which may put further downward pressure on the international usage of the Euro. In relation to the second category of factors, times have been equally challenging for the ECB and the Eurosystem. While ECB showed determinism in maintaining price stability even during the most turbulent times, and intervened in markets to reassure confidence, over the past 7 years it has undershot its target. Moreover, while the Single Supervisory Mechanism has brought the EA financial regulation under one roof, the step may not be enough in order to generate the confidence in its financial and judicial system (considering the lack of fiscal union, partial risk sharing mechanism, and a lack of solid backing of the Euro in international transactions). It should therefore be the focus of the EMU to improve its regulatory and governance aspects so to provide the necessary infrastructure that can boost the confidence in its monetary system. Deeper and better connected European capital markets, for instance as a result of moving towards an EU capital markets union, as well as a completed banking union, may contribute to the depth and liquidity of euro area financial markets. This could be the next step to improve the international standing of the currency. 2.3. Reserve currency status Another important aspect of an international currency is its use as reserve in third-country central banks. Reserve assets include exchange resources, foreign securities, and gold reserves (Puszer, 2014). Figure 6 reports the composition of world’s allocated foreign exchange reserves. First, there has been a relative stability of participation of main currencies over time, even in the period after 2012. Second, the dominant position of the USD has remained unchallenged throughout the sample period. Third, the importance of the Euro has slightly increased over time, as the share of that currency in allocated reserves surpassed 20% around mid-2000’s. However, since the financial crisis, the share has started to decline. Fourth, the share of other currencies, in particular emerging market, has increased substantially over the last few years in the sample, positioning as a close third to the Euro. Although Euro is the second largest reserve currency, it is much smaller (both in absolute volume terms and percentage share) to the dominant position enjoyed by USD. Figure 6: Distribution of allocated reserve currency around the globe Source: Puszar (2014). In terms of the geographical distribution in the use of reserve currency, it is obvious that Euro is the dominant foreign currency in the non-euro EU, with a significantly smaller share outside of the EU PE 631.037 15
IPOL | Policy Department for Economic, Scientific and Quality of Life Policies

(Puszer, 2014). Yet, even inside the EU, the shares look very different across countries. While Euro has a
dominant position in the smaller Eastern European countries, in Poland and Sweden the share is much
smaller, and has declined over time. Likewise, outside of the EU, the share declined in other
industrialised countries such as Canada, Norway, and Turkey. Yet in bigger G7 economies, such as the
UK, Russia, and even the US, the share increased. Thus, we see a very mixed picture for the Euro. On one
hand, it enjoys a dominant position in the smaller non-euro Eastern European countries and some of
the largest G7 economies such as the UK and the US. On the other hand, it has lost terrain over time in
other non-euro European economies such as Poland, Sweden and Norway, as well as in the larger
advanced economies such as Canada, Russia and Turkey. It is possibly this high level of heterogeneity
across geography and time that impedes the Euro from becoming a truly international reserve currency
across the board. In order to gain that international status, the confidence in it needs to remain
geographically solid and constant over a long period of time.
A direct comparison with the USD for a period of 20 years in Figure 7 further confirms this. The
combined share of the dollar and euro has declined over the past 20 years as the use of other
currencies, including the Chinese renminbi and British pound, increased substantially. They climbed
from about 11% to 17 % of the global total. Setting aside the other currencies, the dollar reserves were,
on average, 3.5 times as large as euro reserves over this period. But the pattern over time has been
highly volatile. In 1999, the share was 4:1 for the USD. It steadily declined until 2009, when the share of
dollar reserves was only 2.2 times as large as the value of euro reserves. Since then, dollar reserves grew
slightly, while euro reserves declined by 27%, ending at 3.1 times as many dollars as euros in central
banks by 2017 (Maggiori, 2018).

Figure 7:          Share of USD and Euro of total global reserve currency

Source: Maggiore et al (2018).

                                                       16                                       PE 631.037
EURO project, 20 years on Table 2: Euro reserves in third-party central banks Source: Puszer (2014). 2.4. Capacity to deliver stable prices The success that is usually attributed to the EMU and ECB is its consistent and aggressive pursuance of price stability. Continuing the legacy from the Deutsche Bundesbank, the ECB has as its first and main objective to maintain price stability. Figure 6 depicts the evolution of the HICP inflation since 1999. For the early part of the project, it is clear that the capacity to deliver stable prices was strong. Up to 2008, inflation fluctuated between 1.5 and 2.5%, or very close to the 2% target. However, during the second half of Euro’s short history, swings in inflation became much heavier. The interval in which inflation fluctuated increased to between -0.5% and 4%. At a first glance, it seems that ECB’s capacity to deliver stable prices has been significantly undermined since the onset of the 2007-08 financial crisis. Figure 8: Time-varying inflation in Euro area Source: ECB Data Warehouse (retrieved on 15.01.2019). PE 631.037 17
IPOL | Policy Department for Economic, Scientific and Quality of Life Policies

Turning to price levels in Figure 7 (the explicit target of the ECB), the graph portrays a more positive
picture. While both the consumer and producer price indices have increased over time, their increase
has been much more moderate and smooth since the formal introduction of the Euro, in particular for
consumer prices. Thus, while ECB’s capacity to deliver stable 2% inflation has been significantly
undermined since the 2007, price levels have been more stable and grown more moderately, in
particular from a longer historical perspective.

Figure 9:          Evolution of producer price (PPI) and consumer price indices (CPI) in Euro area

Source: Gerba et al (2017a).

                                                       18                                    PE 631.037
EURO project, 20 years on 3. ECONOMIC PERFORMANCE The next level in the performance analysis of the EA concerns the subject that matters the most to citizens of the union: economic growth and the degree of equality in the distribution of that income. This issue is very complex and consists of many layers. It includes the distinction between growth in aggregate income versus other more disaggregate or microeconomic indicators, union wide GDP performance over time, growth in income versus wealth, difference between union-wide growth and growth in each of the member states, or the growth and distribution of income within the member states. While it is impossible to include all aspects on the topic of economic performance in this paper, we will try to discuss two of these layers. First, we will investigate the Euro area wide GDP performance over time, including trend versus cycle, and with respect to the evolution of income and global GDP. Second, we will analyse the disparities in income distribution across member states of the monetary union. 3.1. GDP and income growth To begin with, let’s have a look at the long-run evolution of EA GDP since 1970:Q2 in Figure 10. Again, for the pre-Euro period, the series was constructed using the individual country GDP figures and their respective weights. This long-run series is useful in order to directly contrast the performance of the union economy before and after its formal establishment. The first striking observation is that the EA economy enjoyed the longest period of growth around the time it was formally established. If you compare to earlier episodes of upturns, the period between 1996 and 2011 was the longest without any interruption or negative business cycle shocks. By 2010 GDP had started to decrease, but it wasn’t until 2011 that the CEPR Business Cycle Committee considered it sufficient to call it a recession (the shaded grey area in the graph). Thus, to grow 15 years uninterruptedly is amazing. A priori it is not clear how much of that growth is down to the establishment of the Euro, but the date coincides well with the second phase of the convergence process, and later with the formal introduction of the currency. Moreover, unlike the US, EA avoided the dot.com bust in 2001-02, at which point the common monetary policy was already in place and which it managed to avoid. However, it is probable that this smoothness came at the cost of slower growth compared to previous historical episodes. Since the establishment of the Euro and until the subsequent recession in 2011, GDP grew by 30%. In contrast, during the previous expansion, GDP had grown by 40%. Expressed differently, the 30% growth rate had been achieved in only 9 years during the previous upturn (1984- 1993). Figure 10: Time-varying trend of real GDP in the Euro area Source: Gerba et al (2017a). PE 631.037 19
IPOL | Policy Department for Economic, Scientific and Quality of Life Policies
Since 2010, however, GDP growth has basically flattened, and has remained at roughly the same level
throughout. Thus, in terms of GDP levels and GDP growth, the introduction of the EMU had resulted in
an unprecedented period of uninterrupted expansions, but with a (relative) cost in terms of lower GDP
growth rates, in particular since the sovereign debt recession.
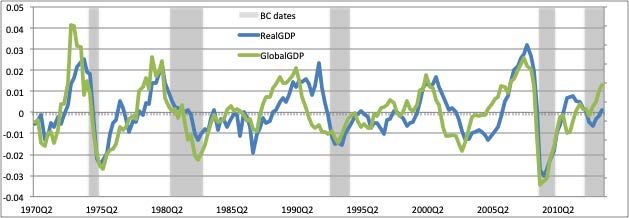
Turning to the business cycle evolution of EA GDP, and comparing it to the global GDP in Figure 11, the
EA series lags slightly the global GDP. It means that upturns (as well as downturns) first begin in global
income before they spill over to EMU. Otherwise, both series are tightly correlated which means that
EA is a very open economy and highly influenced by the movements in the global market. With respect
to the EA business cycle, we see again that the economy enjoyed an unprecedented period of smooth
growth during the first part of the EMU project, but experienced historically the largest contraction
during its second decade.
Figure 11: Evolution of Euro area - and Global GDP in business cycle frequency
Source: Gerba et al (2017b).
Turning to wage per capita in Figure 12 (a common measure of the income level per person) we find
that ever since the introduction of the Euro, income volatility has dropped. Compared to early 1990’s
or 1980’s, swings in income were 50% to 70% smaller, even during the period of sovereign debt turmoil.
The downside is that growth in income has also been much more moderate, both in historical
perspective, and compared to GDP. Compared to previous episodes, growth in wage per capita was,
on average, 2 to 3 times smaller. Compared to the business cycle, income growth has also been, on
average, 2 to 3 times smaller since 1999. Prior to that, on the other hand, growth in wage per capita
had been similar to that of GDP and sometimes even larger. Thus, income stability (or lower volatility)
has also come at the cost of lower income growth, similar to GDP.
20 PE 631.037EURO project, 20 years on
Figure 12: Evolution of GDP and wage per capita for EMU in business cycle frequency
Source: Gerba et al (2017b).
3.2. Income distribution and disparities inside the EMU
There are many ways in which the distribution of income across countries can be examined. One way
would be to look at the individual GDP patterns and compare to the aggregate EA series. While simple,
this method suffers from three shortcomings: The size of the EMU has changed over time which makes
it problematic to compare the EA GDP to an individual country’s GDP prior to joining the monetary
union. Also, GDP is a bad distributional measure, overlooking many other important income and wealth
variables. Finally, an aggregate measure such as GDP tells us very little of the deep underlying (or
structural) factors that make countries grow at different rates. For that, more disaggregate or
complementary information is required.
Haynes and Haynes (2016) propose a more comprehensive method to examine the degree of evenness
in economic pattern between the member states of the EMU. They use Agglomerative Hierarchical
Cluster Analysis (Bailey, 2012) to explore country patterns and to hypothesise about country cluster
sets. The hypothesis that certain clusters exist is then tested using conventional bivariate analysis. This
method starts from the assumption that all countries are different and then seeks to group them into
hierarchical clusters on the basis of their similarity. They repeat the cluster analysis for two different
time periods: 2002 (representing the episode of the EMU) and 2013 (more recent period). The approach
allows for the possibility that countries may change cluster membership over time. The authors use
several macroeconomic variables that measure economic performance, besides the Maastricht
convergence criteria, to build a multivariate cluster analysis. The study also includes other variables
regarding the general business environment (for further details on the variables and method, see the
Haynes and Haynes (2016) paper).
Figure 13 depicts the results of the cluster analysis for 2002, using the twelve countries that were
members of the Euro at that point. 1 Three main clusters are formed at point 5 on the horizontal axis.
The first comprises France, Germany, Netherlands, Austria, Finland and Belgium. Second cluster
includes Ireland and Spain. They share some proximity to the first cluster. Third cluster comprises of
Greece, Portugal and Italy. Luxembourg is an outlier. Authors find that mainly four factors influenced
1
The grouping in cluster analysis goes from the left of the dendrogram, according to the basis of their mathematical
similarity. If two small groupings are fairly similar, the hierarchical analysis links them together at the next step (point 5 on
the horizontal axis).
PE 631.037 21IPOL | Policy Department for Economic, Scientific and Quality of Life Policies
the clustering of the countries in 2002: state control of regulation, labour productivity per hour worked,
consumer confidence and HICP. Notice that all the variables are linked to consumer characteristics and
household income.
Figure 13: Cluster Analysis for EMU in 2002
Source: Haynes and Haynes (2016).
Based on this, the clusters can be characterised as (Haynes and Haynes, 2016):
Cluster 1: High productivity, low inflation, low regulation, and average confidence.
Cluster 2: Average productivity, high inflation, average regulation, and high confidence.
Cluster 3: Low productivity, average inflation, high regulation, and low confidence.
In the 2013 cluster analysis, the new EMU member states had been included. Figure 14 reports the
clustering results. In cluster 1, the core countries of Austria, Germany, Netherlands, Belgium, France and
Finland remained, but were joined by a new member, Slovakia. Cluster 2 is comprised of three new,
small economies: Latvia, Malta and Estonia. Cluster 3 is now instead a mixture of cluster 2 and 3 from
2002 and includes Italy, Spain, Portugal and Ireland. New members also join them: Slovenia and Cyprus.
Luxembourg remains as an outlier, but is by this time joined by Greece (Haynes and Haynes, 2016).
Overall, cluster 1 is the only one that roughly remained the same throughout the sample period.
Clusters 2 and 3 have changed dramatically. Considering that the total number of clusters is assumed
to remain the same throughout time, this means that significant divergences have occurred within the
EMU over a decade only. There seems to be a higher degree of heterogeneity across economies of the
EMU in 2013 compared to 2002.
22 PE 631.037EURO project, 20 years on Figure 14: Cluster analysis for EMU in 2013 Source: Haynes and Haynes (2016). The only variable to remain influential on both the 2002 and 2013 models is labour productivity per hour worked (Haynes and Haynes, 2016). On the other hand, in 2013 it is aggregate income and financial variables that matter more: GDP growth, interest rates, and government gross debt. Thus, unlike the early stages of EMU, aggregate economic performance has mattered more for defining disparities across EA in more recent times. The 2013 clustering groups are defined as follows: Cluster 1: Average GDP growth, low interest rates, high labour productivity, and average government gross debt. Cluster 2: High GDP growth, average interest rates, low labour productivity, and low government gross debt. Cluster 3: Low GDP growth, high interest rates, average labour productivity, and high government gross debt. To summarise, the degree of disparity and uneven distribution in economic performance has indeed increased over time inside the EMU. The North, represented by Germany, France, Netherland, Belgium, Finland, and Austria remain at the core throughout, sharing a number of similarities. They experienced low inflation all the way through and more recently, they share similar low long-term interest rates. On the other hand, countries such as Spain and Ireland have increasingly distanced themselves from the core. They were closer to the core at the launch of the single currency, suggesting an idea at the time that they might converge towards it, but by 2013 the distance had increased considerably. Italy made a U-turn during this period, evolving from a country closer to cluster 1 to a country in cluster 3. Even within the cohort of the newly joined smaller member states, there is significant heterogeneity. Countries that are geographically closer to the Northern core managed to perform better and climb the cluster ladder compared to those further away (Grancay, et al., 2015). Buti and Turrini (2015) argue that the post crisis challenges of managing divergence were exacerbated by the lack of structural economic convergence in the preceding years. PE 631.037 23
IPOL | Policy Department for Economic, Scientific and Quality of Life Policies

4. OPPORTUNITIES AND CHALLENGES AHEAD
It is very difficult to speculate on the road ahead for the EMU considering the turbulent developments
so far, in particular during the second decade following Euro’s launch. As shown in section 3.1, the EA
economy is very open and highly synchronised with the global economy. Moreover, Gerba and Leiva-
Leon (2018) show that the level of exposure to US macro-financial developments is very high, in
particular on the financial side. Therefore, the impact of global factors, global shocks or structural
changes is hard to anticipate. However, taking the ceteris paribus assumption seriously, we could
speculate on the institutional, monetary, and economic road ahead for the EMU, their opportunities as
well as challenges.
The sovereign debt crisis and the subsequent events exposed some of the weaknesses in the initial
EMU design. During turbulent times, price stability and confidence in the currency could not be
maintained with conventional monetary tools only. Unconventional measures became necessary, and
additional agreements on fiscal support, structural economic policy, and financial regulation and
integration were quickly needed. While steps have been taken in that direction, they are not sufficient
and, as the time goes by, self-complacency and sense of stability may take over again. The current
problem is that the agreements (or reforms) don’t go far enough.
Fiscal support is not the same as joint fiscal action. A joint fiscal action (even if only implicit) is
necessary going ahead. Structural economic policy is a long-term objective and therefore has to be
dynamically consistent. Quick fixes are not a good substitute and persistent commitments needs to be
assured. Room for fiscal-, monetary-, and welfare policy relief needs to be given in order to support the
agents through those structural changes. Potential benefits of those changes are two-fold. Income
disparities inside the EMU will reduce while boosting the international status of the currency as the size
of the union economy grows. Financial integration is key to further monetary stability and to boost
the currency’s international status, both as an asset and reserves. Banking-and capital markets union
go in the right direction, but stop short. Their largest drawback is that it is of regulatory nature. It
focuses more on the regulatory and supervisory aspects than the operational, risk, logistics, global
market developments, and market challenges, in particular under the Low for Long scenario. European
politicians and policy-makers must understand that regulatory and supervisory infrastructure is a
necessary but not sufficient condition in order to ensure financial market integration. Moreover, in the
case of EMU, integration needs to go hand in hand with deepening in financial services, which requires
innovation, R&D, and market-based alternatives. Those can’t be regulated, but incentivised, supported,
and, in best of cases, directed. Also high-level expertise amongst policy-makers is required on this front
in order to safeguard a workable solution and optimal policy plan.
In relation to Euro’s status as international money, the situation is more challenging. The distance to
the USD is huge, and the distance between the Euro and emerging market currencies is quickly
narrowing, in particular in the reserve and debt markets. The above policy suggestions can partially
improve Euro’s status, but more affirmative and reassuring actions will be required on the global arena.
So far, the discussion on Euro as a global currency have mostly been theoretical and archetype, with
little action to back it. Most of the track record of the Euro rests on the reputation and historic
performance of the Deutsche Mark. If Euro is to challenge the USD dominance, then the involvement
of ECB, Eurosystem, EC, and Treasuries of the EMU in the international monetary system must be more
aggressive and reassuring. Examples include advantages given to third-party countries and their
central banks for holding Euros. At the same time, assurance must be given that debt and assets issued
(or even denominated) in that currency will not be neglected or allowed to default. Only then can the
confidence in the currency grow, and with time, challenge the position of the USD.

                                                       24                                      PE 631.037
EURO project, 20 years on Finally, in relation to the union’s economic performance and the rising disparities amongst EMU member states, two things need to be recognised. First, there was a trade-off in EMU’s economic growth performance. Stability and lower volatility was prioritised over heavy and quick growth. Second, disparity in income and other macroeconomic indices has increased within the union over time, in particular over the past decade. The longer the Euro remains in low growth environment, the higher the risk that disparities will increase. Thus, most efforts should be put into steering the economy back into sizeable growth. At the same time, a type of Euro-wide social contract may be required in order to bring all the parties on board (labour, capital and technology owners, financiers, politicians, and charities) to ensure growth commitment and smooth path ahead. Most probably, it will need to be constructed and enacted across-border. Ultimately, it should be seen as a type of social contract 2.0, updating, innovating, and going further on the original post-war social contract that was established throughout Western Europe during the Golden Age. PE 631.037 25
IPOL | Policy Department for Economic, Scientific and Quality of Life Policies

REFERENCES
•    Bailey, K. (2012), “Sociological Classification and Cluster Analysis” In Cluster Analysis Byrne, D.,
     Uprichard, E., Eds.; Sage: London, UK; Volume 2: pp. 83–98.
•    Buti, M.; Turrini, A. (2015), “Three waves of convergence. Can Eurozone countries start growing
     together again?” VOX CEPR's Policy Portal, 17 April 2015; 1–6.
•    European Central Bank (2018), “The International Role of the Euro”, Interim Report, June 2018.
     https://www.ecb.europa.eu/pub/pdf/ire/ecb.ire201806.en.pdf.
•    Gerba E. (2015), Financial Cycles and Macroeconomic Stability: How Secular is the Great Recession?
     LAP Lambert Academic Publishing, Saarbruecken, Germany. ISBN 978-3-659-68911-6.
•    Gerba, E., Jerome, H., and Zochowski, D. (2017a), Structural Changes in the Euro Area: Evidence
     from a New Dataset, Forthcoming in ECB Working Paper Series.
•    Gerba, E., Jerome, H., and Zochowski, D. (2017b), How Profound are Euro Area Macro-Financial
     Linkages? Stylized Facts from a Novel Dataset, Forthcoming in ECB Working Paper Series.
•    Gerba, E. and Leiva-Leon, D. (2018), Macro-Financial Linkages in a Changing World, mimeo.
•    Grancay, M.; Sumilo, E.; Vveinhardt, J. (2015), “Trade in Central and Eastern European Countries Ten
     Years after Their EU Accession—Is there Convergence?” Soc. Econ. 37: pp. 443–460.
•    Hanke, H. S. (2018), “To Stabilize The World, Stabilize the USD/Euro Exchange Rate”, Forbes 21
     September, 2018: https://www.forbes.com/sites/stevehanke/2018/09/21/to-stabilize-the-world-
     stabilize-the-usdeuro-exchange-rate/#75bb77fa2303.
•    Haynes, P. and Haynes, J. (2016), “Convergence and Heterogeneity in Euro Based Economies:
     Stability and Dynamics” Economies 4(16)
•    Issing, O. (2003), “The Euro, a Stable International Currency”, speech given in Budapest, at the
     Academy of Sciences, 27 February 2003. Details of the speech can be found on:
     https://www.ecb.europa.eu/press/key/date/2003/html/sp030227.en.html.
•    Maggiori, M., Neiman, B., and Schreger, J. (2018), “The Rise of the Dollar and the Fall of the Euro as
     International Currencies”, Chicago Booth mimeo.
•    Puszer, B. (2014), “The Euro as an International Currency in the Official Sector”, Journal of
     Economics and Management 16

                                                       26                                       PE 631.037
20 years have passed since EURO was first introduced in 1999. Several restructurings and crises later, the Monetary Union remains, but in a different shape and size to when it was first introduced. Against this background, the current paper critically explores the following dimensions of the Euro Area project: Credibility and stability, economic performance, uneven developments, and the main avenues/challenges for the project in the years to come. The document includes two comparative aspects: a domestic dimension from a historical perspective and a global comparison in terms of economic and monetary performance to other advanced economies during the past two decades. This document was provided by Policy Department A at the request of the Committee on Economic and Monetary Affairs. PE 631.037 IP/A/ECON/2019-04 Print ISBN 978-92-846-4496-4 | doi:10.2861/859902 | QA-04-19-028-EN-C PDF ISBN 978-92-846-4495-7 | doi:10.2861/27741 | QA-04-19-028-EN-N
You can also read