One Coin, Many Markets - How Market Frictions Affect Arbitrageurs - Anne Haubo Dyhrberg
←
→
Page content transcription
If your browser does not render page correctly, please read the page content below
One Coin, Many Markets - How Market
          Frictions Affect Arbitrageurs ∗
                           Anne Haubo Dyhrberg

                            University of Sydney

                              November 24, 2020

                           Link to Latest Version

                                     Abstract
          This paper investigates how different levels of financial integration
      affects price differences and trading activity. I use the global bitcoin
      market, as cryptocurrency exchanges have different levels of financial
      integration and transactions between exchanges are recorded on the
      blockchain. I therefore identify how arbitrageurs adapt to different
      market frictions. The results show that when arbitrageurs have to use
      fiat currencies as quote currencies or comply with capital control reg-
      ulation, the price differences increase, and arbitrage activity decrease
      compared to a pure blockchain arbitrage process. The results have
      implications for international financial integration and the discussion
      of central bank digital currencies.
      JEL classification: G15, G14
      Keywords: Arbitrage, Market Frictions, Blockchain, Bitcoin

  ∗
    I would like to thank Angelo Aspris, Sean Foley, Jiri Svec, Albert Menkveld, Arjen
Siegmann and Wilko Bolt for helpful comments.

                                          1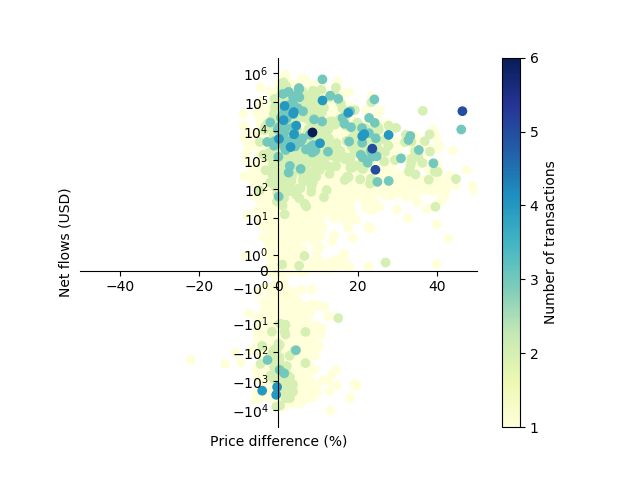
1     Introduction
Arbitrage is one of the central conditions of markets efficiency. In theory,
pure arbitrage should be without capital requirements and without risk. In
practice, however, arbitrage is both risky and costly due to the frictions on
trading venues, bank transfers, and settlement (Shleifer and Vishny, 1997;
Liu and Longstaff, 2004; Gromb and Vayanos, 2010). Quantifying the cross
border frictions that limit the activities of arbitrageurs is the focus of several
papers studying cross listed stocks, American Depository Receipts (ADR)
(Gagnon and Karolyi, 2010; Alsayed and McGroarty, 2012), and Dual Listed
Companies (DLC) (Rosenthal and Young, 1990; De Jong et al., 2009). How-
ever, ADRs and DLCs are not fully fungible, which makes it difficult to isolate
the effect of the market frictions (currency conversions, international trans-
fers, opening hours) from the asset frictions (conversion fees, handling and
processing). For the few fully fungible assets, such as some cross listed stocks,
arbitrage opportunities rarely occur as institutions are able to circumvent the
frictions of international transfers and currency conversions (Lok and Kalev,
2006; Kryzanowski and Zhang, 2002). The frictions however remain for retail
investors.
    Recent literature use the global market for bitcoin to study arbitrage and
price formation as bitcoin is fully fungible. Makarov and Schoar (2020) show
that the price of bitcoin varies when traded in different fiat currencies and
estimate daily unexploited arbitrage profits of more than $75 million in 2017.
The authors are however puzzled by the magnitude of the price differences
between regions and within countries. To explain the price differences this
paper takes a different approach by segmenting the heterogeneous exchanges
into three categories based on the frictions they impose on the arbitrageurs
rather than the geographical location of the exchange. This approach allows
me to show that institutions cannot circumvent cross border frictions as all
market participants have to deposit and withdraw fiat currencies to and
from cryptocurrency exchanges using bank transfers. Additionally, I isolate
how different cross border frictions (currency conversions, international bank
transfers, and capital controls) limit the ability of arbitrageurs to exploit
the price differences compared to a pure blockchain arbitrage strategy. The
market for bitcoin is a useful laboratory as the global 24 hour bitcoin to fiat
currency market is substantial, with over $3.5 billion being traded daily on
the 21 largest global exchanges (Lu, 2020). Daily dollar volume increases
to $18 billion when including all cryptocurrency and derivatives trading in
bitcoin.
    Moreover, as transactions between exchanges are recorded on the block-
chain, I can identify how arbitrageurs adapt to different market frictions.

                                        2
Using the clustering algorithm introduced by Ron and Shamir (2013) to
identify the cryptocurrency exchanges and the transactions between them,
I can shed light on the mechanisms of arbitrage by showing how quickly
arbitrageurs react, how much volume is transferred when prices deviate from
parity, the cost of transferring bitcoin between exchanges (which indicates
their sense of urgency), and the delay in transaction processing. This level
of insight into arbitrage activity is rarely possible for equities or other assets,
as the transactions between venues are neither linked nor publicly available.
Using minute closing prices from Cryptocompare.com and blockchain
data between 14 highly liquid exchanges from 22 July 2016 to 8 Septem-
ber 2019 I find that in categories where investors face greater frictions such
as different fiat currencies, money transfers via banks, or capital control reg-
ulation, the arbitrage opportunities are larger and take longer to resolve as
arbitrage volume is lower and less frequent. This result does not change
as the market for bitcoin matures and institutional participation increases,
which indicates that the entry of institutions does not eliminate the price
differences.
The results suggest that regulatory changes may be needed to reduce the
cross country frictions by increasing the speed of transfers, as price differ-
ences are not eliminated by increased market participation. While money
transfer companies such as TransferWise and MoneyGram are competing on
reducing the processing times, domestic bank transfers can take one to two
working days and international bank transfers can take between one and five
working days to clear. This implication is especially pertinent as central
banks develop central bank digital currencies (CBDC).1 Integrating central
bank digital currencies with stock exchanges that already trade digital shares
could therefore reduce price differences for assets that are listed in multiple
countries and reduce the cost of transacting for market participants who
cannot circumvent the frictions. This implication is especially clear when
analyzing the price difference duration which increases with the frictions.
The results show that arbitrage opportunities persist as arbitrageurs are not
able to transfer fiat currencies between exchanges several times within a day.
The remainder of the paper is structured as follows. Section 2 discusses
the arbitrage strategies on the bitcoin blockchain, how exchanges work, how
exchanges interact with the blockchain, and introduces the three categories
of financial integration. Section 3 presents the results of the price differ-
ences, transaction activity and price difference duration as frictions increase.
1
A recent survey by the Bank for International Settlements show that 80% of central
banks are engaged in CBDC projects and that one in ten central banks find it likely that
they will offer CBDC within the next three years (Boar et al., 2020).
3Section 4 introduces the different types of transactions, identifies arbitrage
transactions, and discusses how the composition of transaction types changes
as frictions increase. Section 5 analyzes the differences between arbitrage and
non arbitrage transactions and Section 6 concludes.
2 The arbitrage process in bitcoin
Arbitrage strategies and the process of carrying out the strategies vary de-
pending on the assets and markets involved. The simplest empirical example
of arbitrage is trading the same stock on two exchanges in the same country.
The arbitrage process involves buying on one exchange and simultaneously
selling on another exchange. The primary risk arbitrageurs face is imple-
mentation risk, as they compete down to the microsecond to exploit the
price difference first (Aquilina et al., 2020; Shkilko and Sokolov, 2020; Bud-
ish et al., 2015). As short selling is generally not available on cryptocurrency
exchanges, the arbitrage process in bitcoin is circular in nature and takes
longer than microseconds.
Generally arbitrageurs have two strategies to carry out arbitrage in cryp-
tocurrencies. The first strategy is to simply buy bitcoin on the cheap ex-
change, send the bitcoin to an expensive exchange, sell the bitcoin and re-
turn whichever quote currency was used to the originating exchange. This
strategy can be risky, as it takes time to move bitcoin from one exchange to
the other, during which time the price can move. An alternative strategy is
to hold bitcoin on the exchange which most frequently has higher prices. The
arbitrageur can then immediately buy bitcoin on the cheap exchange, sell the
bitcoin she has in inventory at the expensive exchange and then re-balance
without the risk of adverse price movements. This strategy is particularly
useful between exchanges where the price difference is primarily one direc-
tional. For example, during the sample period, the bitcoin price on Yobit
is rarely lower than the price on Kraken. An arbitrageur who employs this
alternative strategy will however have inventory costs, which can be very
high given the volatility of the bitcoin price.
The arbitrage process in bitcoin is different from traditional cross border
arbitrage in three ways. First, the bitcoin arbitrage process involves trading
the same asset on multiple exchanges. This is in contrast to arbitrage in Dual
Listed Companies (DLC), where the underlying stocks are not the same but
the price should move in lockstep. An arbitrageur of DLC stocks therefore
has to keep two open positions until the prices converge rather than buying
and selling at the same time (Rosenthal and Young, 1990; Froot and Dabora,
1999; De Jong et al., 2009). Second, bitcoin is fully fungible. The process is
4therefore different from arbitrage in American Depository Receipts (ADR)
where an arbitrageur has the extra step and cost of converting the ADRs
(Gagnon and Karolyi, 2010). Third, cryptocurrency exchanges are open 24
hours a day. An arbitrageur can therefore take advantage of a price difference
at any time. This is in contrast to arbitrageurs of cross-listed stocks and
ADRs where opening hours of stock exchanges may not overlap (Gagnon
and Karolyi, 2010)2 .
2.1 Levels of market frictions
Whichever strategy the arbitrageur uses she will have to move bitcoin and
a quote currency between venues. One of the major costs and risks she
faces is therefore how quickly she can complete a round-trip and restart.
The duration of the round-trip will be influenced by the level of integration
between the exchanges as well as the integration between banks to facilitate
cross border payments. To analyze how the round-trip duration affects the
price deviations and the arbitrage transaction activity I have categorized
each exchange pair (transactions between two exchanges) into one of three
categories. The categories, as highlighted in Figure 1, are: (1) between
stablecoin exchanges, (2) between fiat currency exchanges and (3) between
fiat currency exchanges and exchanges in countries with capital control.
2.1.1 Stablecoin exchanges
The first category, which has the fewest frictions, is arbitrage between sta-
blecoin exchanges. Stablecoins are token versions of fiat currencies such as
USD Tether (USDT) or the euro-backed stablecoin (EURS). The exchanges
do not trade in fiat currencies, they only exchange cryptocurrencies and sta-
blecoins. The exchanges are global and traders from most of the world can
open an account and trade. In the sample these exchanges include Bittrex,
HITBTC, Huobi,3 and Poloniex. The exchanges trade a wide variety of
cryptocurrencies (287 on Bittrex, 380 on HITBTC, 226 on Huobi, and 97 on
2
There are many other examples of arbitrage which are different from arbitrage in
bitcoin. For example: informational arbitrage (Ljungqvist and Qian, 2016), performance
based arbitrage (Shleifer and Vishny, 1997), equity carve-outs (Lamont and Thaler, 2003),
treasury bonds (Cornell and Shapiro, 1989; Longstaff, 1992), options (Ofek et al., 2004),
and primes and scores (Jarrow and O’Hara, 1989).
3
Before October 2017 Huobi was a Chinese exchange which traded primarily in Chinese
Yen. However after the Chinese government made exchanges between cryptocurrencies and
CNY illegal the exchanges pivoted to only trading in cryptocurrencies and stablecoins.
This paper only uses blockchain transaction and price data from January 2018 onward for
Huobi.
5Poloniex) and stablecoins which are primarily USD versions (USD Tether,
TUSD, USDC, DAI, USDS, HUSD, Binance USD, and PAX). HITBTC also
trade Euro stablecoins (EURS). For the analysis I use the minute closing
price of BTC-USDT from Cryptocompare.
Panel A in Figure 1 shows that an arbitrageur trading between stablecoin
exchanges have a very short and simple round-trip as all transactions between
the exchanges occur on blockchains. The figure shows an example of an
arbitrage process where the arbitrageur buys bitcoin with USDT on Exchange
A, sends the bitcoin to Exchange B where she sells her bitcoin for USDT. She
then returns the USDT to Exchange A with another blockchain transaction.
The duration of the round-trip depends primarily on the stablecoin used
as a quote currency. As a block of bitcoin transactions are verified every
ten minutes, the first transaction from Exchange A to Exchange B takes ap-
proximately 10 minutes. However, most exchanges require three blocks to
be verified before the trader can sell her bitcoin on Exchange B. This is to
ensure that the bitcoin blockchain transaction is not rejected because the
bitcoin have been double spent. By waiting three blocks the risk of this oc-
curring reduces from 20.5% to 1.3% (Nakamoto, 2009). Sending bitcoin from
Exchange A to Exchange B therefore takes approximately 30 minutes. The
duration of the return transaciton depends on which blockchain the stable-
coin uses. As USDT uses the bitcoin omni layer4 Exchange A will require
a three block wait time and the transaction will take 30 minutes. Alter-
natively, if the arbitrageur uses USDC or one of the other Ethereum based
stablecoins as the quote currency, the return transfer can take 7 minutes.
This is because blocks on ethereum network take 14 seconds to verify and
exchanges require 30 block confirmations before traders can sell the coins on
the exchange. Regardless of which quote currency is used, the arbitrageur is
able to complete multiple round-trips within a day.
2.1.2 Fiat currency exchanges
The second category increases the market frictions as these exchanges trade
exclusively in cryptocurrencies and fiat currencies, not stablecoins. These
exchanges have historically had country specific ties but many of them ex-
change multiple fiat currencies which are available to most traders.5 The
4
The bitcoin omni layer is a protocol built on top of the bitcoin blockchain to increase
the types of assets users can trade. Transactions on the omni layer therefore have the
same speed as bitcoin transactions.
5
There are often specific rules for US residents and which currencies they can trade.
For example Lake-BTC do not allow US residents to trade at all. After Bittrex listed USD
and EUR in addition to their stablecoins, US residents are only able to exchange in USD,
6exchanges in this category include Bitbay, Bitfinex, Bitstamp, CEX, Kraken,
LakeBTC and TheRockTrading. Compared to the stablecoin exchanges,
these exchanges list substantially fewer cryptocurrencies (29 on Bitbay, 7 on
Bitstamp, 26 on CEX, 38 on Kraken, 5 on LakeBTC, and 12 on TheRock-
Trading). Bitfinex is the exception, as it currently trades 152 cryptocurren-
cies. The exchanges trade in a variety of fiat currencies which have separate
order books. For instance, BTC-USD is traded separately from BTC-EUR.
The minute closing prices from Cryptocompare include: EUR, PLN and USD
for Bitbay, CAD, EUR, GBP, JPY and USD for Kraken, AUD, CAD, EUR,
GBP, JPY and USD for LakeBTC, EUR for TheRockTrading, and EUR and
USD for Bitfinex, Bitstamp and CEX. As I do not see how the bitcoin are
traded once they arrive at the exchange, it is unclear which fiat currency the
arbitrageur is using as a quote currency. I therefore use the average price of
the BTC-fiat exchange rates on the exchange, weighted by the dollar volume
traded on the exchange in that minute for each exchange rate to get one price
of bitcoin on each exchange.
To take advantage of price differences between exchanges in this category
the arbitrageur needs to take additional steps to complete the round-trip,
which increases the arbitrage transactions’ duration. The arbitrage process
example in Panel B in Figure 1 shows that after the arbitrageur sends her
bitcoin to Exchange B and exchanges the bitcoin to Euro, the arbitrageur now
has to withdraw the fiat currency from Exchange B to a bank account. The
arbitrageur then has to exchange the fiat currency and send it internationally
to a bank in the originating country, before depositing the fiat currency in
Exchange A, completing the round-trip.
As the exchanges do not trade in stablecoins, the duration of the arbi-
trage round-trip is substantially longer. The bitcoin transaction from Ex-
change A to Exchange B still takes approximately 30 minutes. However, the
arbitrageur has to wait for the bank transfers to clear where international
bank transfers can take from one day to a few days. If both exchanges oper-
ate in the same fiat currency the arbitrageur can skip the international bank
transfer, but she still has to withdraw and deposit fiat currency into the cryp-
tocurrency exchanges using bank transfers. This means that the arbitrageur
will only be able to complete a round trip at most once a day.
Importantly, this friction of slow transactions between banks also affects
institutions. Institutions may have fiat currency deposits in multiple coun-
tries which allows them to avoid fiat currency frictions when arbitraging
stocks for example. However, institutions have to make bank transfers when
depositing and withdrawing fiat currencies to and from the cryptocurrency
not EUR. However non-US residents are able to exchange both USD and EUR on Bittrex.
7exchange if the cryptocurrency exchanges do not offer margin trading, which
few exchanges do. The institutions therefore have to wait the 1-2 days for
the bank transfer to clear just like retail investors. This may explain why
Makarov and Schoar (2020) observe price differences between bitcoin de-
nominated in US dollar versus Euro of 3% on average. The authors find the
magnitude of the price difference surprising as they expect that institutions
should be able to exploit the price differences.
2.1.3 Capital control exchanges
The last category has the highest level of frictions and include transactions
between fiat currency exchanges and exchanges in countries with capital con-
trols. The exchanges that operate in countries with capital controls are Ok-
Coin6 (China), MercadoBitcoin (Brazil), and Yobit (Russia). The countries
have varying rules on capital inflows and outflows (Fernández et al., 2016).
This category includes transactions between the fiat currency exchanges (Bit-
bay, Bitfinex, Bitstamp, CEX, and Kraken), which are not restricted by cap-
ital controls, and exchanges with capital controls (MercadoBitcoin, OkCoin,
and Yobit). Users in other countries can set up an account on OkCoin and
Yobit7 while users outside of Brazil are not able to set up an account on
MercadoBitocin as the exchange requires a government identification num-
ber. Importantly, arbitrageurs cannot avoid the capital control regulation by
using stablecoins, as none of the exchanges have stablecoins listed.
The transaction round-trip of the arbitrageur is further restricted by the
capital control regulation as shown in the arbitrage prices example in Panel
C of Figure 1. The duration of the arbitrage process increases as the arbi-
trageur now has to comply with capital control regulation on the return leg
of the round-trip. The blockchain transaction still takes 30 minutes and the
domestic bank transfers remain similar to the fiat currency exchanges in the
previous category. However the international transfer may take longer. In
addition, the volume the arbitrageur is able execute on each round-trip may
also be restricted. This category therefore has the longest arbitrage process
with the most frictions.
6
OkCoin exchanged cryptocurrencies for Chinese Yen until October 2017 when the
Chinese government made such trading illegal. I only include blockchain transaction and
price data before October 2017 for OkCoin.
7
Users from North Korea, Syria, Iran, Sudan, Bangladesh, Bolivia, Ecuador, Kyrgyzs-
tan and the USA cannot set up an account an OkCoin.
82.2 Exchange specific frictions
Independently of which category of market frictions the arbitrageur experi-
ences, she will incur some exchange specific costs. Market access is generally
low cost. Depending on the cryptocurrency exchange, the setup time varies
based on the level of Know Your Customer and Anti Money Laundering
regulation the exchange enforces.8 Once the arbitrageur has access to the
exchange, the trading is organized similarly to stock exchanges. The ex-
changes have centralized limit order books with no intermediaries. Traders
can submit market orders and limit orders, and some exchanges offer more
advanced order types. All orders are ranked by price and time priority and
matched and settled by the exchange’s internal matching engine. As trading
is organized internally by the exchange the transaction speed resembles that
of stock exchanges.
The exchanges in the sample are highly liquid, but the liquidity varies
throughout the day depending on the time zone of when the majority of
traders are awake (Dyhrberg et al., 2018). Most exchanges do not have
designated market makers and rely on endogenous market makers to provide
liquidity (Dyhrberg et al., 2019). Depending on the liquidity, the arbitrageur
will pay a liquidity cost equal to the effective spread to have immediate
execution. Additionally, the arbitrageur will pay any explicit costs such as
maker/taker fees. To withdraw fiat currencies the arbitrageur sometimes
has to pay a withdrawal fee (10-50 basis points per withdrawal) and most
exchanges also have withdrawal limits ($2,000 to unlimited depending on the
trading account). The exchange specific frictions are therefore liquidity costs
such as spreads and explicit trading fees as well as withdrawal fees and limits
for fiat currencies.
In addition to a longer round-trip duration arbitrageurs between fiat cur-
rency exchanges will incur additional costs such as the bank fees for inter-
national transfers, foreign exchange conversion fees, the foreign exchange
spread, the wait time for the fiat to be withdrawn from and deposited into
the exchange, and the wait time of the international transfer.
8
All of the exchanges in the sample requires some form of identification verification.
However, the extent of the identification verification requirements varies. Most exchanges
require contact information and a photo of a passport. Other exchanges additionally
require proof of address, bank statements, source of funds information, and a photo of
yourself with your id and a note stating the name of the cryptocurrency exchange. Having
set up accounts and completed the identification verification on all exchanges in the sample
except for MercadoBitcoin, the process varies between 15 minutes and 6 hours including
processing time.
92.3 Blockchain specific frictions
All the trading on the cryptocurrency exchanges occur independently of the
bitcoin blockchain. The transactions are matched, settled, and recorded in-
ternally by the exchange. To move the bitcoin to a different exchange the
arbitrageur has to interact with the blockchain. To transfer the bitcoin the
arbitrageur submits a transfer with information on the receiving wallet ad-
dress (the bitcoin address linked to the arbitrageur’s account on the receiving
exchange), the amount to transfer, and the mining fee the arbitrageur would
like to pay. The transaction information is comparable to a bank transfer
where the user enters the account number of the receiver and the amount
to be transferred. In contrast to bank transfers where the fee is set by the
bank, the fee users pay the miners is voluntary and used to incentivize the
inclusion of their transactions in the next block.9 The fee can be of any size,
but most exchanges suggests a fee amount.
When the transaction has been submitted it enters the pool of unverified
transactions (called the memory pool or mempool). The time it takes for the
transaction to be verified depends on the mining fee paid relative to the size
of the transaction in bytes, the fees on the other transactions in the pool,
and how many other transactions are waiting to be verified (Easley et al.,
2019). Miners are incentivized to verify the transactions that pay the highest
fee relative to how much space it takes up in the block, as the block has a
finite size. During the sample period the median wait time of a transaction
is 6.8 minutes.
In addition to the explicit mining fee, the arbitrageur is also subject to
mempool wait time uncertainty. The wait time varies and the arbitrageur
cannot secure a certain wait time by paying a specific fee (Hautsch et al.,
2020). During the wait time the arbitrageur is exposed to spot price volatility
risk as cryptocurrencies in general, and bitcoin specifically, is known for high
price volatility (Hautsch et al., 2020). Once the transaction has been verified
and included in a block, the bitcoin is transferred to the receiving exchange.
The blockchain specific frictions thus include the mining fee, the mempool
wait time, mempool wait time uncertainty, and spot price volatility risk.
3 Price differences under different market fric-
tions
To identify how price differences and trading activity changes when the level
of financial integration changes I calculate the average price difference across
9
For more details about mining see Easley et al. (2019) and Huberman et al. (2019).
10the exchange pairs as well as the transaction volume flowing between the
exchanges in each category and plot the variables over time in Figures 2 to
4.
3.1 Stablecoin exchanges
The price differences and blockchain transactions between stablecoin ex-
changes, which have the fewest frictions of the three categories, is shown
in Figure 2. Given that the arbitrage round-trip is relatively short, it is not
surprising that the price differences between the stablecoin exchanges are
close to zero. Panel A in Figure 2 shows the average daily price difference
across the exchange-level flows in this category between 22 July 2017 and
8 September 2019. The daily price difference is rarely above (below) 2.5%
(-2.5%). When the price differences spike, it occurs in both directions, indi-
cating that no one exchange is persistently more expensive or cheaper than
the others. The price difference decreases over time, especially since the end
of 2018 where the price differences are very close to zero. This development
indicates that as the market matures, the variation in the price differences
decreases.
Panel B and Panel C in Figure 2 shows the price of bitcoin in USD and
the bidirectional blockchain transaction volume between the stablecoin ex-
changes. The panels indicate that the blockchain volume positively correlates
with the bitcoin price as bidirectional volume increases when the price of bit-
coin appreciates and vice versa. Specifically, after June 2017 the transaction
volume increases substantially to approximately 10 million USD daily in both
directions and remains at that level until March 2018. During this period
(mid 2017 to mid 2018) the cryptocurrency market experienced a boom in
Initial Coin Offerings (ICO), where companies issue tokens to raise capital
(Howell et al., 2019). Bittrex and Poloniex are known for listing smaller
alternative coins, which explains the increase in activity in 2017 and the
subsequent decrease in transaction flows between the exchanges as the ICO
popularity reduces. This increase in activity is mirrored in the rapid in-
crease in the bitcoin price during the same period where the price of bitcoin
reached nearly 20,000 USD in December 2017. After the ICO boom, the
bitcoin price stabilizes and the daily transaction volume decreases to under
$1 million in both directions until the price starts to appreciate again in
May 2019 and the volume increases. When plotting transaction volume be-
tween fiat currency exchanges and stablecoin exchanges10 a similar pattern
10
The transactions and graphs are not included in the analysis as these cannot be ar-
bitrage transactions. To conduct arbitrage both exchanges have to have the same quote
11emerges as these transactions are likely transactions to gain access to the
wider selection of coins available on stablecoin exchanges.
Insert Figure 2 here
Trading exclusively in cryptocurrencies and stablecoins has benefits. As
arbitrageurs can complete multiple round-trips throughout the day, the price
deviations remain close to zero. The exchanges have also historically been
subject to lower levels of regulation, as they do not interact with the tra-
ditional financial markets. However, stablecoins can cause issues depending
on how the supply of the stablecoin is managed and how the peg to the
respective fiat currencies are ensured. As stablecoins are backed and man-
aged by companies and not central banks, the reliability of the peg and the
trust that the fiat reserve covers the issuance of the stablecoin one to one is
less transparent. For example, Griffin and Shams (2020) show that USDT is
being printed, unbacked by USD, and exchanged for bitcoin to drive up the
price following periods of negative bitcoin returns. Due to the issues around
security and stability not all exchanges have listed stablecoins.
3.2 Fiat currency exchanges
When the market frictions increase, arbitrageurs have to exchange bitcoin for
fiat currencies, withdraw the fiat currencies and transfer the fiat currencies
between exchanges. The additional frictions of exchanging and transferring
fiat currency between bank accounts makes it slower and more expensive to
take advantage of price deviations between fiat currency exchanges.
The result of the increased frictions can be seen in Panel A of Figure 3,
which shows the average daily price differences through time between the fiat
currency exchanges. Compared to stablecoin exchanges, the price deviations
have similar magnitudes, remaining within ±2.5 %. However, unlike the sta-
blecoin exchanges, the price deviations are more frequently above zero and
remain positive for extended periods of time. This price difference suggests
that the arbitrageurs are not able to correct the mispricing because of the
additional fees and the longer round-trip durations. Interestingly, the price
difference is primarily positive which indicates that some exchanges are per-
sistently more expensive than others. The exchanges driving this result are
CEX, Kraken, LakeBTC and TheRockTrading.
currency listed which is not the case between fiat currency exchanges and stablecoin ex-
changes. Fiat currency exchanges only exchange bitcoin for fiat currencies and stablecoin
exchanges only exchange bitcoin for stablecoins.
12Panel B shows the price of bitcoin over the sample period. When com-
paring the price differences and the bitcoin price throughout time it is clear
that the price difference increases in 2017 as the price of bitcoin appreciates
rapidly. This relation supports the finding by Makarov and Schoar (2020)
who find that price deviations between bitcoin and fiat currencies occur when
the bitcoin price appreciates quickly. However, the price deviation converges
towards the end of the time-series after May 2019 and, importantly, does
not widen as the bitcoin price appreciates in May 2019. This indicates that
the relationship between the appreciation of the bitcoin price and the price
deviations may be a specific characteristic of the 2017 boom. A possible
explanation could be more competition among arbitrageurs as the bitcoin
market matures, for example by increased participation of institutions in
arbitrage activities.
The transaction flows between the exchanges trading fiat currencies is sig-
nificantly smaller than between the stablecoin exchanges, as shown in Panel
C of Figure 3. Daily transaction volumes frequently passes $10,000 and occa-
sionally $100,000, but is far from the millions transferred between stablecoin
exchanges. Interestingly, the vast majority of the transaction volume is in
one direction, which aligns with the positive price difference as users are
transferring bitcoin from the cheap to the expensive exchanges.
The results show that as market frictions increase and users have to in-
teract with traditional bank transfers rather than blockchains exclusively,
the price differences increase and the overall trading activity decreases. This
indicates that if bank transfers were made faster through higher integration
between banks, the price differences might reduce resulting in increased ac-
tivity.
The low transaction volumes between fiat currency exchanges also indi-
cate that bitcoin is not being widely used as an alternative to international
bank transfers. The arbitrage process example in Figure 1 shows that to de-
posit and withdraw fiat currencies into cryptocurrency exchanges, users have
to complete traditional banking transfers. Using bitcoin as an alternative to
international bank transfers may therefore only provide a marginal improve-
ment as bank transfers are not eliminated entirely. To get the full benefit of
the speed (and low frictions) of international transfers on the blockchain users
would need a central bank digital currency to replace fiat currencies. This
may be the reason why bitcoin has not disrupted the remittance industry as
it was predicted to do.
Insert Figure 3 here
133.3 Capital control exchanges
When one of the exchanges are subject to capital control regulations, the du-
ration of the arbitrage round-trip increases as the arbitrageur has to complete
additional steps to comply with or avoid the regulation. These additional fric-
tions are clearly reflected in the magnitudes of the price deviations shown in
Panel A of Figure 4. Throughout the sample period the exchanges which op-
erate in countries with capital controls have prices that are frequently more
than 5% higher than the exchanges without capital controls. The price dif-
ferences also persist for long periods of time ,and reach 10% several times.
Similarly to the price differences between fiat currency exchanges, the price
difference is most frequently positive as the exchanges in the countries with
capital controls have higher prices.
As the price deviation is most frequently positive, the transaction volume
in Panel C is correspondingly positive (i.e. flowing into the exchange with
capital controls and higher prices). The daily transaction volume is however
larger (frequently reaching $1 million) and more persistent than between fiat
exchanges. Interestingly, around March 2019 when the price deviation flips
from being primarily positive to being negative the transaction flows do not
change direction, which indicates that the arbitrageurs may be delayed or
restricted in moving their inventory and reversing the arbitrage round-trip
direction. Panel C also shows that the majority of the blockchain transaction
volume flowing out of the countries with capital controls occur in 2016 and
2017.
The persistent and high daily transaction volume between fiat currency
exchanges and exchanges in countries with capital controls indicate that the
additional costs of bank transfers may make bitcoin a more valuable alterna-
tive to international transfers compared to transactions between fiat currency
exchanges discussed in the previous section.
Insert Figure 4 here
To test the effect of the market frictions on the price differences I estimate
the regressions in Eq. (1).
P riceDif f erencei,t = αm + β1 F iatExchangei,t
+ β2 CapitalControlExchangei,t (1)
+ β3 AbsBitcoinReturni,t
+ β4 IntradayV olatilityi,t + t
where P riceDif f erencei,t is the price difference in percent between ex-
change pair i at minute t, αm is month year fixed effects, F iatExchangei,t is
14a dummy variable which equals one for the exchange-level flows which are in
the fiat exchange category and zero otherwise, CapitalControlExchangei,t
is a dummy variable which equals one if the exchange-level flow is between
a fiat exchange and an exchange with capital controls and zero otherwise,
AbsBitcoinReturni,t is the daily absolute bitcoin return11 and IntradayV olatilityi,t
is the average intraday volatility of the two exchanges in exchange pair i.
The regression results in Table 1 show that the price differences between
fiat currency exchanges and to exchanges with capital controls is 2.48% and
5.35% higher than between stablecoin exchanges. The result shows that the
additional frictions imposed by transacting in fiat currencies and adhering to
capital control regulations limits the activities of arbitrageurs and their effect
on the prices. This indicates that if international fiat currency transactions
were made faster, the price differences would reduce as arbitrageurs could
complete round-trips more frequently.
The result is consistent when segmenting the sample period into before
and after 1 Jan 2018 which indicates that even as the market for bitcoin
matures, the market frictions are still limiting the activities of arbitrageurs.
As the time series graphs showed in the previous sections the bitcoin network
has experienced periods of high and low activity. Models (4) and (5) show
that the results are consistent when the network is more or less congested (if
the number of transactions in the mempool is above or below the median).
Insert Table 1 here
3.4 Price difference duration under different market
frictions
The arbitrageurs’ round-trip transaction varies depending on the level of mar-
ket integration, and that the duration of this round-trip increases as more
frictions are introduced. Given that the prices vary between exchanges in all
three categories, the question becomes if the price differences persist for long
enough for the arbitrageur to react. I investigate this question by analyz-
ing the duration when the price difference is outside a percentage threshold
(±2 %, ±5 %, ±10 % and ±20 %).
Table 2 shows that when the frictions increase and the arbitrage round-
trip takes longer to complete the price differences persist for longer periods
11
The bitcoin price used for the return variable is the daily volume weighted average
price of BTC-USD on Kraken. This is to have a general measure of return instead of it
depend on the exchanges in the specific exchange pair. The BTC-USD exchange rate is
used as it is traded throughout the entire sample period. It is also representative of the
global bitcoin price as it is included in the CME Bitcoin Reference Rate.
15of time as well. Specifically, the maximum number of consecutive days the
price difference is above/below ±2 % is 8 days, 123 days and 542 days be-
tween stablecoin exchanges, fiat currency exchanges, and to capital control
exchanges respectively. This relationship between increasing duration and
increasing frictions persists as the price differences increase to ±5 %, ±10 %,
and ±20 %. When comparing the total number of days and the frequency
with which the price difference is above/below the thresholds a similar pat-
tern emerges. As frictions increase the price difference is outside ±2 % more
frequently, persists for longer in single occurrences and in total.
This result indicates that when frictions increase and the arbitrage round-
trip takes days instead of hours due to the long clearing time for bank trans-
fers arbitrageurs are restricted in executing enough volume to adjust the
mispricing quickly. Consequently, if the speed of bank transfers increases the
price difference should reduce in both frequency and length. This result has
implications for international financial integration as it indicates that price
differences of the same asset traded on multiple exchanges could be reduced
if the settlement time decreases and integration between exchanges directly
and between exchanges and the banking system increases.
Insert Table 2 here
4 Transaction types under different market
frictions
One of the advantages of using the global market for bitcoin is that I can
observe all the bitcoin the transactions between exchanges as they have to
be recorded on the blockchain. This allows me to compare the variations
in the price differences to the variation in the transactions and specifically
the arbitrage transactions between the exchanges. This section segments the
transactions into types and analyzes how they change as frictions increase.
The transaction volume between exchanges in Figures 2 to 4 will not be
exclusively arbitrage volume. There are several reasons why a user would
transfer bitcoin between exchanges besides arbitrage. This means that the
users’ sensitivity to the price differences between the exchanges will vary. It
is therefore important to segment the transactions into different types, so
I can isolate the arbitrage activity and identify if the transaction activity
changes as frictions increase.
I categorize the transactions into three types based on two factors: the
price difference when the transaction entered the mempool and the direc-
tion of the transaction (e.g. from Huobi to Poloniex). I use the price when
16the transaction entered the mempool as it shows the price the user reacted
to, rather than the price when the transaction arrives at the receiving ex-
change.12
The first transaction type is a liquidity transaction. These transactions
flow in both directions between exchanges, but only when the price difference
is close to zero. For the analysis I include all transactions that occur when
the price difference is between ±2 %. These transactions can be motivated
by the liquidity needs of the user. For example if a user wants to trade in dif-
ferent cryptocurrencies she can move the bitcoin to an exchange with a wider
selection of alternative coins. She is however mindful of the price deviation
to minimize the cost of having to move the coins. Alternatively, a liquidity
transaction can also be a user using bitcoin to make international transfers
as an alternative to using banks and other financial service companies. The
user will similarly be sensitive to any price differences between the sending
and receiving exchange.13
The second type of transaction is arbitrage transactions. These transac-
tions occur when the price difference is above (below) some price difference
threshold and flow in the direction of the price deviation. For example, if the
price of bitcoin is 5% higher on Poloniex than on Huobi, all transactions that
flow from Huobi to Poloniex are categorized as arbitrage transactions. The
user may not actively be arbitraging but will gain from the price deviation
nonetheless.
The third and last type of transaction is market access transactions.
These transactions occur when price deviations are greater than ±2 % simi-
larly to arbitrage transactions. However, they flow in the opposite direction
of the price deviation (i.e. from the expensive to the cheap exchange). On
the surface, these transactions seem uneconomic, but users can have reasons
for disregarding the price deviation or be willing to incur this cost to gain
market access. For example, during the ICO boom in 2017 users might be in
a hurry to invest in newly listed cryptocurrencies. The possible gains from
accessing the new cryptocurrencies therefore outweigh the costs of a worse
bitcoin exchange rate. Alternatively, a user in a country with capital controls
or high transaction costs for international transfers might be willing to get a
worse bitcoin exchange rate to move the bitcoin to an exchange with unre-
12
The mempool data is from 04/22/2014 - 06/24/2018 from blockchain.info. For trans-
actions outside of the time-series, I use the price 6.8 minutes prior to the transaction
being verified, which is the median mempool wait time. Using the median wait time is
more accurate than using the price at the time the transaction was verified, as that would
assume a mempool wait time of zero.
13
It is important to note that even though I can observe transactions between exchanges,
I cannot observe how the bitcoin is then traded on the receiving exchange.
17stricted access to traditional banking (Hu et al., 2018). In addition, traders
may transfer their bitcoin to different exchanges to obfuscate the ownership
of the coins and will therefore be less sensitive to price differences. Foley
et al. (2019) find that 46% of bitcoin transactions are involved in illegal ac-
tivity amounting to $76 billion per year. For example hackers who extort
money from individuals using ransomware often request payment in bitcoin
(Sokolov, 2018).
4.1 Transaction types change as frictions change
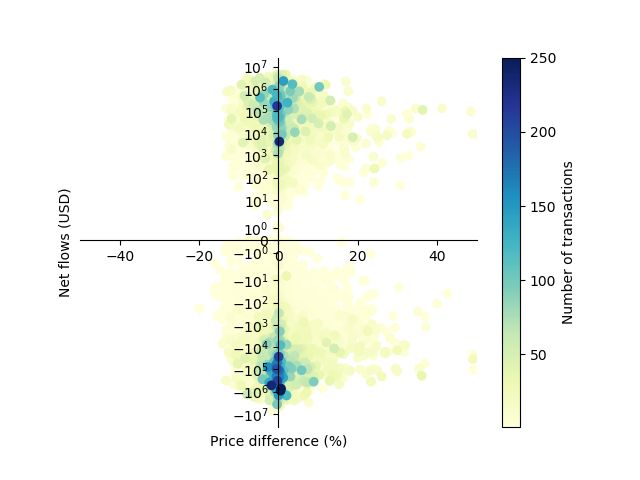
Figure 5 shows the total net transaction volume (outflows minus inflows)
in USD by minute (y-axis), the number of transactions (color scale) and
the price difference in that minute (x-axis) for all transactions between sta-
blecoin exchanges. As Figure 5 plots the price differences by minute for
each exchange-level flow the variation is higher than the average daily price
differences in Figure 2. The figure shows that the transaction flow is fairly
symmetric around the x-axis except for smaller transactions below $10 which
flow mostly in one direction (from Poloniex to Bittrex). Most of the trans-
action volume is liquidity transactions, as shown by the cluster of activity at
volumes greater than $10,000 close to the y-axis. These clusters are typically
100+ individual transactions in that minute.
The arbitrage transactions are visible in the top right and bottom left
quadrant. In these areas the net transaction volume is positive when the
price difference is positive and vice versa, indicating that the majority of
transactions in that minute flow to the expensive exchange. Interestingly,
the transaction volume is similar in size to the liquidity transactions at over
$10,000, but consist of fewer transactions. This suggests that when the price
deviation is small there are many smaller transactions. As the price deviation
increases the transactions per minute become fewer but larger, resulting in
the same total dollar volume.
The market access transaction volume is shown in the top left and bottom
right quadrant as the transaction volume flows in the opposite direction of
the price difference. The cluster of large transactions in the bottom right
quadrant flow primarily from the exchanges HITBTC, Bittrex and Huobi to
Poloniex. Poloniex has historically listed many alternative cryptocurrencies
which suggests that these transactions might be market access transactions
to alternative cryptocurrency markets on Poloniex.
Insert Figure 5 here
Similarly to the transaction volume between stablecoin exchanges, the
largest transaction volumes and most activity between fiat currency ex-
18changes occur when the price difference is close to zero as shown in Fig-
ure 6. This liquidity transaction volume ranges in size and clusters at above
$10,000 in both directions. This result indicates that most of the transactions
between the fiat exchanges are likely alternatives to international transfers
using traditional bank transfers or other financial service providers.
As indicated by the transactions in Figure 3, the arbitrage transactions
flow primarily in one direction as the price difference is most frequently pos-
itive. However, even though the price differences are larger when including
individual exchange level flows instead of the average across all exchange-
level flows, Figure 6 only show a small cluster of arbitrage transactions. This
indicates that arbitrageurs are constrained by the longer duration of the ar-
bitrage round-trip to take advantage of the price differences.
The market access transaction volume, which occurs in the opposite di-
rection of the price difference when the price difference is outside of ±2 %, is
less pronounced than between stablecoin exchanges. This is to be expected,
as the fiat currency exchanges do not trade a wide variety of cryptocurrencies
beyond the most popular.
Insert Figure 6 here
Figure 7 confirms that the majority of the transactions between fiat cur-
rency exchanges and exchanges with capital controls are arbitrage transac-
tions and occur when the price difference is positive. The cluster of trans-
actions in the top right quadrant is therefore more pronounced than the
transaction flows between stablecoin or fiat exchanges. The arbitrage trans-
actions primarily flow in one direction (from the fiat currency exchange to
the exchange in a country with capital controls with higher prices), which is
not surprising as the price difference is rarely negative.
Similarly to the stablecoin and fiat exchanges, there is a clear cluster of
liquidity transaction volume when the price difference is close to zero. These
transactions vary in size from less than $10 to $100,000 and flow in both
directions. The market access transactions are clustered in the bottom right
quadrant, flowing from the exchange with capital controls to the exchange
without capital controls, even when the price difference is positive. These
transactions are likely motivated by avoiding the capital controls.
Insert Figure 7 here
Overall the analysis indicates that the transaction activity and the types
of transactions that are being sent between exchanges change as the market
frictions increase. When frictions are low, as between stablecoin exchanges,
19transaction volumes are large and users send both liquidity transactions, ar-
bitrage transactions, and market access transactions between exchanges. As
frictions increase and users have to exchange fiat currencies for bitcoin the
activity is almost exclusively liquidity transactions and total the volume be-
ing transferred reduces. As the frictions increase further and users have
to comply with capital control regulations most of the activity is arbitrage
transactions or likely liquidity transactions to avoid these capital control reg-
ulations. These results suggest that not only may the price differences and
price difference duration reduce if the market frictions are reduced, but the
transaction volumes between exchanges will increase and open up for a wider
variety of transaction activity.
5 Transaction volume and arbitrage volume
under different frictions
As expected from Figures 2 through 7 the total transaction volume changes
as frictions change both in total and daily. The daily transaction volume
transferred between stablecoin exchanges is 3.6 million USD on average and
4.1 billion USD in total over the sample period. The majority of this volume
is non arbitrage volume which means the transaction enters the mempool
when the price deviation is between ±2 % or the direction of the transaction
is against the price deviation (from the expensive to the cheap exchange).
This is not surprising as the price deviation duration is short and occurs
infrequently and as the exchanges are known for trading many alternative
cryptocurrencies which may show up as these uneconomical arbitrage trans-
actions as discussed previously in section 4. The daily transaction volume
between fiat exchanges is much lower at 28,000 USD on average and 14 mil-
lion USD in total. Almost all of the transaction volume (12.7 million USD)
occurs when the price difference is between ±2 %. Interestingly, the daily
transaction volumes between fiat currency exchanges and exchanges with
capital controls is more than three times higher on average at 89,000 USD
(95.7 million USD in total) compared to transaction between fiat currency
exchanges.
When the prices start to deviate and exceed ±2 %, arbitrageurs on sta-
blecoin exchanges are able to transfer $835,000 daily on average and $295
million in total to exploit the mispricing. By contrast, arbitrageurs on fiat
currency exchanges only transfer $9,700 on average daily and $1.6 million in
total when prices are above/below ±2 %. Arbitrageurs between fiat currency
and capital control exchanges transfer $91,000 daily and $67.2 million in to-
20tal throughout the sample period. These differences suggest that because
the frictions are low between stablecoin exchanges, arbitrageurs can easily
transfer bitcoin and exploit any price deviations. However, the price devia-
tions are either not large enough to cover the additional costs of exchanging
and transferring fiat currencies or the price differences do not persist for long
enough for arbitrageurs to exploit the price deviations between fiat currency
exchanges. The results suggest that the opposite is true for arbitrageurs be-
tween fiat currency exchanges and capital control exchanges. Even though
the costs are higher for arbitrageurs, the price differences are large enough
and persist for long enough for arbitrageurs to exploit the price differences.
Insert Table 3 here
5.1 Arbitrage and non-arbitrage transactions
As arbitrage transactions have a different sensitivity to price differences than
liquidity transactions and market access transactions, it is likely that the
volume and fees are different. This section explores these differences.
Arbitrage transactions are larger in dollar volume than non-arbitrage
transactions (liquidity and market access transactions) between stablecoin
exchanges (8,900 USD vs 7,500 USD) and between exchanges with and with-
out capital controls (17,300 USD vs. 9,500 USD) on average as shown in
Table 3. This difference is intuitive as arbitrageurs have an incentive to
transfer larger volumes per transaction to maximize the arbitrage profits be-
fore the price deviation is eliminated, while non-arbitrage transactions do
not have that incentive. The average transaction size increases as the price
difference increases from ±2 % to ±5 % and ±10 %. By contrast, as the
non-arbitrage activity is higher between fiat currency exchanges compared
to arbitrage activity, the transactions when the price difference is between
±2 % are three times larger (16,000 USD) than transactions when the price
difference is outside of ±2 % (5,4000 USD) on average. The difference is even
more striking when comparing the median transaction sizes.
As arbitrageurs have an incentive to transfer bitcoin quickly between the
exchanges to exploit price differences, arbitrage transactions are expected to
pay higher mining fees to shorten the wait time in the mempool and get
faster verification. This is confirmed when comparing the mining fees paid
on arbitrage transactions and non-arbitrage transactions between stablecoin
exchanges (5.89 USD and 3.48 USD) and between fiat exchange exchanges
and exchanges with capital controls (2.50 USD and 0.87 USD). However,
when considering the mining fee relative to the dollar volume of the transac-
tion the proportion for arbitrage transactions (0.1 %) is smaller than for non
21arbitrage transactions (0.43%) between exchanges with and without capital
controls. This indicates that as the dollar volume of arbitrage transactions
between exchanges with and without capital controls is larger than non ar-
bitrage transactions and as arbitrageurs require faster transactions it makes
economic sense to give a higher fee to the miner. As a result the mempool wait
time for arbitrage transactions between exchanges with and without capital
controls is 18 minutes compared to 31 minutes for non-arbitrage transactions.
To get a more detailed view of the difference in fees and mempool wait
time between arbitrage transactions and non-arbitrage transactions I esti-
mate the regression in Eq. (2)
DependentV ariablej,t = β0 + β1 ArbitrageT ransaction2
− 5%j,t + β2 ArbitrageT ransaction5 (2)
− 10%j,t + β3 ArbitrageT ransaction
> 10%j,t + β4 AbsBitcoinReturnj,t + t
where the dependent variables are T ransactionF eej,t , which is the trans-
action fee paid on transaction j at time t in US Dollars, T ransactionF ee
OverV olumej,t , which is the transaction fee relative to the volume of the
transaction, M empoolW aitT imej,t which is the number of minutes the trans-
action waited in the memory pool, and M emoryP oolCongestionj,t which is
the number of transactions already waiting in the mempool as the transaction
enters as used by Foley et al. (2020). The independent variables are dummy
variables which equal one if the transaction occurs when the price difference
is between 2% and 5%, 5% and 10% and greater than 10%. The control vari-
able AbsBitcoinReturni,t is the daily absolute bitcoin return. The regression
is run for each of the friction categories.
Table 4 shows the coefficient estimates of the dummy variables for each
of the regressions and friction categories. The results show that the arbi-
trage transactions between stablecoin exchanges and between fiat currency
exchanges do not pay a higher transaction fee in USD compared to non-
arbitrage transactions. Only transactions when the price difference is greater
than 5% between fiat exchanges and capital control exchanges pay $1.6 more
than non-arbitrage transactions on average. As arbitrage transactions have
a higher dollar volume than non arbitrage transactions between fiat currency
exchanges and capital control exchanges, the transaction fee relative to the
volume is significantly lower. The higher fee, translates into a lower mempool
wait time for arbitrage transactions of 5.9 to 8.4 minutes on average.
While the arbitrage transactions between stablecoin exchanges and be-
tween fiat currency exchanges do not pay a significantly higher fee, they
occur when the mempool is significantly more congested. When arbitrage
22You can also read