Digital Twin Based Optimization of a Manufacturing Execution System to Handle High Degrees of Customer Specifications - MDPI
←
→
Page content transcription
If your browser does not render page correctly, please read the page content below
Journal of
           Manufacturing and
           Materials Processing

Article
Digital Twin Based Optimization of a Manufacturing
Execution System to Handle High Degrees of
Customer Specifications
Andrea Barni 1 , Dario Pietraroia 1 , Simon Züst 2, * , Shaun West 2           and Oliver Stoll 2
 1   Department of Innovative Technologies, Scuola Universitaria Professionale Della Svizzera Italiana (SUPSI),
     6928 Manno, Switzerland; andrea.barni@supsi.ch (A.B.); dario.pietraroia@supsi.ch (D.P.)
 2   Department of Engineering and Architecture, Research Group for Digital Innovation, Lucerne University of
     Applied Sciences and Arts (HSLU), 6048 Horw, Switzerland; shaun.west@hslu.ch (S.W.);
     oliver.stoll@hslu.ch (O.S.)
 *   Correspondence: simon.zuest@hslu.ch; Tel.: +41-41-349-30-44

 Received: 17 October 2020; Accepted: 13 November 2020; Published: 17 November 2020

 Abstract: Lean production principles have greatly contributed to the efficient and customer-oriented
 mass production of goods and services. A core element of lean production is the focus on cycle
 times and designing production controls and buffers around any bottlenecks in the system. Hence,
 a production line organized by lean principles will operate in a static or at least quasi-static way.
 While the individualization of products is an interesting business approach, it can influence cycle
 times and in-time production. This work demonstrates how performance losses induced by highly
 variable cycle times can be recovered using a digital twin. The unit under analysis is an industrial
 joiner’s workshop. Due to the high variance in cycle time, the joinery fails its production target,
 even if all machines are below 80% usage. Using a discrete event simulation of the production line,
 different production strategies can be evaluated efficiently and systematically. It is successfully shown
 that the performance losses due to the highly variable cycle times can be compensated using a digital
 twin in combination with optimization strategies. This is achieved by operating the system in a
 non-static mode, exploiting the flexibilities within the systems.

 Keywords: digital twin; customized manufacturing; scheduling optimization; manufacturing
 execution system

1. Introduction

1.1. Scope
     The motivation for this paper is the continuing production planning needs that are associated
with the move from batch manufacturing to single-piece flow. This move requires major changes to
existing production planning processes [1]; many challenges have been experienced with the move
to reduced batch sizes in support of lean production management. The efficiency gains from single
piece flow (SPF) in a factory are often negated by the impact from the additional production planning
and controlling processes [2] and many firms move to a hybrid approach based on smaller batch sizes
and manage the variability though the use of Kanbans. Kanbans can either be static or adaptive in
such production control systems [3]. However, this does not address the challenge that new adaptive
production planning tools are presenting as they provide the opportunity for mass customization.
Mass customization allows the firm to deliver the technical requirements of a customer, but brings
with it complications to the production planning and control processes [4]. Cost data and cycle times
are important within the production process, but also for the sales team during the phase from quoting

J. Manuf. Mater. Process. 2020, 4, 109; doi:10.3390/jmmp4040109                    www.mdpi.com/journal/jmmp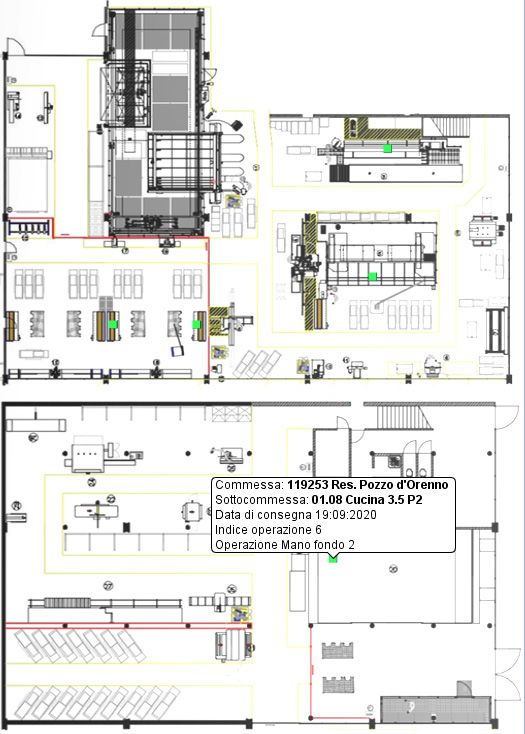
J. Manuf. Mater. Process. 2020, 4, 109                                                              2 of 14

to order acceptance. The customer will want certainty of the delivery date and the firm will want to
understand the margins. During production, the needs change to some degree, but nevertheless the
cost and due date remain key metrics for production.
     The key requirement of a production planning and control system is to provide a balance
between many different requirements from the system [4]. Typical requirements are expressed as
follows: lead time (customer); production cost (manufacture); requirements (customer). Often,
these requirements are directly integrated into the productions key performance indicators (KPI).
For production, the balancing and, in effect, negotiation, of the production plan is time-consuming and
can have many consequential impacts that are initially hidden or unknown [5]. Much of this is due to
the variability of the orders progressing through the factory. This is further compounded by the limited
machine park and associated competencies of the operators, each of which creates system constraints
within the planning processes. This may lead to a loss of balance within the production processes,
which has an impact on cycle times experienced within production [6]. Moving to single-piece flow and
mass customization, this is further compounded through the increased variability of machining times.
     Within the highly variable production environment created by single-piece flows and mass
customization, additional perturbations can be created. Some can be planned for, such as regular
maintenance on the equipment in the machine park, and employees’ holidays. These two events
(one machine based, and one human based) create additional constraints on the system and the
performance. These can, of course, be foreseen and planned for within the planning frames (annual,
monthly, weekly, and daily). Additional complications are created by machine breakdowns and
employees’ illnesses [7]. These cannot be integrated into the planning frames as they are random
events that cause replanning and rescheduling within the daily plan, although they have an impact on
the system constraints for considerably longer.
     The concept of a digital twins offers new possibilities in the design, operation and optimization
of production systems: using models of the systems dynamics and data structures, digital copies of
physical systems can be created [8]. By synchronizing the two systems, one can exploit the benefits of
both words [9]: the physical world, where the actual value-creation of the production system takes
place, and the digital world, which enables fast optimization and analysis loops, whose results are later
deployed to the physical system. It is thus a relevant question whether the aforementioned challenges
of production planning can be helped by using a digital twin of the production system. Using two
case studies, this paper addresses how to provide higher levels of certainty to the planning process
to ensure that costs are minimized and lead times are achieved within the constraints of single piece
flows and mass customizing using a digital twin. This has to both support individual orders and
consider the existing production within the factory. The aim is to integrate an agile planning tool into
the existing manufacturing execution system (MES) within the factory.

1.2. State of the Art
      The concept of lean production introduces several concepts to facilitate production planning
and strengthen the robustness of a system’s performance through the design of the production line.
Balanced SPF production lines aim for a homogenous distribution of the production lead-time (PLT)
over all stations of the production line [10]. By doing so, jams are avoided and the lead-time of one
distinct job does not depend on its position within the schedule. Using concepts like a heijunka-box,
this advantage can be transferred to mixed-product lines [11]. By using the principles of lean production,
the time to completion (TTC) for a set of (homogenous) jobs then depends only on the number of jobs
and is time optimal [10].
      If the diversity of parts produced increases or cycle times vary, these advantages are lost.
Rüttimann and Stöckli therefore suggest combining pareto-optimal production cells with intelligent
production scheduling [12]. According to the authors, this approach will combine the advantages of
lean production principles with high flexibility in product configuration.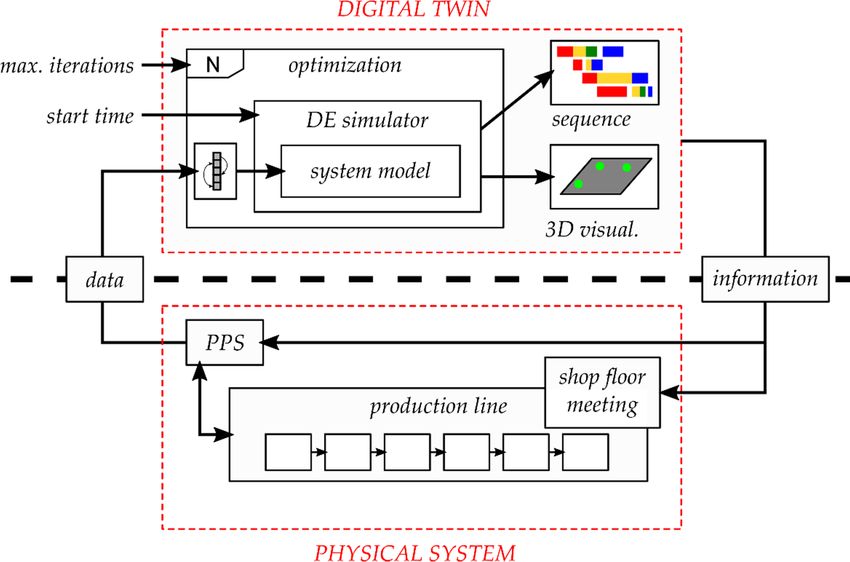
J. Manuf. Mater. Process. 2020, 4, 109                                                                 3 of 14

       Given a set of jobs requiring significantly different cycle times on a set of limited stations, the TTC
will depend on the number of jobs and the scheduling: a slow job can delay a fast job if the latter
cannot overtake it. These kind of scheduling problems are non-polynomial complete (NP-C) [13].
The effort to find the time-optimal strategy increases in a nonlinear fashion with the problem size
(i.e., the number of jobs), while the problem cannot be solved efficiently. In computation science,
this kind of problem is common in scheduling applications for real-time systems: find a schedule
allowing the completion of a set of tasks using limited resources in time. Examples in computational
science show that the problem’s complexity is significantly reduced if one looks only for a feasible
solution by applying strategies such as shortest job first (SJF) [14]. Given a prediction of the resources
and cycle times required, as well as a model of the system, finding a feasible schedule is a procedure
that the literature shows can be mastered.
       Modelling and simulation of production systems enable the system’s performance to be predicted
for a given a scenario. Material flows of linear, as well as branched, production systems can be
modelled using discrete-event (DE) simulations [15,16]. Implementations for DE simulation for
production systems require at least one list of events, a list of stations and one list of moveable objects
(MO). The latter can represent material and/or information, while the list of stations represents the
available machines and cells within the modelled system, as well as their current state [17]. There are
several commercial tools to use for DE simulation in the context of production systems, such as Plant
Simulation [18], DDDSimulator and AnyLogic [19].
       By synchronizing simulation and data models with the physical system, a digital twin of the real
system is obtained. According to Stark and Damerau “a digital twin is a digital representation digital
representation of an active unique product (real device, object, machine, service, or intangible asset) or
unique product-service system (a system consisting of a product and a related service) that comprises
its selected characteristics, properties, conditions, and behaviors by means of models, information,
and data within a single or even across multiple life cycle phases” [8]. A well-founded review of
the types and applications of digital twins is presented by Jones et al. [9]. According to the authors,
a fundamental property of a digital twin is the standardized and/or automatized data exchange between
the physical and the digital world. A detailed characterization of a digital twin for production systems
is provided by the ISO/DIS 23247 [20–23]. This virtual representation of the real system enables time-
and cost-efficiency, as well as the safe testing and optimization of new operational modes. Application
of digital twins in production systems are presented by Park et al. [24] and Ding et al. [25].

2. Materials and Methods
     The aim of the approach presented here is the systematic offline identification of a feasible
production schedule, enabling the completion of the intended throughput of highly customized parts
within time. The approach follows the concept presented in [12] and combines lean production with a
digital twin of the production line, enabling a feasible schedule to be produced.
     Before going into technical details, the following simplified example will demonstrate the outline
of this approach. The example is a linear production line with five process steps and a batch of
15 production jobs. The order of production jobs along the line is fixed; jobs cannot overtake each other.
On average, the line is balanced; hence, the expected cycle time for each job is approximately equal in
every process step. This average cycle time is selected such that the batch’s TTC is approximately 6 h.
The goal is to finish within one shift of 8 h. Then, normal distributed noise in the jobs cycle times is
added. While the variance of this noise is small enough, the TTC of (almost) all scenarios remains
lower than 8 h (see the blue bars in Figure 1). If the variance gets too large, scenarios violating the TTC
limit of 8 h must be expected. In Figure 1, there is an example where only 15% of the scenarios finish
within time (see the red bars). Hence, two cases must be discussed: one with low variance in cycle
time and one with high variance. In both cases, the expected cycle time of each job at each process
step is still the same. On average, both lines are still balanced, but they perform completely differently.
Assuming a model of the line is available and able to predict the job-specific cycle times at each process
J. Manuf. Mater. Process. 2020, 4, 109 4 of 14
J. Manuf. Mater. Process. 2020, 4, x FOR PEER REVIEW 4 of 13
to avoid
step, jamscome
one can as much as possible.
up with Repeating
a clever schedule forthe
theexperiment
jobs within using noisetowith
one batch avoidhigh
jamsvariance
as muchbut as
applying Repeating
possible. SJF-scheduling prior to the
the experiment batch’s
using execution
noise with high a TTC of less
variance butthan 8 h in SJF-scheduling
applying 95% of the scenarios
prior
(see
to theyellow
batch’sbars in Figure
execution 1) can
a TTC be obtained.
of less than 8 h inBy integrating
95% such a (see
of the scenarios model into bars
yellow the workflow
in Figure 1)of can
the
planning, execution and supervision of production jobs, a digital twin in the sense of
be obtained. By integrating such a model into the workflow of the planning, execution and supervisionFigure 9 of [9]
in production
of page 45 is obtained. This digital
jobs, a digital twin intwin operates
the sense in parallel
of Figure to the
9 of [9] physical
in page 45 isproduction system
obtained. This and
digital
operates by reading data from the real system and providing a data transfer to the real
twin operates in parallel to the physical production system and operates by reading data from the realsystem in the
sense ofand
system a feasible schedule.
providing a data transfer to the real system in the sense of a feasible schedule.
Figure
Figure 1. PDF of
1. PDF of the
the time
time to
to completion
completion for
for two
two different
different levels
levels of
of cycle-time
cycle-time variation.
variation.
In
In this
this approach,
approach, this
this simple
simple example
example is
is transferred
transferred to
to aa real
real non-linear
non-linear production
production system
system
following the same schematics as in the example. A digital twin is implemented
following the same schematics as in the example. A digital twin is implemented to to predict thethe
predict TTC of
TTC
aofbatch and apply an optimization strategy to the production schedule to obtain a feasible
a batch and apply an optimization strategy to the production schedule to obtain a feasible production
sequence.
productionHence, the methodology
sequence. includes three
Hence, the methodology important
includes threesteps:
important steps:
1.
1. Analysis of
Analysis of the system and identification of the relevant machines, buffers,
buffers, and
and transportation
transportation
systems, as well as the abstraction of the jobs to be optimized;
2. Development and
Development and implementation
implementation ofof aa digital twin of the branched production system able to
predict the relevant cycle and lead times for a given production
production batch;
batch;
3. Apply
Apply sophisticated
sophisticated optimization
optimization routines
routines toto the
the production schedule in order to identify a
feasible schedule for the given batch.
For step
For step 1,
1, aa walk-through similar to
walk-through similar to aa Gemba
Gemba walk walk [26]
[26] is
is performed.
performed. DuringDuring this
this walk-through,
walk-through,
we familiarize
we familiarize ourselves
ourselves with
with the
the available
available production
production processprocess and
and systems,
systems, the the material
material flow
flow and
and
the characteristic dynamics of the overall system. Secondly, the relevant machines
the characteristic dynamics of the overall system. Secondly, the relevant machines are defined and are defined and
characterizedtogether
characterized togetherwith
withthetheprocess
processowner
owner and
and thethe relevant
relevant production
production layout
layout is extracted
is extracted fromfrom
the
the existing
existing 2D drawings
2D drawings of theofshop
the shop
floor.floor.
In step In2,step
the 2, the production
production systemsystem is deconstructed
is deconstructed into a
into a graph.
graph.
The The nodes
graph’s graph’s nodes represent
represent the single the single and
machines machines and buffer
buffer places, whereas places, whereas
the edges the edges
represent the
represent the transportation
transportation facilities within facilities within
the system. the system.
Production jobsProduction
are modelled jobsasare modelled
moveable as moveable
entities on this
entities Whether
graph. on this graph.
or notWhether
a job is or not a job
allowed to is allowed
move to move
depends on depends
a very basicon aruleset,
very basic ruleset,
similar similar
to the one
to the one used in colored time-dependent petri-nets [27,28]. Each job is parametrized
used in colored time-dependent petri-nets [27,28]. Each job is parametrized by its required production by its required
production sequence—types
sequence—types of machinesof machines
and and times required—and
times required—and its due date.itsFor due date. For example:
example:
• Saw: 45 min;
• Milling machine X: 265 min;
• Bonding station: 135 min;
• Milling machine Y: 45 min;J. Manuf. Mater. Process. 2020, 4, 109 5 of 14
• Saw: 45 min;
• Milling machine X: 265 min;
• Bonding station: 135 min;
• Milling machine Y: 45 min;
• Coating: 612 min;
• Packaging: 35 min;
• Due Date: 31 August 2020.
Operation times are determined and are specified in the production plan for each job. If the
next operation time is 0, the job is sent to the subsequent workstation with a positive operation time.
Machine queues are FIFO and transport times between workstations are constant, i.e., the jobs cannot
overtake each other within a queue. A set of jobs is merged into one batch constrained by a starting
time equal for all the jobs and a finishing time based on the due date of each job. No job is allowed to
enter the system before the start time, while all jobs should be finished before the finishing time.
Using this outline, a DE simulation is implemented. A batch of production jobs and a schedule
coming from the PPS in place are input to the simulation, along with the starting date. The output of
the simulation is the TTC and finishing date for each job in the batch. For the analysis and visualization
of the results, Gantt-charts of the jobs sequence are used, as well as a time-discrete 3D visualization of
the shop floor. The Gantt-charts are used to provide input to the planner and to the machine operator.
In the 3D visualizations, the floorplan of the factory is shown to scale and overlaid with the jobs
moving through the shop floor. This visualization supports the verification of the results of the planner
and enhances the trustfulness of the digital twin by providing a known visual input.
Using a modified sorting algorithm, the solution space is traversed, looking for a feasible schedule
by modifying the production order—and thereby their starting times—within the batch. An exhaustive
sweep over the solution space is not possible due to computational limitations, i.e., the expected time
required exceeds the time available between two batches.
Figure 2 shows the outline of the described digital twin with the procedures discussed. The core of
the digital twin includes a graph-based system model used in a DE simulation acting as a virtual copy
of the real system. If provided with an (existing) job sequence from the PPS in place, the digital twin
will predict the expected material flows and machine utilization and visualize them as a Gantt-chart
and 3D-animation. An additional optimization loop enables the systematic virtual testing of different
production sequences with respect to TTC in order to find a feasible solution, i.e., a job sequence that is
able to finish within time. These visualized pieces of information can then be used in the physical
system’s PPS (e.g., optimal job routine) or shop floor meeting (e.g., training the operators for the
upcoming week’s procedures). Since the digital twin implements its own model of the system, it is
thus more than a pure shadow of the data available in the PPS.chart and 3D-animation. An additional optimization loop enables the systematic virtual testing of
different production sequences with respect to TTC in order to find a feasible solution, i.e., a job
sequence that is able to finish within time. These visualized pieces of information can then be used in
the physical system’s PPS (e.g., optimal job routine) or shop floor meeting (e.g., training the operators
J.for
Manuf. Mater. Process.
the upcoming 2020, 4,procedures).
week’s 109 6 of 14
Since the digital twin implements its own model of the system,
it is thus more than a pure shadow of the data available in the PPS.
Figure 2.
Figure 2. Principal procedure
Principal of the
procedure of digital twin and
the digital twindata/information exchange
and data/information with thewith
exchange physical
the
system.
physical system.
3. Results
In the following section, the application of the approach is demonstrated on an existing
production facility. The company in this application is a Swiss wood joinery firm, which specializes
in manufacturing custom products, mainly furniture, doors and windows. The firm handles about
400 projects per year. A major focus of the company is product customization, with a customer-oriented
design process and a flexible production plan, supporting single-lot product realization. The company
mainly serves business-to-business (B2B) customers, with the majority of products being single pieces
and/or small-lot production commissioned by architects and designers. The manufacturing process
is therefore strongly dependent on product requirements and subject to changes, according to the
customers’ specifications. In general, these products consist of a wooden structure made of joined
parts (e.g., a window frame), including metal components and joints (e.g., closing devices and hinges).
Two use-cases are presented: the first focuses on job sequence optimization, while the second use-case
shows the application of the same procedures to the planning of maintenance.
3.1. System Analysis and Digital Twin Implementation
The typical workflow (not considering raw material procurement) begins with the sawing of
the wooden panels. In order to optimize pattern cutting, the company uses software for placement
of components on each panel. Based on the list of pieces to be produced and the panels available,
the software calculates the best allocation to minimize material consumption, sectioning times and
production costs. Once the sawing process is completed, the panels are labelled and, based on the
specifications, some panels are edge banded. Afterwards, products are drilled and milled on two
different machines. At this point, the operator inserts the metal components and joineries, or directly
sends the parts for final assembly. Once the assembly process has been completed, products are packed
and shipped.
Currently, decisions related to job sequence and part routing inside the plant are taken based on
a rule of thumb, instead of process-specific data. The current open issues related to the production
process revealed during the walk-through are:
• There are no specific rules that regulate the products entering the drilling/milling process;J. Manuf. Mater. Process. 2020, 4, 109 7 of 14
• The production manager does not have information about the trend of the production process;
• The impossibility of defining reliable planning of production throughout the week/month;
• The impossibility of defining a due date with certainty;
• The impossibility of providing clear estimations of production costs and associating them with
specific products, both in the design phase and at budget closure.
For these reasons, the production is subject to several delays and uncertainties that increase
its complexity. The situation led to the decision to use a digital twin to understand and optimize
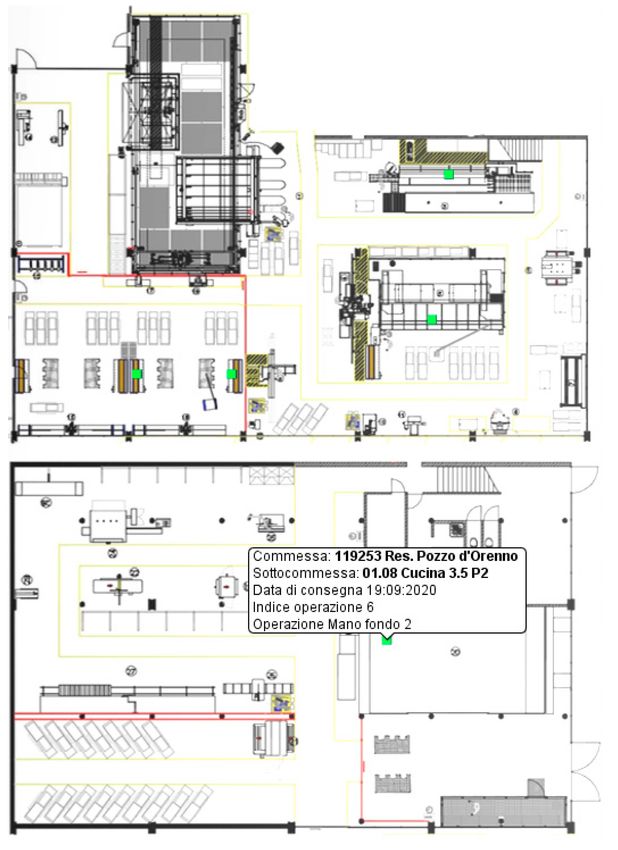
the production plans. Figure 3 shows the identified topology of production identified during the
walk-though and used by the digital twin. The system is modelled as a total of 21 process steps in
a network with five branches. These process steps are located within the layout shown in Figure 4.
The model and simulation part of the digital twin is implemented using DDDSimulator environment
from Technology Transfer System S.r.l. This simulation environment allows users to build logic module
prototypes representing elements of the system to simulate (machines, workplaces) programming in
Java. Such modules can then be used as instances in a visual drag-drop environment and connected
to compose the logics of the simulation model. Moreover, DDDSimulator provides a virtual 3D
environment, which can show material flows and machine movements. This is especially helpful for
the process owners in understanding the simulation results. During the test application, the digital
twin is deployed as a lightweight compiled Java project (Java Archive, JAR).
J. Manuf. Mater. Process. 2020, 4, x FOR PEER REVIEW 7 of 13
Figure 3.
Figure 3. Identified
Identified layout
layout of
of the
the production
production process
process (P:
(P: process
processstep,
step,B:
B:branch).
branch).J. Manuf. Mater. Process. 2020, 4, 109 8 of 14
Figure 4. Identified layout of the production area.
3.2. Use-Case: Feasible Schedule
In this use-case, the digital twin is used on an existing batch. To do so, the job characteristics are
exported from the existing PPS. In the default production sequence (see Table 1), the batch cannot be
finished in time, and five of nine jobs (55%) cannot adhere to their deadline, even if sufficient machine
capacity and time is available. This leads to a total of 22 days of cumulative delay. In a second step,
the production sequence was optimized using the digital twin. As presented in Table 1, following this,
only two of nine jobs (22%) fail to meet the deadline after optimization, with a cumulative delay
of 6 days. Compared to the initial scenario, this translates to an improvement of 60% in deadline
compliance (measured as number of jobs with missed deadlines) and 72% improvement in cumulative
delay. The effects of optimization with regards to the production sequence are shown in Figures 5
and 6, respectively. After optimization, not all the jobs are compliant, but it can be observed that Job 1
will always be late even if it is loaded on day 1, due to its duration.capacity and time is available. This leads to a total of 22 days of cumulative delay. In a second step,
the production sequence was optimized using the digital twin. As presented in Table 1, following
this, only two of nine jobs (22%) fail to meet the deadline after optimization, with a cumulative delay
of 6 days. Compared to the initial scenario, this translates to an improvement of 60% in deadline
J.compliance
Manuf. Mater. (measured
Process. 2020, 4,as
109 number of jobs with missed deadlines) and 72% improvement in
9 of 14
cumulative delay. The effects of optimization with regards to the production sequence are shown in
Figures 5 and 6, respectively. After optimization, not all the jobs are compliant, but it can be observed
1. Performance on the batch before and after sequence optimization for the use-case.
that Job 1Table
will always be late even if it is loaded on day 1, due to its duration.
Initial Optimized
Job Table 1. Performance on
Loading the batch before and
Due after sequence
Finish optimization
Delay [d] for the use-case.Delay [d]
Finish
1 3 September 2020 7 September 2020 8 SeptemberInitial
2020 1 9 September
Optimized 2020 2
2 4Job
September 2020
Loading 11 SeptemberDue2020 8 September
Finish 2020 -
Delay [d] 9Finish
September 2020 Delay [d]
3 7 September
1 2020 2020
3 September 23 September 2020
7 September 2020 17 8September 2020
September 2020 1 - 23 September
9 September 2020 2020 2
4 8 September
2 2020 2020
4 September 25 September 2020
11 September 2020 16 8September 2020
September 2020 - - 25 September
9 September 2020 2020
5 3 7 September
9 September 2020 202015 October
23 September
20202020 2817 September 2020
September 2020 - - 23 September 2020 2020
15 October
6 10 4September
8 September
2020 2020 25 September
18 September 20202020 2316 September 2020
September 2020 - 5 25 September 2020 2020
18 September
7 10 5September
9 September
2020 2020 15 October
22 September 2020
2020 2828 September 2020
September 2020 - 6 15 22
October 2020 2020
September
8 11 6September
10 September 2020 18 September 2020
2020 28 September 2020 123October
September 2020
2020 5
3 18 September 2020
2 September 2020 4
7 10 September 2020 22 September 2020 28 September 2020 6 22 September 2020
9 16 September 2020 1 October 2020 8 October 2020 7 1 October 2020
8 11 September 2020 28 September 2020 1 October 2020 3 2 September 2020 4
9 No. jobs2020
16 September with missed deadline:
1 October 2020 8 October 2020 57 of 9 1 October 2020 2 of 9
No. jobs with missed
cumulative deadline:
delay [d] 5 of 9 22 2 of 9 6
cumulative delay [d] 22 6
Figure
J. Manuf. Mater. Process. 2020,
Figure 5.FOR
4, x5. Production
Production schedule prior
schedule
PEER REVIEW prior to
to optimization
optimization for
for the
the use-case.
use-case. 9 of 13
Figure
Figure 6.
6. Optimized
Optimized production
production schedule
schedule for
for the
the use-case.
use-case.
Use-Case: Planning
3.3. Use-Case: PlanningofofMachine
MachineMaintenace
Maintenace
service are
Planned machine maintenance and service are important
important elements
elements to
to ensure
ensure continuous
continuous quality
quality
cases, maintenance
standards and availability. In many cases, maintenance will
will affect
affect the production,
production, since machines are
are
not available while being serviced. In lean production, this challenge is addressed by the concept
not available while being serviced. In lean production, this challenge is addressed by the concept of
total productive maintenance (TPM, [10]). By doing so, planning of production and planning of
maintenance are not treated as separate topics, but optimized together with respect to the overall
benefit for the company. Using the presented optimization strategy, the concept of TPM can be
applied to the joinery use-case. Therefore, a dummy job is introduced for the machine to be serviced.
This dummy job includes the required time for the planned maintenance, as well as the earliest dateFigure 6. Optimized production schedule for the use-case.
3.3. Use-Case: Planning of Machine Maintenace
Planned
J. Manuf. machine
Mater. Process. 2020,maintenance
4, 109 and service are important elements to ensurecontinuous quality
10 of 14
standards and availability. In many cases, maintenance will affect the production, since machines are
not available while being serviced. In lean production, this challenge is addressed by the concept of
of total productive maintenance (TPM, [10]). By doing so, planning of production and planning of
total productive maintenance (TPM, [10]). By doing so, planning of production and planning of
maintenance are not treated as separate topics, but optimized together with respect to the overall benefit
maintenance are not treated as separate topics, but optimized together with respect to the overall
for the company. Using the presented optimization strategy, the concept of TPM can be applied to the
benefit for the company. Using the presented optimization strategy, the concept of TPM can be
joinery use-case. Therefore, a dummy job is introduced for the machine to be serviced. This dummy
applied to the joinery use-case. Therefore, a dummy job is introduced for the machine to be serviced.
job includes the required time for the planned maintenance, as well as the earliest date possible and
This dummy job includes the required time for the planned maintenance, as well as the earliest date
the due date. By doing so, the machine maintenance is planned with respect to the feasibility of the
possible and the due date. By doing so, the machine maintenance is planned with respect to the
manufacturing schedule, i.e., the completion of the jobs in time should not be affected by the planned
feasibility of the manufacturing schedule, i.e., the completion of the jobs in time should not be affected
maintenance. Figure 7 shows the result of this approach. The scheduler deliberately pre-draws the
by the planned maintenance. Figure 7 shows the result of this approach. The scheduler deliberately
machine maintenance. Hence, a trade-off between fully exploiting the service interval and not affecting
pre-draws the machine maintenance. Hence, a trade-off between fully exploiting the service interval
the finishing in time of the jobs is successfully achieved.
and not affecting the finishing in time of the jobs is successfully achieved.
Figure 7.7.Optimized
Figure maintenance
Optimized schedule
maintenance for thefor
schedule use-case. The red square
the use-case. indicates
The red squaretheindicates
maintenance
the
process.
maintenance process.
4. Discussion
This section is broken into three sections, for the implications of the case, then the academic
considerations, and finally the industrial considerations.
4.1. Case Implications
The firm in the study faces the same challenge as many other engineered-to-order businesses,
in that customer specifications cause every job to be different in one way or another. The customer
order dimensions that have been examined in this case include the physical size and shape, the delivery
dates, the loading order of the delivery, and the machined quality. Within this, there are production
factors that are interrelated, as the firm has a mixture of other projects or jobs that need to be
routed through the factory. Within the production facility there are other constraints, some physical,
some machine-based, and others based on the capabilities of the production workforce. Within the
firm itself there is a complex set of negotiations between sales, production and workshop maintenance
tasks. The production manager has to take a very balanced view of production capacity, and without
the digital twin, the production manager had been using a mixture of spreadsheets and experience.
Visiting the workshop and meeting with the production workers, the production manager has been able
to balance the conflicting requirements and limitations. However, this often results in a detrimental
impact on delivery schedules and potentially a far from optimal position in terms of the firm’s
commercial objectives.J. Manuf. Mater. Process. 2020, 4, 109 11 of 14
Customer specifications are challenging, with variable cycle times and job sequencing that result
in the loss of advantages from a balanced production line designed according to basic lean principles.
The fundamental problem is that balanced production lines have very stiff characteristics and do not
dynamically adjust to situations, meaning that deviations due to different specifications can impact
all the jobs in the line, often with unintended consequences that, with traditional tools, are difficult
to quantify and adjust for in an agile manner. The result is often experienced as a jam in the system,
where upstream jobs are hindered by downstream jobs and this results in a significant capacity loss
that can be shown in reduced productivity and has often been measured in reduced OEE.
Historically there have been two ways to deal with these production losses. The first is to streamline
the product towards a balanced production line (e.g., design for manufacturing, DfM), and thereby
avoid the cycle time variations. This is the approach of mass production and standardization; however,
this does not suit the move to lot-size-one or mass-customization. The second way to deal with
production losses is to learn to exploit the flexibility within the production line, and this work examines
the second way. Though optimizing the production order, it has been shown that it is possible to
reduce the hindering of up-stream jobs. This is done using the advisory support of the digital twin [29]
that provides a small number of feasible solutions based on the system constraints and the associated
variability of each step. The job of the digital twin was not to provide the optimal solution but rather to
support the production manager with planning by providing feasible solutions that allow the project
to be completed on time. It may be possible to find the “best solution”, but this in itself may only be
transient, as sales send new jobs to production. By focusing on a feasible solution, the computational
effort has been shown to be reduced significantly relative to the problem size compared to finding the
optimal solution. The digital twin is also able to integrate variability into a situation (e.g., length of
time on a specific machine), allowing the production manager to better understand the buffers that
exist within the system.
The value for the firm was increased when the production planning system was shared with
the sales function, as it allowed them to inform their customer when delivery could be expected.
With the integration of the knowledge of the time per task, the costing of each job could be improved.
With engineered-to-order production, this can be challenging due to the dynamic nature of job
costing, alternative routings could also be identified with by the digital twin providing increased
flexibility and agility for the production team. The integration of the visuals [30] with the sales
team should make for improved discussions due to the transparency that it provides. In the past,
the integration of maintenance could be problematic, however, with the use of the maintenance rules
it is now possible to include this in the visual planning, both short-term (e.g., daily/weekly) and
longer-term (e.g., monthly/yearly), so that the need for maintenance is not a surprise. Potentially,
opportunities for maintenance as well as planned maintenance could be integrated in the digital
twin visuals. The implications of unplanned maintenance or breakdowns can be better integrated
into the production plan and adaptions made quickly with the consequences clearly visible to all.
Visual management and team decision making is a core concept of lean.
The digital twin should, in the longer term, capture knowledge from the shop floor and provide
additional insights into what is possible [31]. To achieve this, it could be imagined that data could be
captured from the ERP and MES system, and using ML/AI, interacted into the agent-based modelling
approach that is the core of the digital twin. Doing so would support further learning and the ability to
compare plans to actual results. This would be supportive of the firm when new customer projects are
being bid on, where there is limited experience, when hiring or training new staff, or when making
investment decisions for new machines.
4.2. Academic Implications
The integration of the ERP and MES in terms of supporting production control was identified as
important in 2005 by Kelle and Akbulut [32] and, today, this is the basis for many of the software-based
decision support systems in supply chains [33,34]. These systems can support production managers toJ. Manuf. Mater. Process. 2020, 4, 109 12 of 14
make better-informed decisions around planned and unplanned events and support of basic production
planning questions. The dynamic re-planning [35] of production is required today to support the cost
optimization of production; nevertheless, it is generally poorly interpreted into the existing ERP and
MES systems, even though the problem was described over ten years ago [36]. There is a need to
understand why the take-up has been so slow and how ERP and MES systems can be better integrated
to provide dynamic rescheduling and forecasting within the factory environment. Further research on
how to best provide decision making support to allow factories to deal with single-piece flows in a
dynamic environment would be welcomed, given the improvements in the underlying technologies.
4.3. Managerial Implications
The work described in this paper is at an initial stage of development, yet it shows that,
using advanced modelling tools, it is possible to make better production planning decisions.
Single-piece flow brings with it a complexity that does not exist in more traditional batch-based
production. The integration of mass customization creates a more complex problem in production for
both planning and control. In this case, both have been integrated into an advisory tool to provide
support with the planning process within a factory environment where different constraints exist.
The approach was not designed to optimize both costs and delivery time and, in effect, provide a fully
autonomous scheduling system, but rather to support the factory manager and to provide options with
scheduling and allow them to make the final decisions. This is similar to the way Google Maps operates.
The system enabled the integration of changes to system resources to be considered in the longer
term (e.g., planned inspections or staff holidays). The planning tool also supported the understanding
of the consequences of unplanned events on the overall system and the individual orders.
4.4. Conclusions
The goal of the presented use-cases is the successful application of a digital twin in a single-piece
production line subject to high variance in cycle time. Using the instruments in place, a digital twin
based on a DE simulation is implemented and synchronized with the PPS system of the production
line. While the PPS provides production data to the digital twin, the digital twin presents the
required information to the operator to finish the queued jobs in time. Using this rather simple setup,
a significant improvement in the lateness of individual jobs is achieved. The reason for this success is
the combination of the lean tools already in place providing the robustness, and the superior intelligence
of the digital twin providing the required flexibility in the system. This paper further demonstrates
that the concept presented in the state-of-the-art applications of digital twins in production systems can
successfully be transferred to traditional small-scale shop floors and still provide a significant leverage.
Author Contributions: Conceptualization, S.Z. and S.W.; methodology, A.B., D.P. and S.Z.; software, D.P.;
validation, A.B. and D.P.; formal analysis, A.B. and D.P.; investigation, A.B., D.P., S.Z., O.S. and S.W.; resources,
D.P.; data curation, D.P.; writing—original draft preparation, S.Z., S.W., D.P. and A.B.; writing—review and editing,
S.W. and S.Z.; visualization, D.P. and S.Z.; supervision, S.Z.; project administration, S.W., O.S.; funding acquisition,
S.W. All authors have read and agreed to the published version of the manuscript.
Funding: This research was funded by Innosuisse, grant number 35258.1 IP-SBM.
Acknowledgments: The practical application of this work and the use-case study has been enabled by Veragouth
SA, Bedano, Switzerland.
Conflicts of Interest: The authors declare no conflict of interest. The funders had no role in the design of the
study; in the collection, analyses, or interpretation of data; in the writing of the manuscript, or in the decision to
publish the results.
References
1. Lander, E.; Liker, J.K. The Toyota Production System and art: Making highly customized and creative
products the Toyota way. Int. J. Prod. Res. 2007, 45, 3681–3698. [CrossRef]J. Manuf. Mater. Process. 2020, 4, 109 13 of 14
2. Powell, D.; Lodgaard, E.; Dreyer, H. Investigating the Challenges and Opportunities for Production Planning
and Control in Digital Lean Manufacturing. In Advances in Production Management Systems. Towards Smart
and Digital Manufacturing; Springer International Publishing: Cham, Switzerland, 2020; pp. 425–431.
3. Le Pallec Marand, L.; Sakata, Y.; Hirotani, D.; Morikawa, K.; Takahashi, K. An Adaptive
Kanban and Production Capacity Control Mechanism. In Advances in Production Management
Systems. Competitive Manufacturing for Innovative Products and Services; Springer: Berlin/Heidelberg, Germany,
2013; pp. 452–459.
4. Deradjat, D.; Minshall, T. Decision trees for implementing rapid manufacturing for mass customisation.
CIRP J. Manuf. Sci. Technol. 2018, 23, 156–171. [CrossRef]
5. Fatorachian, H.; Kazemi, H. Impact of Industry 4.0 on supply chain performance. Prod. Plan. Control 2020,
1–19. [CrossRef]
6. Lam, N.T.; Toi, L.M.; Tuyen, V.T.T.; Hien, D.N. Lean Line Balancing for an Electronics Assembly Line.
Procedia CIRP 2016, 40, 437–442. [CrossRef]
7. Boschian, V.; Rezg, N.; Chelbi, A. Contribution of simulation to the optimization of maintenance strategies
for a randomly failing production system. Eur. J. Oper. Res. 2009, 197, 1142–1149. [CrossRef]
8. Stark, R.; Damerau, T. Digital Twin. In CIRP Encyclopedia of Production Engineering; Chatti, S., Tolio, T., Eds.;
Springer: Berlin/Heidelberg, Germany, 2019; pp. 1–8.
9. Jones, D.; Snider, C.; Nassehi, A.; Yon, J.; Hicks, B. Characterising the Digital Twin: A systematic literature
review. CIRP J. Manuf. Sci. Technol. 2020, 29, 36–52. [CrossRef]
10. Rüttimann, B.G. Lean Compendium Introduction to Modern Manufacturing Theory; Springer: Berlin/Heidelberg,
Germany, 2017; p. 149.
11. Rother, M. Toyota Kata: Managing People for Improvement, Adaptiveness and Superior Results;
McGraw-Hill Education: New York, NY, USA, 2009.
12. Rüttimann, B.G.; Stöckli, M.T. Lean and Industry 4.0—Twins, partners, or contenders? A due clarification
regarding the supposed clash of two production systems. J. Serv. Sci. Manag. 2016, 9, 485–500. [CrossRef]
13. Ullman, J.D. NP-complete scheduling problems. J. Comput. Syst. Sci. 1975, 10, 384–393. [CrossRef]
14. Cormen, T.H. Introduction to Algorithms, 3rd ed.; MIT Press: Cambridge, MA, USA, 2009; p. 1292.
15. Banks, J.; Carson, J.S., II; Barry, L. Discrete-Event System Simulation, 4th ed.; Pearson: London, UK, 2005.
16. Robinson, S. Simulation: The Practice of Model Development and Use; Wiley: Hoboken, NJ, USA, 2004.
17. Nutaro, J.J. Building Software for Simulation: Theory and Algorithms, with Application in C++; Wiley Online Library:
Hoboken, NJ, USA, 2011.
18. Siderska, J. Application of Tecnomatix Plant Simulation for Modeling Production and Logistics Processes.
Bus. Manag. Educ. 2016, 14, 64–73. [CrossRef]
19. Borshchev, A. The Big Book of Simulation Modeling: Multimethod Modeling with AnyLogic 6; AnyLogic North
America: Chicago, IL, USA, 2013.
20. ISO. ISO/DIS 23247-1 Automation Systems and Integration—Digital Twin Framework for Manufacturing;
International Organization for Standardization: Geneva, Switzerland, 2020.
21. ISO. ISO/DIS 23247-2 Automation Systems and Integration—Digital Twin Framework for Manufacturing;
International Organization for Standardization: Geneva, Switzerland, 2020.
22. ISO. ISO/DIS 23247-3 Automation Systems and Integration—Digital Twin Framework for Manufacturing;
International Organization for Standardization: Geneva, Switzerland, 2020.
23. ISO. ISO/DIS 23247-4 Automation Systems and Integration—Digital Twin Framework for Manufacturing;
International Organization for Standardization: Geneva, Switzerland, 2020.
24. Park, K.T.; Lee, J.; Kim, H.-J.; Noh, S.D. Digital twin-based cyber physical production system architectural
framework for personalized production. Int. J. Adv. Manuf. Technol. 2020, 106, 1787–1810. [CrossRef]
25. Ding, K.; Chan, F.T.S.; Zhang, X.; Zhou, G.; Zhang, F. Defining a Digital Twin-based Cyber-Physical Production
System for autonomous manufacturing in smart shop floors. Int. J. Prod. Res. 2019, 57, 6315–6334. [CrossRef]
26. Imai, M. Gemba Kaizen a Commonsense Approach to a Continuous Improvement Strategy, 2nd ed.; McGraw-Hill:
New York, NY, USA, 2012; p. 426S.
27. David, R.; Alla, H.; Alla, H.L. Discrete, Continuous, and Hybrid Petri Nets; Springer: Berlin/Heidelberg,
Germany, 2005.
28. Reisig, W. Petrinetze Modellierungstechnik, Analysemethoden, Fallstudien (Leitfäden der Informatik); Vieweg:
Wiesbaden, Germany, 2010.J. Manuf. Mater. Process. 2020, 4, 109 14 of 14
29. Kunath, M.; Winkler, H. Integrating the Digital Twin of the manufacturing system into a decision support
system for improving the order management process. Procedia CIRP 2018, 72, 225–231. [CrossRef]
30. Kahl, T.; Zimmer, F. Kontextspezifische Visualisierung von Prozesskennzahlen. In Geschäftsprozesse: Von der
Modellierung zur Implementierung; Barton, T., Müller, C., Seel, C., Eds.; Springer Fachmedien Wiesbaden:
Wiesbaden, Germany, 2017; pp. 75–97.
31. Zhang, C.; Zhou, G.; He, J.; Li, Z.; Cheng, W. A data- and knowledge-driven framework for digital twin
manufacturing cell. Procedia CIRP 2019, 83, 345–350. [CrossRef]
32. Kelle, P.; Akbulut, A. The role of ERP tools in supply chain information sharing, cooperation, and cost
optimization. Int. J. Prod. Econ. 2005, 93–94, 41–52. [CrossRef]
33. Hilletofth, P.; Lättilä, L. Agent based decision support in the supply chain context. Ind. Manag. Data Syst.
2012, 112, 1217–1235. [CrossRef]
34. Linnartz, M.; Stich, V. Software-Based Assistance System for Decision Support on Supply Chain Level.
In Advances in Production Management Systems. The Path to Digital Transformation and Innovation of Production
Management Systems; Springer International Publishing: Cham, Switzerland, 2020; pp. 209–216.
35. Liu, S.; Wang, L.; Wang, X.V.; Wiktorsson, M. A Framework of Data-Driven Dynamic Optimisation for Smart
Production Logistics. In Advances in Production Management Systems. Towards Smart and Digital Manufacturing;
Springer International Publishing: Cham, Switzerland, 2020; pp. 213–221.
36. Ivanov, D. An adaptive framework for aligning (re)planning decisions on supply chain strategy, design,
tactics, and operations. Int. J. Prod. Res. 2010, 48, 3999–4017. [CrossRef]
Publisher’s Note: MDPI stays neutral with regard to jurisdictional claims in published maps and institutional
affiliations.
© 2020 by the authors. Licensee MDPI, Basel, Switzerland. This article is an open access
article distributed under the terms and conditions of the Creative Commons Attribution
(CC BY) license (http://creativecommons.org/licenses/by/4.0/).You can also read