TOP LOCATIONS IN ASIA - TECHNOLOGY SECTOR - Colliers International
←
→
Page content transcription
If your browser does not render page correctly, please read the page content below
COLLIERS RADAR                         OFFICE (TECHNOLOGY SECTOR) | ASIA | 19 SEPTEMBER 2018

         Andrew Haskins
Executive Director | Research | Asia
         +(852) 2822 0511
  Andrew.Haskins@colliers.com

            Terry Suen
Associate Director | Research | Asia
         +(852) 2822 0579
     Terry.Suen@colliers.com

                                       TOP LOCATIONS IN ASIA –
                                       TECHNOLOGY SECTOR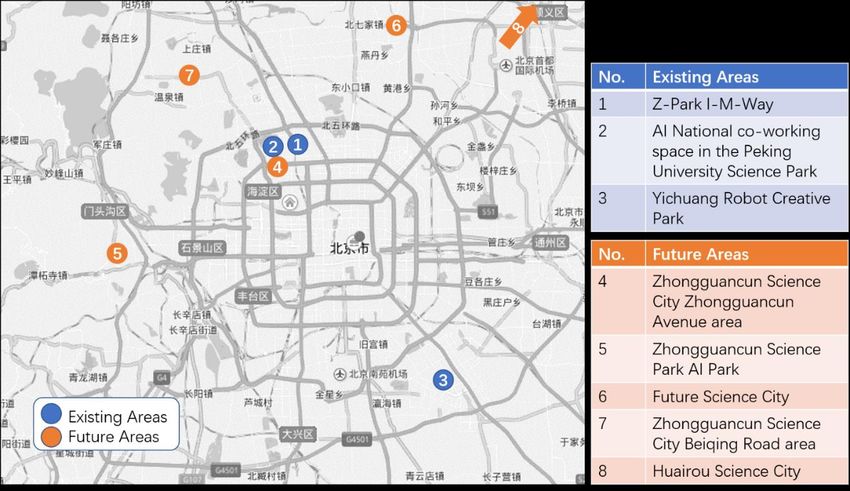
COLLIERS RADAR    OFFICE (TECHNOLOGY SECTOR) | ASIA | 19 SEPTEMBER 2018

                                                               Overall score: three cities on 61% or higher
                 Summary & Recommendations
                                                                 70%                                            Socio-Economic              Property   Human
                 Based on quantitative and qualitative
                 analysis of socio-economic, property and        60%
                 human factors, Colliers concludes that the      50%
                 three top location choices in Asia for
                 technology occupiers are Bangalore,             40%
                 Singapore and Shenzhen.                         30%
                 > Bangalore’s first place reflects Asia’s       20%
                   top long-run growth, depth of talent
                   pool, ample office stock, low staff costs     10%
                   and rents, and a low cost of living.           0%
                 > Singapore’s second place reflects its
                   strong reputation as a source of talent
                   and leading position on aspirational
                   measures; this outweighs the city’s         Source: Colliers International, based on data inputs from numerous sources
                   lower ranking on property metrics.
                 > Third-placed Shenzhen has seen its          Colliers’ “Top Locations in Asia (Technology)” report builds on our earlier “Tech Trends in Asia” research
                   technology base widen through high          by recommending the best urban locations for technology occupiers. For 16 cities in developed and
                                                               emerging markets, we examine nearly 50 criteria relevant to choice of location under three headings,
                   R&D. It scores well on property factors,
                                                               socio-economic factors, property factors and human factors, and assign a score on each metric.
                   reflecting ample availability of office
                   stock and high planned new supply.          “Tech Trends in Asia” had four conclusions. Acquiring Talent is the key challenge for technology groups
                                                               in Asia. Talent is concentrated in specific cities in key markets, notably Chindia (China and India), which
                 Bottom-up analysis of factors such as
                                                               also offer high growth. To retain talent, technology groups need to move toward the CBD or CBD fringe.
                 planned strategic development suggests        Finally, artificial intelligence (AI) threatens demand for space, but will drive growth and returns. These
                 that Beijing and Hyderabad are more           conclusions lead us to weight growth and availability of talent highly in our “Top Locations” scoring.
                 attractive than their scores suggest. These
                 cities represent attractive alternative       Three cities score 61% or above: Bangalore, Singapore, Shenzhen. These are the top choices for starting
                 location choices on a medium-term view.       or expanding technology operations in Asia. Bangalore scores highly on long-run growth and low costs;
                                                               Singapore scores highly as a talent source and on aspirational metrics; Shenzhen ranks well on property
                 Hong Kong may also rise as a tech centre.     measures. Beijing and Hyderabad are attractive alternatives, and Hong Kong is starting to be exciting.
                 It should benefit from proximity to South
                 China, recent expansion by big technology     The scores for the other cities lie between 60% and 50%. Dull long-run growth prospects hold down
                 groups, and surging investment in fintech.    developed cities like Tokyo and Taipei, despite good scores on human factors. Emerging cities mostly
                                                               have high growth and low costs, but suffer on employment criteria and human aspirational metrics.
   2
COLLIERS RADAR    OFFICE (TECHNOLOGY SECTOR) | ASIA | 19 SEPTEMBER 2018

                 CITY HEAT MAP – TECHNOLOGY

                                                                                                            Bangalore
                                                                                                    Human
                                                                                                    12.6%
                                                                                                                          Socio-
                                                                                                                        economic
                                                                           Seoul                                          33.1%
                                                                                                Property
                                                               Beijing                           22.2%

                                        Hyderabad                                       Tokyo
                                                                                                            Singapore
                                                Chengdu
                                                                             Shanghai              Human
                          Delhi NCR                                                                13.4%
                                                      Guangzhou
                                                                             Taipei
                        Mumbai                      Shenzhen                                                              Socio-
                                                                                                                        economic
                                                                                                Property
                                                                                                                          35.6%
                                                                                                 13.6%
                                                               Hong Kong
                                             Bangalore                        Manila

                                                                                                            Shenzhen
                                                                                                    Human

                                         Singapore                                                  10.1%

                                                                                                                          Socio-
                                                                                                                        economic
                                                     Jakarta                                                              29.2%
                                                                                                Property
                                                                                                 21.6%

   3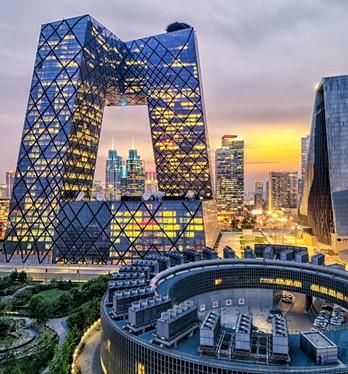
COLLIERS RADAR     OFFICE (TECHNOLOGY SECTOR) | ASIA | 19 SEPTEMBER 2018

                 TOP TECH LOCATIONS
                 Bangalore                                                                                                  Shenzhen
                 Score: 68%. Overall position: #1                                                                           Score: 61%. Overall position : #3
                 > Est. avg. real GDP growth 9.6% over 5 years                                                              > Higher GDP than HK, broad technology base
                 > Office stock: 141mn sq ft (13.1mn sq metres)                                                             > Ample office and flexible space; supply over
                                                                                                                               2018-20 exceeds office stock at end-2017
                 Bangalore’s greatest strengths are socio-
                 economic: the city looks set to be the fastest-                                                            Heavy investment in R&D has broadened
                 growing in Asia over the next five and perhaps                                                             Shenzhen’s technology base far beyond originally
                 the next ten years, and it benefits from a wide                                                            dominant hardware manufacturing. Shenzhen
                 and deep talent pool. Other advantages of                                                                  scores well on property factors, due to moderate
                 Bangalore include the largest stock of Grade A                                                             employer costs, ample availability of office stock
                 office space in Asia after Tokyo, low employer                                                             and flexible workspace, and planned new supply.
                 costs (reflecting moderate staff costs and office                                                          Shenzhen has overtaken Hong Kong by GDP and
                 rents), and a low cost of living. However,                                                                 should benefit over time from closer integration
                 Bangalore scores less well on measures of quality                                                          of the Greater Bay Area. New development of
                 of office accommodation and quality of                                                                     the Qianhai district and the large-scale renewal
                 infrastructure.                                                                                            of the Luohu district are additional strengths.

                                                                     Singapore
                                                                     Score: 63%. Overall position : #2
                                                                     > #1 for talent and on employment criteria
                                                                     > #1 on human aspirational measures
                                                                     Singapore’s second place reflects the city’s high
                                                                     score on socio-economic factors, due largely to
                                                                     its strong reputation as a source of talent, as well
                                                                     as a high position on aspirational measures such
                                                                     as personal tax rate, safety and lining quality.
                                                                     Looking ahead, Singapore should continue to
                                                                     benefit from its position as the natural financial
                                                                     and communications hub of South East Asia, and
                                                                     from the government-supported transition to
                                                                     the so-called Fourth Industrial Revolution. We
                                                                     envisage supply of business park and high-
                                                                     specification industrial space doubling by 2030.

   4
COLLIERS RADAR     OFFICE (TECHNOLOGY SECTOR) | ASIA | 19 SEPTEMBER 2018

                 ALTERNATIVE TECH LOCATIONS                                                                                    WILD CARD TECH LOCATION
                 Beijing                                                                                                       Hong Kong
                 Score: 60%. Overall position : #4                                                                             Score: 59%. Overall position : #8
                 Beijing scores highly on economic scale and                                                                   Hong Kong is not usually seen as a key centre of
                 growth potential, and is respected as a source of                                                             innovation, and we are not ready to recommend
                 talent. It is China’s leading university city; and we                                                         it as a top location for technology occupiers.
                 note that the technology occupiers in our “Tech                                                               However, Hong Kong is becoming more exciting
                 Trends” report of December 2017 considered                                                                    for several reasons. These include proximity to
                 Beijing/North China to be the single greatest                                                                 Shenzhen and South China; recent expansion in
                 source of talent within Asia. Staff costs are                                                                 Hong Kong by technology leaders like Facebook
                 moderate even if CBD rents are the highest in                                                                 and Alibaba; and accelerating investment in
                 China. The city scores less well on measures of                                                               fintech in the city, including planed expansion by
                 human aspiration. Beijing appears especially                                                                  major banks like JP Morgan. In addition, the
                 well-placed to strengthen its position as a                                                                   Hong Kong Science & Technology Park is helping
                 leading centre in the field of artificial intelligence                                                        to nurture new technology talent, providing over
                 (AI).                                                                                                         3.5 million sq ft (325,280 sq m) of laboratory and
                                                                                                                               office space.

                                                                          Hyderabad
                                                                          Score: 59%. Overall position : #7
                                                                          Like all Indian cities, Hyderabad scores highly on
                                                                          growth potential, although it scores less well on
                                                                          other socio-economic factors and does not yet
                                                                          match Bangalore as a source of talent. Office
                                                                          stock currently stands at only 40% of the level of
                                                                          Bangalore, but development is proceeding
                                                                          apace, with total stock set to increase by 60% by
                                                                          2021 by our estimate. The fact that technological
                                                                          development is focused in one district, Hitec
                                                                          City, makes planning in Hyderabad relatively
                                                                          easy. Tax rates and cost of living are low, and
                                                                          Hyderabad scores better than many other Indian
                                                                          cities on other human factors.

   5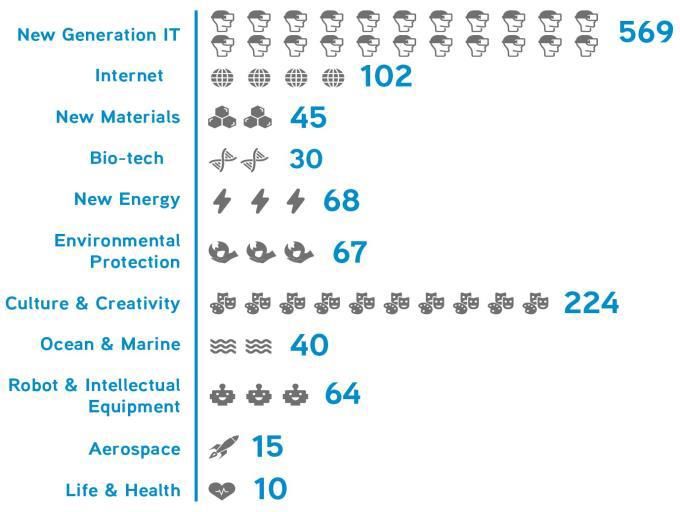
COLLIERS RADAR    OFFICE (TECHNOLOGY SECTOR) | ASIA | 19 SEPTEMBER 2018

                 TABLE OF CONTENTS
                                                                 Page                                                                          Page

                 Summary and recommendations                      2        Hong Kong                                                           18

                 City heat map                                    3        Recapitulation of “Tech Trends in Asia”                             20

                 Top, alternative and wild card tech locations    4        Scoring methodology                                                 21

                 Introduction                                     6        Summary of overall scores                                           23

                 Bangalore                                        7        Scoring and ranking                                                 24

                 Singapore                                        9       INTRODUCTION TO
                                                                          “TOP LOCATIONS IN ASIA”
                 Shenzhen                                        11       Colliers’ “Top Locations in Asia” research aims to identify and recommend
                                                                          the best urban locations in Asia for three major Occupier segments:
                                                                          Technology, Finance and Law. We examine a wide range of considerations
                                                                          relevant to choice of location under three headings: socio-economic factors,
                 Beijing                                         14       property factors and human factors. Altogether we examine 16 large Asian
                                                                          cities in both developed and emerging countries. This report presents the
                                                                          conclusions of our work for the technology sector. Our analysis draws on
                 Hyderabad                                       16       earlier research that we have carried out on the technology sector,
                                                                          especially our report “Tech Trends in Asia” (5 December 2017).

   6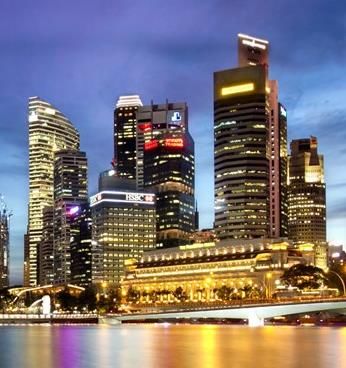
COLLIERS RADAR       OFFICE (TECHNOLOGY SECTOR) | ASIA | 19 SEPTEMBER 2018

                                                                                                    Under the heading of property factors, other advantages of Bangalore
                  CITY PROFILES                                                                     include low employer costs, reflecting moderate staff costs and office rents.
       67.9%                                                                                        Under the heading of human factors, Bangalore benefits from a low cost of
                  Bangalore                                                                         living, although it scores less well on measures of quality of office
       Human
                                                                                                    accommodation and quality of infrastructure.
       12.6%      Bangalore (Bengaluru) scores 68% in our ranking and comes first overall.
                  Bangalore, the Silicon Valley of India, is the largest office market in the       Disadvantages of Bangalore include relative India’s relative remoteness from
                  country, with total Grade A stock of 141 million sq ft (13.1 million sq metres)   markets in East Asia and increasing congestion. The latter problem results
       Property   spread across multiple micromarkets. On this basis Bangalore ranks as the         from the fact that investment in infrastructure has not kept pace with
        22.2%                                                                                       overall development. For example, while the Outer Ring Road in Bangalore
                  second largest urban office market in Asia after Tokyo. Bangalore thus offers
                  technology occupiers ample space to house their operations.                       remains one of Asia's leading technology hubs, Colliers India Research has
                                                                                                    identified seven bottlenecks or "pain points" along the route. Infrastructure
                  In recent years the information technology sector has accounted for 60–70%        problems are not great enough to change our view on Bangalore, but are a
         Socio-   of gross absorption of space in India (although this proportion has been          risk to watch.
       economic   slipping due to increased demand from other sectors), and because
        33.1%     Bangalore is IT companies' location of choice, the city has usually accounted     The table below compares Bangalore and its emerging rival Hyderabad on
                  for 30–35% of gross office absorption across the whole country. In Q2 2018,       various measures. Further comparisons are included in the section of this
                  we estimate that this figure was 34%.                                             report on Hyderabad.
                  Apart from its high stock of office space, Bangalore’s biggest advantages are
                  high long-run economic growth potential and its deep talent pool. Regarding        Comparison – Bengaluru vs Hyderabad
                  growth potential, Oxford Economics places Bangalore at the top of its list of
                  growth forecasts for Asian cities over the next five years and ten years (see,     Parameter                                                     Bengaluru                Hyderabad
                  e.g. Oxford Economics’ Asia Pacific Cities & Regions Outlook of March 2018),
                  with real GDP set to rise at an average annual rate of 9.6% over the next five.
                                                                                                     Total stock                                                   141.3 msf                  56.4 msf
                  Regarding talent pool, Bangalore remains the clear preference of most
                  technology groups, with the sector accounting for 45% of total office leasing      Gross absorption
                                                                                                                                                                    28.1 msf                  11.0 msf
                  volume in Q2 2018. Technology was followed by flexible workspace                   (Cumulative 2016–17)
                  representing 26% of leasing volume, engineering and manufacturing on 16%,          % share of absorption by IT-ITeS occupiers
                  and banking on 11%.                                                                                                                                  59%                       81%
                                                                                                     (Cumulative 2016–17)
                  Bangalore’s popularity with technology occupiers reflects the fact that it
                  comes top in India on measures of talent availability. In our research we          Upcoming supply (2018–2021)                                    23.0 msf                  33.0 msf
                  have combined the top university, international outlook, research and
                  teaching rankings supplied by the Times Higher Education World University          Overall vacancy rate (Q2 2018)                                    10%                        6%
                  Rankings into a single weighted score. Bangalore scores 8.4% – well behind
                  top-ranked Singapore on 15.0%, but ahead of Delhi on 4.6% or, for that            Source: Colliers International India Research
                                                                                                    Note: Only Grade A office spaces are considered; IT-ITeS – Information Technology and Information Technology
                  matter, Taipei on 6.9% and even Shanghai on 7.7%.                                 enabled Services; msf – million square feet

   7
COLLIERS RADAR        OFFICE (TECHNOLOGY SECTOR) | ASIA | 19 SEPTEMBER 2018

                  Bangalore: map of technology micromarkets

                                                                                                         North             3.9 43
                                                                                                         Bengaluru        0.8 0.4
                                                                                                                                              Outer Ring         73 5.0
                                                                                                                                              Road               7.1 4.2

                                                                         4.8 1.4
                                                                                     CBD                                                                                28 8.7
                                                                         1.4 0.5                                                                    Whitefield
                                                                                                                                                                       1.4 0.9
                                                                          22 5.3
                                                                                     SBD
                                                                         2.4 1.0
                                                      2.9 22
                                                                 Mysore Road
                                                      0.1 0.1
                                                                                                                                                            1.8 8.3
                                                                                                                                        Hosur Road
                                                                                                                                                            0.5 0.3

                                                                 2.8 1.7 Bannerghatta
                                                                                                                                                             2.5 3.2
                                                                 0.3 0.2 Road                                                             Electronic City
                                                                                                                                                             0.9 0.7

                   Notes:
                   CBD includes MG Road, Richmond Road, Infantry Road, Cunningham Road, Sankey Road,
                   Palace Road, Vittal Mallaya Road and others.                                                      Total Grade A stock in msf (Q2 2018)        Grade A vacancy (in %, Q2 2018)
                   SBD includes Indiranagar, Domlur, Koramangala, CV Raman Nagar, Intermediate Ring
                   Road and others.
                   North Bengaluru includes Hebbal, Thamisandra Road and Yelahanka.                                  Total gross absorption in msf (2017)        Total gross absorption by IT-ITeS occupiers in msf (2017)
                   IT-ITeS – Information Technology and Information Technology enabled Services; msf –
                   millions of square feet.

                 Source: Colliers International India Research
   8
COLLIERS RADAR       OFFICE (TECHNOLOGY SECTOR) | ASIA | 19 SEPTEMBER 2018

                  Singapore                                                                          of living, air pollution and the “High-Tech City” measure that Colliers has
                                                                                                     derived from 2thinknow and the World Economic Forum. Bangalore and
                  Singapore scores 63% in our ranking and comes second overall.                      Hyderabad also score highly on human factors, but this is mainly due to low
       62.6%      Socio-economic factors
                                                                                                     cost of living. Taipei, Seoul and Tokyo approach Singapore on human factors,
                                                                                                     but do not quite match it.
       Human      Under socio-economic factors, Singapore does not score highly on measures
       13.4%      of growth potential or economic output; this is natural considering that
                                                                                                     Looking forward
                  Singapore is a small country with a population of just 5.6 million people.         As an example of Singapore’s attraction to major technology enterprises,
       Property
                  However, Singapore ranks in first place in Asia as a source of talent,             Facebook, the huge social media group, recently announced a plans to build
        13.6%
                  reflecting the strength of the country’s educational and research facilities       an SGD1.4 billion (USD1.0 billion) data centre in Singapore, its first such in
                  and their perceived international outlook. Singapore also ranks first overall      Asia, The data centre will be located in Tanjong Kling which was formerly
                  on employment considerations: political stability, ease of doing business,         known as Data Centre Park, and is due to start operations in 2022. Upon
         Socio-   corporate tax rate, city infrastructure and English language capability.           completion, it will be a 170,000 square metre (1.83 million sq feet), 11-
       economic                                                                                      storey building². Facebook stated, “We selected Singapore for a number of
        35.6%
                  It is in any case questionable whether the modest scores on growth
                  potential and economic output are fair. One of the key attractions of              reasons, including robust infrastructure and access to fiber, a talented local
                  Singapore to multinational enterprises is the country’s position as the            workforce, and a great set of community partners, including the Singapore
                  natural financial and communications hub for South East Asia. In many              Economic Development Board and the Jurong Town Corporation…”³.
                  respects, Singapore is a gateway to the entire ASEAN region with a                 Looking beyond this decade, we believe that the Singapore government has
                  combined population of 636 million¹ due not least to Indonesia’s position as       a strong understanding of what is required for Singapore to remain a major
                  the world’s fourth most populous country. This consideration may be less           technology hub. As Colliers has argued elsewhere4, the transition to the so-
                  important in the technology sector than in other sectors, but it is true.          called Fourth Industrial Revolution or Industry 4.0 should see industrialists
                                                                                                     embrace technologies such as Big Data and analytics, augmented reality,
                  Property factors
                                                                                                     additive manufacturing, simulation, the Internet of Things (IOT) and
                  Singapore achieves average scores on property factors. Despite high per            autonomous robots. Industry 4.0 brings exciting opportunities and
                  capita income, the country’s position on employer costs is moderate,               challenges to Singapore's industrial landscape. The Singapore government
                  reflecting average rent for CBD prime grade office space of USD55 per sq           has been supporting the transformation with new national directives aimed
                  metre per month or only about one-half of the level of Singapore’s regional        at creating innovative new industrial and technology parks. The plan for
                  rival, Hong Kong. Singapore does not score well on office accommodation            these new parks is shown in the map overleaf.
                  measures. The city is held back by limited total prime grade office stock of
                                                                                                     In our view, Industrial space of the future should provide the 3 "A's":
                  24.3 million sq ft (2.26 million sq metres); this is only one-third of the level
                                                                                                     Accessibility, Affordability, Adaptability. Even as pilot schemes for flexible
                  of Hong Kong and a fraction of the level of the larger markets like the major
                                                                                                     land uses for industrial purposes are being tested, we envisage supply of
                  India cities or Tokyo. Singapore does, however, rank well on the
                                                                                                     business park and high-specification spaces doubling in Singapore by 2030.
                  sustainability index and city innovation index also included in our criteria.
                  Human factors                                                                      ¹ Source: Statista
                                                                                                     ² See, for example, https://www.channelnewsasia.com/news/business/facebook-data-centre-singapore-jobs-
                  Singapore ranks first in Asia on human factors. A moderate personal tax rate       asia-10688962
                  is an important positive factor despite a high overall cost of living. Singapore   ³ Source: Facebook, https://www.facebook.com/notes/singapore-data-center/facebook-is-growing-in-
                                                                                                     asia/1911065865865814/
                  then scores very highly on aspirational measures such as city safety, quality      4 See our report “Industry 4.0 - future-proofing Singapore's industrial landscape” (18 January, 2018)

   9
COLLIERS RADAR       OFFICE (TECHNOLOGY SECTOR) | ASIA | 19 SEPTEMBER 2018

                  Singapore Industrial Landscape by year 2030

                 Source: Colliers International Singapore Research, JTC, URA
   10
COLLIERS RADAR OFFICE (TECHNOLOGY SECTOR) | ASIA | 19 SEPTEMBER 2018
Shenzhen
Strong GDP growth is driving Shenzhen Heavy investment in R&D boosts technology ecosystem
60.9% Within China, technology hardware groups have shown a strong preference Shenzhen’s ascent owes much to heavy investment in research and
Human
up to now for the Pearl River Delta of South China, with large enterprises development (R&D). Since 2013, Shenzhen has invested more than 4% of its
10.1% such as Huawei and ZTE headquartered in Shenzhen. The region is also well- GDP annually on research and development. The total R&D expenditure
known as the chief industrial base of Foxconn (Hon Hai), the Taiwanese exceeded RMB80 billion (USD12.3 billion) or 4.1% of GDP in 2017, according
group which is the world's largest contract electronics producer. As a result, to data collated by the South China Morning Post – a higher level than in any
Property the Pearl River Delta, now increasingly termed the Greater Bay Area and of Guangzhou, Hong Kong and Singapore.
21.6%
understood to include Hong Kong and Macau, has become one of the
As a consequence of this heavy investment in R&D, Shenzhen’s economic
world's leading industrial regions and its biggest overall manufacturing hub.
base has extended far beyond hardware manufacturing, and it now enjoys a
Symptomatic of the emergence of the Greater Bay Area has been the rise of much broader technology ecosystem. Emerging industry, a term used by the
Socio- Shenzhen, which is still growing at nearly 8% YOY in terms of real GDP. In local government to refer to the collection of tech-relevant industries,
economic 2017, Shenzhen’s total GDP overtook Hong Kong’s and exceeded the achieved 13.6% growth with added value of RMB918.3 billion (USD141.0
29.2%
RMB2.2 trillion (USD350 billion) mark for the first time; its GDP was less than billion) in 2017 and accounted for 40.9% of Shenzhen's total GDP. For
half the size of Hong Kong’s ten years before. Shenzhen has also overtaken specific sub-sectors, internet has increased its added value by 12.5%, new-
Guangzhou, the traditional industrial and trading centre of the region. generation IT by 23.4%, and aerospace by 30.5% in 2017 compared to 2016.
Chinese cities incl. Hong Kong by GDP at current prices Shenzhen’s 2017 GDP by different I&T sectors
(USD bn, 2017–2020 est.) (RMB bn)
700 2017 2018 2019 2020
600
500
400
300
200
100
0
Source: CEIC, Oxford Economics Source: Colliers International
11COLLIERS RADAR OFFICE (TECHNOLOGY SECTOR) | ASIA | 19 SEPTEMBER 2018
According to the World Intellectual Property Organization (WIPO), a relatively low score under talent, reflecting the paucity of famous
Shenzhen-Hong Kong ranked as the second most innovative region globally universities in Shenzhen as recognised in international surveys. However, in
in 2017, behind Tokyo-Yokohama, with a total of 41,218 international patent this case, we believe that external sources probably do not do justice to the
filings. Domestically, Shenzhen was ranked as the most innovative city in broad spread of practical technological expertise in Shenzhen.
China by Forbes in 2017. Besides Huawei and ZTE, leading Chinese
Shenzhen does not score very highly on human factors either, at least in
technology companies based in Shenzhen today include Tencent, Xiaomi,
comparison to the rest of Asia rather than the other large Chinese cities.
and DJI.
However, Shenzhen excels on property factors, coming second overall in this
Shenzhen faces heavy new supply factor group after Bangalore. This position reflects moderate employer costs
and the city’s very strong ranking on considerations such as availability of
The Shenzhen office market faces very heavy new office supply in coming office stock and flexible workspace, and planned new supply.
years. Over the three years from 2018 to 2020, we predict total new supply
of 5.8 million sq metres (62.4 million sq ft), a figure which exceeds Grade A
office stock at end-2017 of 5.1 million sq metres (55.4 million sq ft). Looking
forward from the end of H1 2018, we expect the total new supply in core
areas to reach over 6.0 million sq metres (65.0 million sq ft).
About half of the new supply is scheduled to be in the Qianhai district (see
table overleaf). Shenzhen’s office vacancy rate stood at 13.6% at end-H1
2018. We expect vacancy to rise to a peak of nearly 30% by end-2019 due to
heavy new supply in Qianhai, but to fall back to around 14% by end-2022.
But strong demand can absorb the new stock
The heavy new supply of office stock should ensure that ample space is
available for technology companies and other tenants to occupy. However,
we are not especially concerned about a supply glut. This is because firm
economic growth continues to drive market demand. Over the next three
years, we forecast that net absorption in the Shenzhen market will exceed
1.0 million sq metres (11.1 million sq feet) annually.
We predict that city average rent will rise by 8% in 2018, followed by a
downward adjustment of 4% in 2019 due to the heavy new supply in
Qianhai. However, we expect to see positive rental growth in Futian and
Nanshan. The city average rent should pick up in 2020.
Shenzhen in our scoring
Shenzhen comes third overall in our ranking, with a score of 61%. Despite
the city’s strong-near term economic growth prospects, the city does not
score very highly under socio-economic considerations. This is mainly due to
12COLLIERS RADAR OFFICE (TECHNOLOGY SECTOR) | ASIA | 19 SEPTEMBER 2018
New supply in Shenzhen
> Qianhai: Despite the fact that Qianhai will have the largest new supply in > Luohu: As Shenzhen’s earliest developed district, Luohu is currently
Shenzhen, exceeding 2.0 million sq metres (21.5 million sq feet), a large undergoing a large scale urban renewal. For example, the Caiwuwei area
portion of the new buildings is intended for self-use, specifically as has planned three super skyscrapers with a building height of over 600
headquarters for large corporations, leaving limited new supply for metres. We expect a large amount of new supply over the next five to
leasing. As the planned future CBD of Shenzhen, we expect rents to pick ten years, which should drive the demand for quality office space by
up gradually once new infrastructure projects are completed. tenants in Luohu, as well as rental growth.
Districts of Shenzhen
Source: Colliers International
13COLLIERS RADAR OFFICE (TECHNOLOGY SECTOR) | ASIA | 19 SEPTEMBER 2018
Beijing
Beijing in our scoring We list below some recent developments in Beijing’s pursuit of growth in AI:
60.3% Beijing scores 60% in our list, and ranks fourth overall. Beijing scores highly > July 2017: China’s State Council issues the “Planning for the Development
on economic scale and growth potential, and is respected as a source of of the New Generation of AI”.
Human
9.9% talent. Staff costs are moderate even if CBD rents are the highest in China. > December 2017: Beijing’s municipal government releases the “Guideline
The city scores less well on measures of human aspiration, partly due to for Accelerating the Development of Sci-tech Renovation and Fostering
Property relatively low scores on quality of life and environmental criteria. the AI Industry“.
18.5% Nevertheless, we are optimistic about prospects for Beijing, and believe that
the city is especially well-placed to strengthen its position as a leading centre > First nine months of 2017: The value of investment in AI Beijing ranked
in the field of artificial intelligence (AI). top in China. Investment in a total of 51 AI-related projects over that
period reached RMB10.24 billion (USD1.63 billion), accounting for about
Socio- Beijing as a source of talent one-half of the aggregate level for China.
economic We note that the technology occupiers in our “Tech Trends” report of
31.9% > January 2018: Beijing’s Mentougou District announces that it will build
December 2017 considered Beijing/North China to be the single greatest the Zhongguancun Artificial Intelligence Science Park (ZAISP) in
source of talent within Asia. With several highly reputed universities Mentougou New Town within the next three to five years. Although
(especially Peking University and Tsinghua University) and a well-known ZAISP is not the first AI science park in China, the advantages of Beijing in
technology hub in Zhongguancun, there is no doubt that Beijing is a major talent, technology and enterprise should help the city lead China's AI
centre of technical and academic excellence. Based on The Times Higher industry
Education World University Rankings, we believe that Beijing ranks in first
place among mainland Chinese cities by quality of education, albeit behind > August 2018: BeTjhe total number of robot-related companies in the
Singapore, Hong Kong and Seoul. Beijing Economic Development Area reaches 153, compared to 35 three
years ago
Beijing as an AI hub
The map overleaf shows the distribution of AI enterprises in Beijing. It is easy
We expect Beijing’s importance as a technology centre to grow further, and to see that there is a significant concentration in Haidian District (海淀区).
believe that the city will continue to attract new companies and investment
capital. We consider that Beijing is especially well-placed to strengthen its
position as a leading centre in the field of artificial intelligence (AI). In terms
of enterprises and capital, according to public information, there were
almost 400 AI enterprises in Beijing by end-September 2017, the highest
level in China.
14COLLIERS RADAR OFFICE (TECHNOLOGY SECTOR) | ASIA | 19 SEPTEMBER 2018
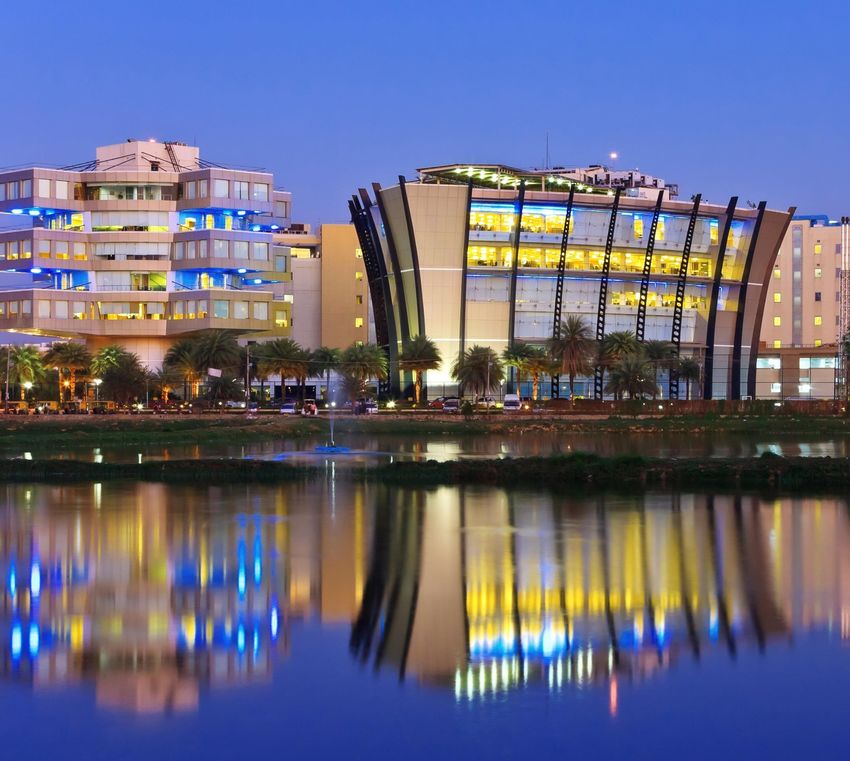
Areas of AI concentration in Beijing
Source: Colliers International Research, North China
AI concentration in Beijing
Currently, the sub-districts with a particular concentration of AI companies are the Z-Park I-M-Way in Haidian District and Yichuang Robot Creative Park in the
Beijing Economic and Technological Development Zone (BDA). There is also an AI National co-working space in the Peking University Science Park.
> Z-Park I-M-Way was set-up by Haidian District in 2016, with the aim of establishing a new type of innovative start-up street with the theme of intelligence
manufacturing. The street starts from the east gate of Tsinghua University in the north and ends at the Chengfu Road in the south. The total length is 380
metres which includes the universities and institutions such as Tsinghua University, Peking University, Beihang University and Chinese Academy of Sciences.
46 enterprises are concentrated in the street with a total added value of more than RMB100 billion (USD15.9 billion).
> Yichuang Robot Creative Park in BDA was set up in 2015; it was renovated from an original factory with a total GFA of around 87,000 sq metres (936,460 sq
feet). The park is positioned as the R&D centre of Beijing's robot industry. As of now, we understand that over 30 enterprises have entered the park with a
total commitment rate of about 80%.
15COLLIERS RADAR OFFICE (TECHNOLOGY SECTOR) | ASIA | 19 SEPTEMBER 2018
Hyderabad Various technology and consulting companies such as JP Morgan Chase,
PwC,Shure and S&P Infotech made pre-commitments to space for expansion
Hyderabad in our scoring in projects under construction in the SBD such as Salarpuria Sattva
Knowledge City and RMZ Skyview Office Park.
59.3% Hyderabad comes seventh in our ranking with a score of 59%. We believe
that the city has the potential to rise up the ranking in coming years. Like all In Q2 2018, office demand remained concentrated in the SBD micromarket.
Human Indian cities, Hyderabad scores highly on long-run growth potential, Due to the expansion of technology companies such as Amazon, Conduent,
13.1% although it scores less well on other socio-economic factors and does not yet UST Global and Core compete, the technology sector accounted for 62% of
match Bangalore as a source of talent. Office stock currently stands at only gross absorption. This was followed by flexible workspace operators,
Property 40% of the level of Bangalore, but development is proceeding apace, with accounting for 31% of gross absorption. In our opinion, increasing pre-
19.2% total stock set to increase by 60% by 2021 by our estimate. The fact that commitments by technology occupiers and the continuing rise of flexible
technological development is focused in one district, HITEC City, makes workspaces should be the key trends driving the market in H2 2018.
planning in Hyderabad relatively easy. Tax rates and cost of living are low,
and Hyderabad scores better than most other Indian cities on other human
Infrastructure development
Socio-
factors such as quality of living, air pollution, and traffic levels. Hyderabad is going through an infrastructure makeover with the
economic
27.0% government's Strategic Road Development Plan (SRDP) calling for the
Profile of Hyderabad
construction of underpasses, flyovers and cable bridges, as well as street and
Hyderabad has developed rapidly since it was originally earmarked as a water supply improvement initiatives in CBD locations. In our opinion, such
major IT centre by the Indian government. Development has accelerated initiatives are likely to reduce the overburden on the available infrastructure
since political agreement was reached in 2014 on the division of the old further in SBD, CBD and Off CBD micromarkets.
province of Andhra Pradesh into new Andhra Pradesh and Telengana:
The state government is in progress in setting up one of the world's biggest
Hyderabad will serve as capital city of both provinces for no more than ten
'Pharma City' clusters over an area of 19,000 acres (76.8 million sq metres)
years.
in Mucherla. Recently, the Swiss firm Ferring Pharmaceuticals has also
By Colliers' estimate, as of end-H1 2018, Bangalore has 141 million square announced investments of about INR1,700 crores (USD250 million) in
feet (13.1 million square metres) of office space. With just over 56 million Genome Valley, Hyderabad. We expect the aforementioned investments in
square feet (5.2 million square metres) of office space, Hyderabad is only the pharmaceuticals sector to provide further support to office demand.
about 40% of Bangalore's size. However, development is proceeding apace,
with total stock set to increase by 33 million sq ft or 60% by 2021 by our
estimate. Whereas Bangalore is divided into many micromarkets, technology
development in Hyderabad is concentrated in one district, HITEC City.
With about 1.0 million sq feet (0.09 million sq metres) of office leasing in Q2
2018, Hyderabad recorded 1.5 million sq feet (0.1 million sq metres) of gross
absorption in H1 2018, representing a 38% dip from H1 2017. In our opinion,
the considerable dip in office leasing is primarily view to the limited
availability of Grade A office supply in the Secondary Business District (SBD),
the city's favourite market, where the vacancy rate is as low as 3.0%.
Nonetheless, about 1.1 million sq feet (84,000 sq metres) of space was pre-
committed in Q2 2018, indicating healthy demand for Grade A office space.
16COLLIERS RADAR OFFICE (TECHNOLOGY SECTOR) | ASIA | 19 SEPTEMBER 2018
Comparison – Bengaluru vs Hyderabad Rental Trend in INR/sf/month (Hyderabad vs Bengaluru)
Parameter Bengaluru Hyderabad (INR/sf/month) Hyderabad Bengaluru
88
85
Total stock 141.3 msf 56.4 msf 82
77 79
75
Gross absorption 47% rental
28.1 msf 11.0 msf difference
(Cumulative 2016–17)
62 44% rental
% share of absorption by IT-ITeS occupiers difference
59% 81%
(Cumulative 2016–17)
45 46 47
43 43 43 44
Upcoming supply (2018–2021) 23.0 msf 33.0 msf
Overall vacancy rate (Q2 2018) 10% 6% Q4 2016 Q4 2017 Q2 2018 Q4 2018 Q4 2019F Q4 2020F Q4 2021F
Note: 1) This table is intentionally repeated from the table on page 7 above. 2) Only Grade A office spaces are Source: Colliers International India Research
considered; IT-ITeS – Information Technology and Information Technology enabled Services; msf – million
square feet. Source: Colliers International India Research
Comparison – Bengaluru vs Hyderabad Rental Trend in USD/sf/month (Hyderabad vs Bengaluru)
Bengaluru supply Bengaluru demand Hyderabad supply (USD/sf/month) Hyderabad Bengaluru
Hyderabad demand Bengaluru vacancy Hyderabad vacancy
(msf) (Vacancy rate, %)
1.2
50 15% 25% 1.2
10% 1.1
1.1 1.1
40 20% 1.0
47% rental
6% 6%
difference
30 15% 0.9 44% rental
10% 9% 9% difference
20 7% 10%
0.6 0.6 0.7
0.6 0.6 0.6 0.6
10 5%
0 0%
2016 2017 2018F 2019-21F Q4 2016 Q4 2017 Q2 2018 Q4 2018 Q4 2019F Q4 2020F Q4 2021F
Source: Colliers International India Research Source: Colliers International India Research
Note: Only Grade A office spaces are considered; Note: Only Grade A office spaces are considered;
Forecasted vacancies are for Q4 2018 and Q4 2021 respectively USD = INR 71.90 (US Dollar rate as on 7th September 2018)
17COLLIERS RADAR OFFICE (TECHNOLOGY SECTOR) | ASIA | 19 SEPTEMBER 2018
Hong Kong consequence, academics in Hong Kong may now apply to the central
government as well as the SAR government for funding for research.
Hong Kong in our scoring
> Technology groups expanding in the city. Over the past couple of years,
59.1% Hong Kong is not usually considered to be a leading technology centre, and leading technology and social media groups have expanded rapidly in
based on Colliers’ property data at present it is not. As of end-H1 2018, we Hong Kong. Several examples follow:
Human estimate that technology occupiers accounted for under 6% of Grade A
12.5%
– Facebook, one of the world’s best-known social networks, which is
office space in the city. This is one of the lowest proportions in Asia.
currently leasing office space at Swire’s One Island East building in
Property However, Hong Kong achieves a respectable score of 59.1 in our ranking, Quarry Bay, will expand in the One Taikoo Place building and take up
14.2% and comes in eighth place overall. Hong Kong comes in third place in terms about 110,000 sq feet (10,220 sq metres) of space in 2018¹
of socio-economic factors after Singapore and Bangalore, due principally to
– Alibaba, the huge Chinese e-commerce enterprise, had occupied
high scores on employment considerations (specifically, political stability,
27,000 sq feet (2,510 sq metres) at Times Square in Causeway Bay
ease of doing business, corporate tax rate and city infrastructure) and on
Socio- since 2011. In 2017, it expanded by leasing an additional 91,000 sq
economic availability of talent (reflecting high rankings for Hong Kong’s universities).
feet (8,455 sq metres) at Times Square Tower 1 in Causeway Bay².
32.4% In terms of property factors, Hong Kong scores poorly. Employer costs are The South China Morning Post (SCMP), which Alibaba acquired in
high, reflecting high average disposable income per head (and therefore 2015 is also located in this building
elevated average wages) and the world’s highest rents for CBD office space.
– BitMEX, a fintech company and trading platform for cryptocurrencies,
Low scores on these measures outweigh better scores on various metrics in
has recently rented the entire 45th floor of the Cheung Kong Center
in the sub-category of office accommodation, e.g. availability of flexible
in Central, an area of 20,000 sq feet (1,860 sq metres), for HKD225
workspace and Hong Kong’s position on the innovation city index included in
(USD28.8) per sq foot per month³, making this floor the most
our criteria.
expensive office in Hong Kong
In terms of human factors, Hong Kong scores 12.5% out of a maximum of
> Fintech gathering pace. According to KPMG’s report “The Pulse of Fintech
13.4%. However, several cities rank just above it including most other large
2018” (31 July 2018), Asia’s fintech investment surged from USD5.4
developed cities (Singapore, Seoul, Taipei and Tokyo all score well on
billion in 2017 to USD16.8 billion in H1 2018 (although this figure was
aspirational measures) and emerging cities such as Hyderabad and
swollen by around USD14 billion of fund raising by the Chinese online
Bangalore (in their case due to low living costs).
payments group Ant Financial). In Hong Kong, in addition to an increasing
Could Hong Kong surprise as a technology centre? number of fintech companies which can afford office rents in the CBD
and fringe CBDs, international banks are hiring more technology-based
We are not yet prepared to recommend Hong Kong as a top location for talent, which should increase office demand across all submarkets. Many
technology occupiers. However, we see several reasons why Hong Kong’s large banks that already have offices in the CBD are considering
position as a technology centre has the potential to improve sharply: decentralised locations for their innovation and technology divisions,
> Proximity to South China. Hong Kong is a Special Administrative Region while others are using flexible workspace; notably, HSBC established its
(SAR) of China, and lies just across the border from Shenzhen, which is innovative technology teams in WeWork centres in 2016.
China’s technology capital. Greater integration of the cities in the Greater Recently, it has been reported that, as part of its global technology
Bay Area may well drive growth in technology in Hong Kong too. In this budget of USD10.8 billion for 2018, JP Morgan plans to expand its Hong
context, it is worth adding that the central government of China has Kong-based tech workforce by 20% to prepare for the launch of its new
recently targeted Hong Kong as an international innovation centre. In Chinese securities venture. The bank has pre-leased about 225,000 sq
18COLLIERS RADAR OFFICE (TECHNOLOGY SECTOR) | ASIA | 19 SEPTEMBER 2018
feet (20,905 sq metres) of office space at The Quayside in Kowloon Bay, a
building scheduled for completion in 2019. As part of the move, JP
Morgan plans to hire “top-tier tech talent” from Hong Kong and China
with skills in digital, AI, mobile, big data and machine learning.4
➢ HKSTP nurturing new talent. The Hong Kong Science & Technology Park
(HKTSP) is a government-promoted project to build on Hong Kong’s
perceived strengths in five technology clusters (biomedical technology,
electronics, green technology, information and communication, and
material and precision engineering), and to facilitate the translation of
R&D achievements into practical solutions for three major application
platforms, namely Smart City, healthy ageing and robotics. The HKTSP
has its principal site at the Science Park in Shatin, New Territories, which
focuses on R&D; in addition, it manages the Innocentre in Kowloon Tong,
which focuses on brand design and marketing.
The HKTSP claims to be fostering over 680 technology companies at
present, to provide around 3.5 million sq feet (325,280 sq metres) of
laboratory and office space, and to have raised HKD1.2 billion (USD155
million) in direct investment in fiscal year 2017/18. The HKTSP is
complementing the earlier-established (and smaller) Cyberport as a hub
for nurturing new technology businesses. The HKTSP’s role may be
further enhanced if the planned Hong Kong/Shenzhen Innovation Park at
Lok Ma Chau goes ahead.
¹ Source: Swire Properties (see https://www.taikooplace.com/en/media/2018/180201-one-taikoo-place-tops-
out-with-over-half-of-office-space-pre-leased.aspx, 1 Feb 2018); Colliers International
² Source: Wharf Holdings (see http://www.wharfholdings.com/download_eng/ar2011/09%20Times%20S
quare%20E.pdf); Colliers International
³ Source: SCMP (see https://www.scmp.com/business/article/2160878/us600000-monthly-office-rent-breeze-
digital-currency-exchange, 22 Aug 2018); Colliers International
4Source: SCMP (see https://www.scmp.com/business/companies/article/2151333/jp-morgan-expand-hong-
kong-based-tech-hires-support-landmark), 19 June 2018; other reports
19COLLIERS RADAR OFFICE (TECHNOLOGY SECTOR) | ASIA | 19 SEPTEMBER 2018
Talent
RECAPITULATION –
Acquisition of talent is the greatest challenge faced by Asian technology
“TECH TRENDS IN ASIA” companies, ranking far ahead of other constraints. The occupiers in our
study had particular respect for Beijing/North China as a source of talent,
Over H2 2017 Colliers' Occupier Services and Research teams held detailed together with Shanghai/East China and India (notably Bangalore). Talent is
interviews with the Asian operations of twelve large technology companies getting younger, with millennials the top or joint top employee age group for
domiciled in the US, Europe and Asia. These companies spanned the gamut two-thirds of the companies.
of technology sub-sectors from hardware manufacturing through software
and services to social media. Our interviews covered present and future real Chindia
estate strategy, but paid particular attention to the question of how the As markets, China and India offer the highest growth potential over ten
need to acquire and retain talent shapes real estate location decisions. years. Moreover, it is vital for technology groups to have exposure to China
We presented our conclusions in our “Tech Trends in Asia” report, and to understand the developments in a dynamic market leading Asia in
believe that they are still largely valid. In our view, four terms describe an e-commerce, mobile internet and AI. Within China, Shanghai and Beijing (or,
appropriate real estate strategy for technology occupiers in Asia: talent, on a medium-term view, Chengdu) offer alternatives as locations for
Chindia, CBD, artificial intelligence (AI). We summarise these points at right. technology companies to currently dominant South China. In India,
Hyderabad is emerging as a strong alternative to Bangalore with lower rents.
CBD
Technology groups need to move towards the CBD or CBD fringe to find and
retain talent in R&D and sales & marketing. Business parks on city edges are
an option for smaller or start-up groups. Different economic criteria apply to
manufacturing units, for which location outside cities makes sense.
However, technology occupiers attempting to concentrate all their
operations in out-of-town campus sites look unlikely to attract all the high-
skilled staff needed for the key roles of the future.
Artificial intelligence
Technology companies should harness AI to drive growth and boost returns.
The convergence of AI, the Internet of Things and alternative workplace
solutions (with agile working the best design for many technology groups)
looks set to transform the office, making it more collaborative, greener and
healthier. This will help in acquiring and retaining human talent.
20COLLIERS RADAR OFFICE (TECHNOLOGY SECTOR) | ASIA | 19 SEPTEMBER 2018
Transport sector (as a proxy for Technology), the Financial and Business
SCORING METHODOLOGY Services, and the Consumer Services and Public Services sectors. Finally, we
have examined the productivity of staff in those sectors.
Our “Top Locations in Asia” research examines the attributes of cities under
three headings: socio-economic factors, property factors and human factors. Oxford Economics is our principal source of data for the various criteria
These three factor groups are broken down into seven sub-categories included within the three sub-categories above. Where necessary, we have
(economic output, employment considerations, workforce orientation, used other respected public sources such as the World Bank.
availability of talent, employer office costs, office accommodation and Availability of talent
employee aspirational metrics), which in turn include nearly 50 measures
relevant to choice of location. We assign a score on each measure and Availability of talent refers principally to the quality of higher educational
combine them to a total score out of 100. We rank the cities on this basis. facilities in the city. We have examined the ranking of top universities, the
degree to which higher educational facilities may be considered to have an
A brief explanation of the key factors is provided below. international outlook, and the quality of research institutions.
Socio-economic factors Our principal source of data on availability of talent is the Times Higher
Education World University Rankings.
Economic output
Economic output describes the aggregated gross value added (GVA) Property factors
produced in each city. This is a similar concept to gross domestic product Employer costs
(GDP). We have emphasised the estimated long-term growth rate of GVA for
each city, the percentage of GVA in services, and the importance of each city This sub-category refers to the overall costs for an occupier of operating a
to the national or regional economy. Cities in countries with high long-term business in the city. The most important of these costs are average wages
growth rates, with a sizable services sector, and whose economies are per employee (for which we have used disposable income per capita as a
important on a national scale, will score highly. proxy) and average prime office rent in the CBD. The higher the employer
costs, the lower the city’s score.
Employment considerations
Office accommodation
This sub-category includes a number of considerations other than pure
economic potential relevant to the decision to do business in a city. These This heading covers various measures of the quality and availability of office
include the political stability of the country, operating conditions for stock in a city. These include current Grade A office stock and office vacancy,
enterprises (e.g. general ease of doing business and corporate tax rate), and and planned supply over the next three years. We also examine availability
the quality of city infrastructure. We have also included English language of flexible workspace and the gap in rents between the CBD and cheaper
proficiency, which is important in the technology sector. districts. Finally, we examine certain less tangible measures of the quality of
the workplace such as wellness and sustainability.
Workforce orientation
For most of the criteria included under employer office costs and office
This sub-category refers to the demographic profile of the country, and accommodation, we have assigned a score based on Colliers’ own research,
the composition of the workforce in the leading cities. We have examined backed up where necessary by external sources.
the proportion of the population aged under 30 as a measure of supply of
staff over the long run. In addition, we have examined the proportion of
each city’s workforce represented by the Communications and
21COLLIERS RADAR OFFICE (TECHNOLOGY SECTOR) | ASIA | 19 SEPTEMBER 2018
Human factors Weightings of three factor groups and seven sub-categories in “Top
Locations in Asia (Technology)” research
Employee aspirational metrics
This sub-category covers several measures of importance to occupiers’ staff, Factors Weighting
most importantly personal tax rate and cost of living and but also measures
of the quality of living such as a safety index and pollution levels. Cities with
1.0 Socio-economic Factors 50%
a low cost of living where people feel safe and are not worried about their
health will score highly.
We have used various well-known public sources including KPMG, Mercer 1.1 Economic Output 15%
and the World Health Organisation for data inputs relevant to employee
aspirational factors. 1.2 Employment Considerations 13%
Weightings
1.3 Workforce Orientation 12%
Naturally, a key factor governing the scores achieved by the 16 cities in our
study is the weightings that we assign to the three principal factor groups,
and within those groups to the various sub-categories. For the technology 1.4 Availability of Talent 10%
sector, we have selected the following weightings:
> Socio-economic factors, 50% 2.0 Property Factors 30%
> Property factors, 30%
2.1 Employer Costs 15%
> Human factors, 20%
Our choice of weightings will inevitably be open to question. However, as
2.2 Office Accommodation 15%
noted earlier our “Tech Trends in Asia” work suggested that technology
groups regard acquisition of talent as their chief challenge, and that they are
attracted by high-growth markets. Accordingly, under socio-economic 3.0 Human Factors 20%
factors, we have assigned a 15% weighting to the sub-category of economic
output (which in turn is dominated by long-run GVA growth rates, especially
3.1 Employee Aspirational 20%
in services), and a 10% weighting to availability of talent as narrowly defined
by scores on university rankings. If availability of talent is defined more
broadly to include the various measures that we assess under the sub- Total 100%
category of workforce orientation, then it has a total weighting of 22%.
Source: Colliers International
22COLLIERS RADAR OFFICE (TECHNOLOGY SECTOR) | ASIA | 19 SEPTEMBER 2018
Overall score: Overall score: three cities on 61% or higher
SUMMARY OF
70%
Over 60% 50–60% OVERALL SCORES
Three cities achieve a combined score of 61% or
higher in our ranking: Bangalore on 68%,
65% Singapore on 63% and Shenzhen on 61%. These
cities are the clear winners, and in our view they
rank as the top locations for technology sector
60% occupiers in Asia.
As the chart at left makes clear, it would be
wrong to ascribe excessive importance to the
55% rankings of the 16 cities in our study. Thirteen
cities score between 60% and 50%, and none
scores below 50%.
50%
Despite good scores on human aspirational
factors, dull long-run growth prospects and a
poor demographic profile hold developed cities
45% like Tokyo and Taipei. However, Seoul scores
more highly due to modest employer costs and
good university and research rankings.
40%
In general, Indian cities and South East Asian
emerging cities like Jakarta benefit from high
economic growth and low employment and living
35% costs, but achieve poor scores on employment
considerations and human aspirational metrics.
Hyderabad scores better than most other
30% emerging cities on human factors such as quality
Delhi NCR
Beijing
Seoul
Manila
Mumbai
Jakarta
Hong Kong
Bangalore
Shanghai
Hyderabad
Guangzhou
Chengdu
Singapore
Shenzhen
Taipei
of living, air pollution, and traffic levels.
Tokyo
Source: Colliers International, based on data inputs from numerous sources
23COLLIERS RADAR OFFICE (TECHNOLOGY SECTOR) | ASIA | 19 SEPTEMBER 2018
Socio-economic factors
SCORING AND RANKING
The scores range between 26.2% and 35.6%, out of a maximum possible
For each city, we determine a percentage score on each of the nearly 50 score of 50.0%. Bangalore’s no.2 position, with a score of 33.1%, principally
separate measures that we examine in this report. We calculate percentage reflects the fact that it ranks at the top of Oxford Economics’ forecasts of
with reference to (a) either an absolute value such as GVA in the services average annual real GDP growth among Asian cities over the next five years,
sector or total office stock, or the position that the city occupies between on 9.6%; this in turn feeds through into the highest estimated GVA growth in
lowest and highest value on each measure, and (b) the weighting that we the services sector. Out of the seven fastest-growing big Asian cities over the
assign to that measure. We then add up the percentages to calculate a total period 2018–2022, Oxford Economics believes that six will be in India, with
percentage score for each city. Ho Chi Minh City the only exception. However, Bangalore is the clear leader
In addition, we calculate each city’s rank out of 16 for each of the three among the Indian cities, with Hyderabad some way behind with estimated
factor groups, i.e. socio-economic, property and human factors, together of average annual real GDP growth of 8.1%. In contrast to the Indian cities,
course with each city’s overall ranking out of 16. Oxford Economics notes that growth in the Tier 1 Chinese cities has clearly
started to slow.*
We summarise the scoring and ranking below.
Estimated real GDP growth 2018–2022 (%)
10.0
9.0
8.0
7.0
6.0
5.0
4.0
3.0
2.0
1.0
0.0
Source: Oxford Economics, March 2018
*See “Asia Pacific Cities & Regions Outlook” by Oxford Economics (May 2018)
24COLLIERS RADAR OFFICE (TECHNOLOGY SECTOR) | ASIA | 19 SEPTEMBER 2018
Singapore just beats Bangalore to rank first in terms of socio-economic Score and rank on socio-economic factors
factors in our ranking, with a score of 35.6%. The city only ranks in the
middle by long-run growth prospects or other criteria in the sub-category of Economic Employer Grand
Metrics Workforce Talent Ranking
economic output. Singapore’s top score on socio-economic factors therefore Output Factors Total
principally reflects the country’s strong reputation as a source of talent; it
Singapore 5.6% 13.0% 7.0% 10.0% 35.6% 1
ranks highest in Asia in the Times Higher Education World University
Rankings assessment of universities, research and teaching capabilities. Bangalore 10.6% 6.9% 9.9% 5.8% 33.1% 2
At the other end of the scale, the large developed cities of Taipei and Tokyo
Hong Kong 5.0% 12.6% 6.4% 8.5% 32.4% 3
achieve relatively low scores of 27–28%. These scores partly reflect limited
long-run growth prospects and unfavourable demographic profiles, Beijing 7.8% 9.4% 8.3% 6.3% 31.9% 4
notwithstanding current high economic scale; they also reflect relatively high
employer costs. Such concerns apply in particular to Tokyo, which has the Seoul 5.8% 11.3% 6.8% 6.7% 30.6% 5
lowest proportion of the population ages under 30 (27%) and the highest
average income per employee, reflecting high overall labour costs. Seoul Shanghai 8.0% 9.2% 8.1% 5.2% 30.5% 6
scores more highly due to modest employer costs and good university and
research rankings. Manila 10.2% 7.5% 9.3% 2.9% 29.9% 7
Mumbai 9.1% 6.9% 9.0% 4.8% 29.9% 8
Guangzhou 8.1% 9.3% 8.1% 3.7% 29.3% 9
Shenzhen 7.6% 9.4% 8.2% 4.0% 29.2% 10
Delhi NCR 9.2% 7.2% 8.8% 3.1% 28.3% 11
Jakarta 8.9% 8.1% 8.1% 3.1% 28.2% 12
Tokyo 5.4% 10.6% 6.6% 5.0% 27.7% 13
Taipei 4.5% 11.6% 6.7% 4.6% 27.4% 14
Hyderabad 9.2% 7.0% 8.2% 2.5% 27.0% 15
Chengdu 7.5% 8.7% 7.4% 2.6% 26.2% 16
Measure 15.0% 13.0% 12.0% 10.0% 50.0% –
Max 10.6% 13.0% 9.9% 10.0% 35.6% –
Min 4.5% 6.9% 6.4% 2.5% 26.2% –
Source: Colliers International, based on underlying data from numerous sources
25You can also read