Loreto's Hidden Wealth: Economic Complexity Analysis and Productive Diversification Opportunities
←
→
Page content transcription
If your browser does not render page correctly, please read the page content below
Loreto’s Hidden Wealth: Economic
 Complexity Analysis and Productive
 Diversification Opportunities

 Ricardo Hausmann, Miguel Ángel Santos, Jorge Tudela Pye, Yang Li and Ana
 Grisanti

 CID Faculty Working Paper No. 386
 March 2021

©Copyright 2021 Hausmann, Ricardo; Santos, Miguel Angel; Tudela, Jorge; Grisanti, Ana; and
 the President and Fellows of Harvard College

 1
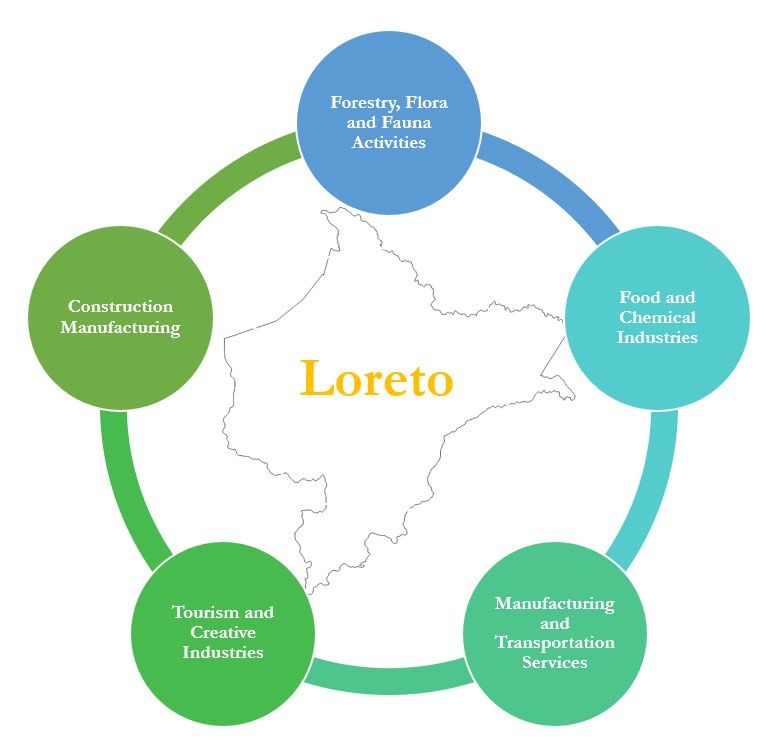
TABLE OF CONTENTS

INTRODUCTION 4
I. LORETO’S ECONOMIC COMPLEXITY 6
II. TECHNOLOGICAL PROXIMITY METRICS AND LORETO’S LOCATION ON THE
INDUSTRY SPACE 15
 a. Co-location of firms and industries 15
 b. Co-production at the establishment level 16
III. DIVERSIFICATION OPPORTUNITIES AND PRORITIZATION OF SECTORS 20
IV. CONCLUSIONS AND POLICY RECOMMENDATIONS 27
BIBLIOGRAPHY 28
APPENDIX 29
KEY CONCEPTS 32

 2

TABLE OF FIGURES
Figure 1. Average ubiquity and diversity of industries, Loreto and peers 9
Figure 2: Economic Complexity Index (ECI), Loreto and peer states 10
Figure 3: Economic Complexity Index (ECI) by industry category, Loreto and peer states 11
Figure 4: Percentage of ECI by industry category, Loreto 12
Figure 5: Economic Complexity Index (ECI) and per capita Gross Value Added (GVA), Loreto and
Peruvian peer states 13
Figure 6: Industry Space 17
Figure 7: Industry Space, selected states 18
Figure 8: Complexity Outlook Index, Loreto and peer states 19
Figure 9: Industry distance and complexity (extensive margin) 22
Figure 10: Process for Identifying Sectors 24
Figure 11: Thematic areas 25
Figure 12: Thematic areas and industries* 26

 3
INTRODUCTION
Loreto is a place of contrasts. Located on the western flank of the Amazon jungle, it is by far Peru’s
largest state in terms of size, but also among those with the lowest population density. Its capital, the
city of Iquitos, sits on the western bank of the Amazon River, surrounded by tributaries Nanay and
Itaya. It is closer to the Brazilian and Colombian borders than it is to the capitals of its nearest Peruvian
neighbor states, San Martín and Ucayali. Iquitos can only be accessed by plane or riverboat, making it
one of the largest cities in the world to lack road access. Despite boasting an important endowment
of natural resources which has attracted many visitors and adventurers over the years, Loreto remains
one of Peru’s poorest states, and has some of the worst social, health and child malnutrition indicators
in the country.
Since its founding, Loreto’s economy has been based on the commercial exploitation of natural
resources – from the late-19th and early-20th century rubber boom, up until the present-day extraction
of oil and timber. This reliance has translated into a pattern of slow and volatile economic growth for
the state, a trend that is becoming increasingly dissimilar from the rest of the country’s economy.
From 2008 to 2018, Loreto grew at a rate five times slower than Peru as a whole. During the past
decade, the per capita Gross Value-Added gap between the state and the rest of the country widened,
from 31% to 46%.
Nevertheless, along with the natural resource extraction industry, other economic activities have
developed in Loreto and have generated a more complex ecosystem than one would have initially
expected. An analysis of these activities reveals information about the set of productive capacities that
currently exist in the region and could provide a pathway towards the creation of other activities of
higher value added. Ultimately, this may contribute to raising Loreto’s productivity, increasing wages,
and improving its population’s overall living conditions.
The Growth Lab at Harvard University, with funding provided by the Gordon and Betty Moore
Foundation, has undertaken this investigation with the aim of identifying the existing productive
capacities in Loreto, as well as the economic activities with potential to drive the structural
transformation of its economy. This paper is part of a broader investigation – Promoting Sustainable
Economic Growth and Structural Transformation in the Amazon Region of Loreto, Peru – which seeks to
contribute with context-specific inputs for the development of national and sub-national public
policies that promote productive development and prosperity in this Peruvian state.
In addition to its exceptional biodiversity, the Peruvian Amazon provides important ecosystemic
services to Loreto, to Peru, and the rest of the world. The inputs that we take into account throughout
this research engagement must therefore generate policy recommendations that are consistent with
the need to preserve the region’s environmental equilibrium. In fact, our research seeks to help
overcome the tradeoff between environmental sustainability and economic development that is so
prevalent in present-day discussions.

 4
Within this context, this first report has three main objectives. Firstly, to identify and assess the
agglomeration of know-how that is currently present in Loreto’s existing economic activities.
Secondly, to define technological proximity metrics based on available data in order to identify the
economic activities that generate the most value added, and which require similar productive capacities
to those that are already present in the region. Finally, this paper seeks to identify those economic
activities that are relatively “adjacent” to Loreto’s stock of productive know-how, and which therefore
have high potential to lead the productive transformation of its economy.
Although this report does not directly take into account the environmental impact associated with the
industrial sectors that are identified, this does not mean that these issues have been altogether ignored.
Environmental considerations, along with other aspects, such as the viability and attractiveness of
economic activities within Loreto’s particular context, are of crucial importance in the design of
productive development policies. These additional dimensions have therefore been included in our
Policy Recommendations report.
This paper is divided into four sections. Section I describes the Economic Complexity methodology
– including its assumptions and limitations in the case of Loreto – as well as the necessary adjustments
that were made to adapt the approach to the sub-national context and to accommodate for the
availability of data. The resulting profile of Loreto’s productive structure according to its various levels
of sophistication will allow for a comparison of its economic complexity and potential with those of
other states within Peru, as well as with economic peers in neighboring Colombia and Brazil. Section
II defines the metrics for measuring the degree of technological proximity between industrial sectors
and situates Loreto within the Industry Space. This network visualization is used for pinpointing
Loreto’s productive capabilities relative to other economic activities and sectors that are adjacent to
the state’s stock of know-how. Section III describes the process for identifying high-potential
economic activities and industrial sectors in Loreto, and groups these into thematic areas. Finally,
Section IV summarizes the results of our complexity and selection exercises and defines the next steps
of this project.

 5
I. LORETO’S ECONOMIC COMPLEXITY
The theory of Economic Complexity, introduced by Hausmann, Hidalgo et al. (2011), is based on the
premise that the production of goods and services in a particular place not only requires raw materials,
labor and machinery, but also tacit knowledge of how to combine these elements within a productive
unit. This type of know-how tends to be one of the main limiting factors to structural transformation
and productive diversification for economies throughout the world. It has also proven more difficult
to transfer and teach, since it can only be acquired through practical experience. It is generated through
the collective combination of different skills, and resides not in books or instruction manuals, but
within the minds of the persons that live in a place.

The way in which the different types of know-how interact is similar to putting words together in a
game of Scrabble. While longer and more sophisticated words (goods and services) require many
different letters (types of know-how), shorter and simpler words will need only a few and commonly
used letters. The players that have more letters, and in a wider variety, have a better chance of
combining them into words, and therefore, of scoring more points in the game. Across economies,
the quantity and quality of the different stocks of know-how (letters) varies from place to place.
Locations that have many “letters” (capacities) are able make to longer and more complicated words
(goods and services) that, on average, few other places can make. Likewise, those places that have few
letters are only able to make short words that, on average, many other places can also make. The
number of words that a place can assemble increases exponentially as more letters are added to the
game. 1
Ultimately, the goods and services that a place can make depends on the accumulation of productive
know-how that is present among individuals and organizations in that location. And while this stock
of productive capacity cannot be observed, its size and diversity can be inferred from the set of goods
and services that a place is able to produce. To do this, we employ two quantitative metrics that are
derived by following productive patterns over time and in different places. The first is the Product
Complexity Index (PCI), which measures the amount of capacities and know-how that are required
to make a good or render a service – in other words, how complex or sophisticated a specific good or
service is. The second metric is the Economic Complexity Index (ECI), which measures the
agglomeration of productive know-how in a particular place.
Because ECI is calculated by averaging the PCIs of goods and services that are present in a place, we
must first determine if those goods and services are, in fact, present in the specific location. In order
to calculate the presence of goods and services in a binary way, Hausmann and Hidalgo (2009) used

1
 Consider the following Scrabble metaphor: If you only have the letter “a,” a single, one-letter word can be formed (“a”);
 if you have three letters, “a,” “c,” “t,” up to four, three-letter words can be formed (“a,” “at,” “cat,” and “act”); with
 four letters, “a,” “c,” “t,” and “r,” you can make up nine words of up to four letters each (“a,” “at,” “cat,” “act,” “rat,”
 “car,” “art,” “tar,” and “cart”); and with 10 letters, “a,” “c,” “t,” “r,” “o,” “l,” “g,” “s”, “n,” and “i,”, 595 different words
 of up to 10 letters can be formed.
 6
Balassa’s (1964) Revealed Comparative Advantage (RCA) metric, arguing that a particular place can
competitively produce a good (or render a service) if the share of that good within the place’s export
basket is greater than the share of that same good within the worldwide export basket. 2
For the purposes of this study, we modified the calculation of the RCA metric to adjust for data
availability at the sub-national level in Peru. We define a good or service as “present” if there is at least
one firm operating in the place that matches the product’s corresponding NAICS industrial code in
the Dun & Bradstreet (2019 3) database. In other words, we can consider that a sub-national unit – in
this case, a state – is able to produce a good or render a service as long as that state has at least one
firm registered under the industrial code that identifies that good and service.
This definition of “presence” has several advantages within the context of this investigation. Firstly,
it allows for comparisons of the diversity and ubiquity of productive capacities across states within the
same country. Secondly, it makes it possible to detect productive capacities within the service sector,
a feature that was not part of Hausmann and Hidalgo’s (2009) original work, due to the previous
unavailability of standardized service export statistics at the world level. Finally, the adjusted RCA
metric is useful in that it allows for the comparison of diversity and ubiquity of know-how
agglomeration in Loreto with that of other Amazon states in neighboring countries.
However, this simplification of the RCA metric is not without its tradeoffs. In a country where over
94% of firms are classified as “micro enterprises,” 4 and where around 72% of the Economically Active
Population is employed in the informal sector 5, to assume that a place can produce a particular a good
or service just because there is one registered company in that category could lead to an overestimation
of the agglomeration of productive know-how present there. Given this risk, we performed similar
calculations for formal and informal activities with data from the Peruvian National Household Survey
(ENAHO 6), using Balassa’s formula (which calculates RCA based on industry employment figures)
and following the methodology set out by Hausmann, Pietrobelli, and Santos (2020), in order to
validate our estimations. Since the results for both methods of calculating RCA do not differ

2
 For a detailed description of the formulas and methodology used in this paper, please refer to the Appendix.
3
 Dun & Bradstreet is a worldwide database of firms that is georeferenced at the national and sub-national level by NAICS
6-digit codes, and includes estimated information on the number of employees each firm hires and its corporate family
relationships (headquarters, branches, subsidiaries, etc.). The database is compiled by Dun & Bradstreet, a company where
registered firms are assigned unique D-U-N-S number, so that they may be identified and gain visibility and global status
with clients/lenders.
4
 Businesses whose annual sales do not exceed 150 Tributary Units (UITs). Source: INEI (2017).
5
 According to INEI (2019a), a worker is considered “informal” if they are the following: “i) employers and self-employed whose
productive unit belongs to the informal sector, ii) employees without social security financed by their employer, iii) unpaid family workers, regardless
of the "formal" or informal nature of the productive unit in which they work".
6
 The National Household Survey, conducted by Peru's National Institute of Statistics and Informatics (INEI), is used
primarily to obtain social, demographic and economic statistics on the country's households since 1995, including
representative information at the sub-national level on employment by province and industry, income, and education
levels, among others. According to the INEI, the sample is probabilistic, area-based, stratified, multi-stage and independent
in each province studied. The annual sample size for 2018 includes 39,820 households: 24,308 urban and 15,512 rural.
 7
significantly, and in light of the lower statistical representativeness that ENAHO data has at the
industry-province level, we decided to use the modified metric based on Dun & Bradstreet (2019) data,
which contains 6-digit-long information in NAICS industry codes. 7
With the product or industry’s Revealed Comparative Advantage (RCA) we define two parameters:
diversity and ubiquity. While diversity is a measure of the number of industries in which there is at
least one registered firm operating in the state in question, ubiquity is calculated as the number of
states that have at least one firm belonging to those same industries. There is ample literature
documenting the existence of an inverse relation between ubiquity and diversity, both at the national
level (as measured by exports 8), and at the sub-national level, based on how intensive each industry is
(as compared across states, departments, cities, or metropolitan areas within the same country) 9.
Our initial Scrabble metaphor provides a good illustration of this inverse relation. Places in which there
is a higher agglomeration of capacities and know-how are able to produce a more diverse and more
sophisticated set of goods and services (high diversity), which, on average, very few other places can
produce (low ubiquity). In contrast, places that have a low agglomeration of know-how tend to
produce a smaller variety of goods and services (low diversity), which, on average, many other places
can also produce (high ubiquity).
Moreover, the inverse relation between diversity and ubiquity – as documented for countries by
Hausmann and Hidalgo (2009) based on RCAs in exports – is mirrored with relative precision in the
case of Peru and peer Amazon states. 10 Regions with more diversity (which have at least one firm in
a greater number of industrial codes), also tend to have a lower average ubiquity (few other regions
are able to have at least one firm in those same industrial codes), and vice versa.

7
 The methodology and results from this exercise care available from the authors upon request.
8
 See Hausmann et al (2014).
9
 For an analysis of Panama’s provinces, see Hausmann, Morales y Santos (2016), and for the case of Australian states, see
Reynolds et al (2018).
10
 In order to be able to compare Loreto's performance more comprehensively throughout this report, an international
 reference group of comparable departments was selected, and considered alongside other comparable departments
 within Peru. We used the Amazon regions of Brazil (Acre, Amazonas and Pará) and Colombia (Amazonas, Caquetá,
 Putumayo, Vaupés and Vichada) as international peers. Regions that have a relevant part of their territory that is not
 considered as Amazon forest (because it is very mountainous or desert) are not included in the list.
 8
Figure 1. Average ubiquity and diversity of industries, Loreto and peers

 Average Ubiquity and Diversity
 By Region
 35

 30
 Average Ubiquity

 25 Loreto

 Putumayo
 20

 Amazonas_Brazil
 15
 Lima
 10

 100 200 300 400 500 600 700 800 900
 Diversity

 Loreto Regions Peru
 Regions Brazil Regions Colombia
 Source: Own calculations based on Dun & Bradstreet.
 *Includes all Peruvian regions, and the Amazonian states of Colombia and Brazil.

As compared to the benchmark group in Figure 1, Loreto lies in an intermediate position in terms of
diversity and ubiquity, ranking at 15/33 and 19/33 respectively. Loreto’s diversity and average ubiquity
values fall near the median of Peruvian and Colombian reference states, and below its Brazilian peers
and the state of Lima.
Once the goods and services that are present in a place have been identified, we can calculate
complexity metrics for products/industries –the Product Complexity Index (PCI)– and for places –
the Economic Complexity Index (ECI). 11 For the former, we estimate the average diversity of the
places that produce the goods and services in question, as well as the ubiquity of the other goods and
services that said place can make/render. For the latter, we use the average ubiquity of the goods and
services basket that the location produces, and the diversity of the places that can make/render them.
It’s important to consider these complimentary metrics simultaneously, since focusing on a single one
can result in misleading conclusions in terms of a product or place’s level of economic complexity.
For example, although activities related to the natural resource extraction industry have a low ubiquity

11
 For a detailed methodology for calculating PCI and ECI, as well as for the indicators of the level of sophistication of
know-how required for manufacturing a product (PCI) and the level of sophistication of agglomeration of capacities in a
place (ECI), please refer to the Appendix.

 9
value, the fact that the diversity of places that have an RCA in natural resources is so low means that
natural resources as an industry which is not sophisticated, but actually only occurs in few places that
have a rich endowment of those resources.
For calculating the PCIs, rather than using the goods and services present in Peru and neighboring
Amazon states as a reference, we base our calculations on data from United States districts. This is
because, in addition of being the country with the most comprehensive sub-national data coverage in
the Dun & Bradstreet database 12, this approximation ensures that the sophistication metric for products
(PCI) is measured at a point that is nearer to the technological possibilities frontier. We obtain an
indicator for productive know-how agglomeration in Loreto and its peer states (ECI) by averaging the
complexity (PCI) of existing industries in each state. 13
Figure 2 shows the ECI ranking for all of Peru’s states, as well as for Loreto’s Amazon peer states in
Colombia and Brazil. As we can see, Loreto, in red, ranks 15th out of 33, a position that is consistent
with its relative diversity and ubiquity levels.
Figure 2: Economic Complexity Index (ECI), Loreto and peer states

 Economic Complexity Index
 Lima
 Amazonas_BRA
 Callao
 Pará
 Acre
 Arequipa
 Cusco
 Puno
 Apurimac
 La Libertad
 Huanuco
 Piura
 Lambayeque
 Ancash
 Loreto
 Junin
 Caquetá
 Tacna
 Ica
 San M artin
 Cajamarca
 Amazonas_COL
 Ucayali
 Vaupés
 Moquegua
 Ayacucho
 Tumbes
 Putumayo
 Amazonas_PER
 Madre De Dios
 Huancavelica
 Pasco
 Vichada

 0 .5 1 1.5 2
 Economic Complexity Index (ECI)

 Loreto Regions Peru
 Regions Colombia Regions Brazil

 Source: Ow n calculations based on Dun & Bradstreet.

12 This approach implicitly assumes that productive activities have the same sophistication in the United States as in the
 rest of the world. In this sense, throughout this paper, when estimating inputs for the development of the industry, we
 employ methodological approaches that are consistent with this assumption.
13
 See Appendix.
 10
Figure 3 plots the ECIs of our Peruvian group of states and comparable Amazon peers, ordered from
left to right according to each category (group of products/industries) PCI. Loreto, which is
highlighted in red, performs best in the Professional Services, Construction (which both rank 8/33)
and Commerce (13/33) industries. In these sub-categories, the industries operating in Loreto have a
PCI above peer state average.
Figure 3: Economic Complexity Index (ECI) by industry category, Loreto and peer states

 Economic Complexity by Industry Category
 4

 8
 19
 2
 23
 17 13
 23 8
 ECI

 0 24
 31

 -2
 21

 -4
 g

 s.

 s
 s

 .

 il)
 l

 n
 lth

 )
 Ut

 tai

 sry
 t
 ice

 rin

 io
 In

 an
 O

 ea
 Re

 ct
 rv

 re
 tu

 &

 ur
 &

 c.

 H

 tru

 Fo
 Se

 ac

 (in

 sta
 t

 &
 ce

 or

 &

 ns
 uf
 IT

 ale

 Re
 an

 c.
 sp

 ng

 c.
 an

 Co

 in
 n

 an

 les

 du
 .&

 i

 &
 M

 e(
 in
 Fi

 Tr

 ho

 ., E
 M

 els
 of

 ur
 W
Pr

 ult
 ot
 in

 H
 dm

 ric
 Ag
 A
 ic
 bl
 Pu

 Industry Category

 Loreto Peer Regions
 Source: Own calculations based on Dun & Bradstreet.

Figure 4 shows Loreto’s ECI disaggregated by category. The horizontal bars illustrate the weighted
average share that each sector has in Loreto’s complexity. The sum of these categories is the Economic
Complexity Index shown in Figure 2.
Here, we see that ~80% of Loreto’s ECI comes from its greater relative intensity in the Manufacturing
and Professional Services sectors. On the other side of the spectrum, we can see that the Mining
(which includes Oil), and especially Agriculture (which includes forestry) sectors subtract from
Loreto’s relative complexity.

 11
Figure 4: Percentage of ECI by industry category, Loreto

 Percentage of ECI by Industry Category (%)

 Manufacturing

 Prof. & IT Services

 Wholesale & Retail

 Transport & Ut.

 Finance & Ins.

 Hotels & Restaurants

 Construction

 Public Admin., Educ. & Health

 Mining (inc. Oil)

 Agriculture (inc. Foresry)

 -10 0 10 20 30 40 50
 Source: Ow n calculations based on Dun & Bradstreet.

Since the ECI is a measure of a place’s know-how agglomeration, it should come as no surprise that
this indicator has a strong positive correlation to a place’s per capita income levels. That correlation
also holds true for the complexity indexes of Peruvian peer states (Figure 5). 14 As Hausmann et al
(2011) demonstrated at the country level, the errors observed between the income-complexity
coordinates of a place and the expected value according to the regression line suggest future growth
dynamics. In places where income level is below what their level of economic complexity would
suggest, growth tends to occur more rapidly. Conversely, places that display a per-capita income level
that is above what is expected based on their complexity tend to lag on growth. Economic complexity
is therefore not only a symptom or a consequence of prosperity; it is in fact, a driver of economic
growth.

14
 This estimation does not include Loreto’s Amazon peer states, because the methodologies and the per capita income
indicators themselves at the state level differ significantly between Peru, Colombia and Brazil.
 12
Figure 5: Economic Complexity Index (ECI) and per capita Gross Value Added (GVA), Loreto and
Peruvian peer states

 Peru: ECI & GVA per capita
 Excluding NNRR
 25,000

 Lima

 20,000
 GVA per capita (S/ 2018)

 15,000

 10,000 Madre De Dios

 Ucayali
 Amazonas_PER San Martin Loreto
 5,000

 1 1.2 1.4 1.6 1.8 2
 ECI (2018)
 Source: Ow n calculations based on Dun & Bradstreet.
 *Excluding Moquegua.

In the case of Loreto, the per capita income level – as measured by state-level Gross Value Added –
is below what would be expected, given the state’s ECI, and even though it is an oil producing state
(Figure 5).
Using the economic complexity framework, we can design a roadmap for accelerating Loreto’s
economic growth and development, which could also be applied to other places that exhibit similar
lower-than expected-income given the complexity of their productive ecosystems. In order to do this,
we must first identify the existing economic activities that display a level of sophistication that are
above Loreto’s average, and that have the potential to grow rapidly. Then, we must determine which
industries that are not yet present in Loreto require similar productive capacities to the ones which
already exist in the state.
In this way, we can solve the chicken-and-egg dilemma that usually surrounds the emergence of new
industries; there are few incentives in place for investing in acquiring new capacities for an industry
that does not yet exist, but the industry will not exist until the necessary know-how is in place to
sustain it.

 13
In order to establish priorities for productive development policies, we must identify the complex
industries that are “adjacent” in terms of know-how and can sustain higher wages to those that already
exist. The process of productive diversification inevitably gives rise to dilemmas and overcoming them
requires finite government resources and efforts. For this reason, we must target the industries that
involve capacities similar to the ones already in place, or industries that are less intensive on the
capacities that are still absent.

 14
II. TECHNOLOGICAL PROXIMITY METRICS AND LORETO’S
 LOCATION ON THE INDUSTRY SPACE

So far, we have described the adjustments made to our methodology for adapting calculations to the
sub-national context and to data availability. These adjustments must also include the definition of an
indicator for technological proximity between industries. In this section, we analyze two different ways
of approximating this indicator, which are subsequently combined to rank high-potential sectors.

a. Co-location of firms and industries
The technological distance between a pair of goods, as originally defined by Hausmann and Klinger
(2006), is based on the likelihood that a country can export both of those goods at the same time. By
plotting technological proximity for a place’s many products, we can build a network called the
Product Space, which reveals the location’s productive capacities through the goods that it is able to
export with a revealed comparative advantage (RCA). Based on the distance between two products
we can predict the path to medium- and long-term productive diversification and structural
transformation at a country level (Hausmann et al, 2011).
Although technological proximity has been widely proven as an effective tool for predicting export
diversification at the country level, this indicator is not without its shortcomings for sub-national
contexts. For example, proximity does not take the services sector into consideration, which can be a
significant source of value added, and, in some cases, of exports (tourism, IT, financial services, etc.).
Proximity also tends to underestimate the know-how agglomeration at a sub-national level, since it
excludes intra-country trade. From the perspective of a sub-national economic unit, sales to other
states should count as exports, but there is no publicly available data on these transactions.
In order to leverage on the strengths and to mitigate the disadvantages of the proximity indicator, we
have adjusted the definition of proximity based on co-exporting. For the sub-national context, and
consistent with our definition of RCA, we constructed a metric that captures distance between two
industries (including services) based on the likelihood that there is at least one firm operating in that
state with the corresponding industrial codes assigned to those industries (industry co-location).
Thanks to the high degree of granularity of the Dun & Bradstreet dataset, we can calculate a proximity
indicator for all Peruvian states and comparable Colombian and Brazilian Amazon states.
The adjusted proximity metric also presents certain weaknesses, which we have tried to correct. The
first stems from the fact that urban centers tend to have firms in industrial sectors that are not
necessarily technologically adjacent; industries simply co-locate there because there is enough demand
to make them sustainable. For this reason, we have focused our efforts on identifying sectors of goods
and services that are tradeable, where co-location patterns can tell us more about a place’s shared
productive capacities. Secondly, we addressed the risk of overestimating the ecosystem’s complexity
–even through this is a relative concept– given that our metric for identifying productive capacities is
 15
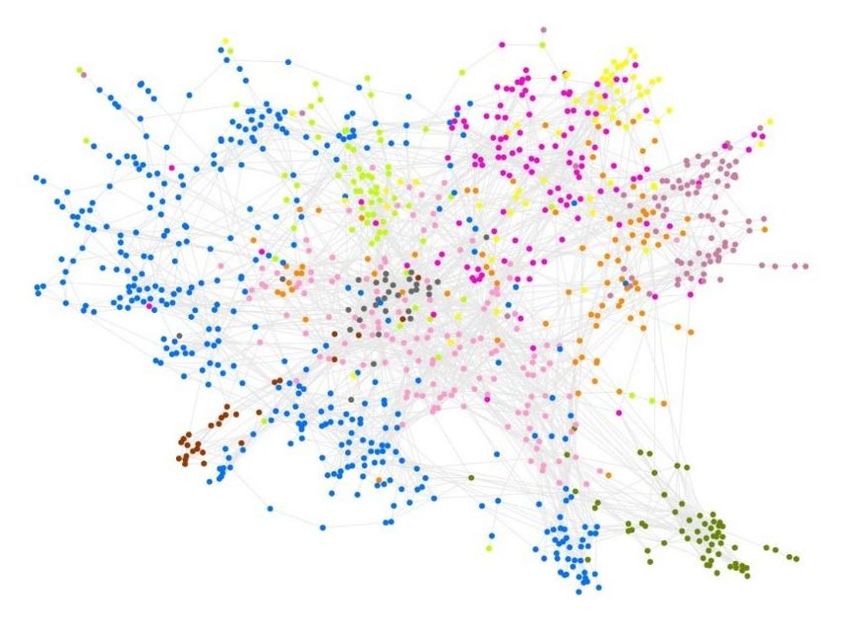
based on the presence of a single firm per industrial code. We reduce this risk by using the same
definition for both Peruvian and Amazon peers. Additionally, we developed and applied a second
proximity metric to compliment this co-location metric.
b. Co-production at the establishment level
Technological proximity between a pair of goods or services can also be calculated based on the
frequency with which they are produced within a same establishment. This metric, developed by
Coscia & Neffke (2017) adds another level of rigor to our calculations, since it is much more likely
that a pair of goods or services share productive capacities if they are produced through different
combinations of know-how within a same firm.
Just like with the previous co-location metric, this method of measuring technological distance also
has advantages and disadvantages. Because it is a more rigorous indicator of proximity, co-production
amplifies the importance of agglomeration and results in more defined network diagrams that are
easier to interpret, mainly in terms of clusters.
However, the most direct connections within clusters that stem from this metric come at the price of
weaker connections between different clusters. This effect places oversized importance to diversification
within a same cluster, which is not as helpful when trying to predict diversification between industries
that belong to different clusters. This tradeoff is especially relevant in the case of this study, since we
are mostly interested in observing diversification opportunities of places (cities, regions, cities), and
not of particular establishments.
It is possible to adjust co-production proximity metrics so as to fully exploit its features and mitigate
the effect of its disadvantages. By considering the bias in terms of industrial codes crowded within a
same cluster, and the long distances between them, we can normalize the frequency of co-occurrence
of products, and can therefore avoid the presence of extreme values within the distribution. For the
purposes of identifying sectors with a high potential for productive diversification (Section III), we
have used a combination of the two proximity metrics – co-location and co-production- described
above.
Figure 6 shows the Industry Space, which displays the proximity between industries according to co-
production metrics at the establishment level and allows us to visualize the configuration of industrial
clusters previously described. Each node represents one of the 1,046 industries (of goods or services)
registered in the U.S. Dun & Bradstreet database, colored by industrial cluster. The distance between
nodes represents the degree to which two industries rely on the same set of capacities.

 16
Figure 6: Industry Space

In the Industry Space, we can visualize the agglomeration of knowhow that is present in a place,
according to our definition of “presence” (the existence of at least one firm that has the corresponding
industrial code). Based on this, we can identify which adjacent industries require similar capacities. In
order to illustrate this process, we have compared the existing productive capacities in the state of
Loreto (Figure 7a) with those in the Amazonas state of Brazil (capital: Manaus, Figure 7b). The colored
nodes represent industries that are present in each place, whereas the grey nodes represent absent
industries, which do not have a firm registered with the corresponding code.
The side-by-side diagrams reveal several important differences between know-how agglomerations of
Loreto and its Brazilian peer. Firstly, we can observe that Loreto has fewer colored nodes (308) than
Amazonas (557), which reflects Loreto’s lower relative diversity. Secondly, we can note how most of
the clusters in Loreto – specifically, Professional Services (purple), Transport, Storage, Water and
Electricity (green), and Commerce (pink) industries – are less crowded and more scattered than those
in the Amazonas Industry Space. Industries belonging to the Manufacturing category (blue) in Loreto
tend to be more scattered and have clusters that are less crowded than those in Amazonas. This
scattering translates into a greater average distance between colored and grey nodes, an indication of
how far away the industries that are not yet present lie in terms of productive capacities. Altogether,
the location of both states within the Industry Space mirrors what was already shown in Figure 1 and
Figure 2, where Loreto displays a lower diversity and complexity (ECI) than the Brazilian state of
Amazonas.
 17
Figure 7: Industry Space, selected states
 (a) Loreto (Peru) (b) Amazonas (Brazil)

 18
The Industry Space can also be used to obtain diversification opportunity metrics for each state, based
on how connected current industries are to more complex and absent ones. This metric, called the
Complexity Outlook Index (COI), is an additional indicator of the strategic value that the development
of a particular industry will have for each state. Figure 8 shows the COI for Peruvian states and their
Amazon peers. In general, with a ranking of 13 out of 33 states 15, the result for Loreto is positive. A
high COI value indicates high potential for diversification and for boosting a place’s complexity.
Figure 8: Complexity Outlook Index, Loreto and peer states

 Complexity Outlook Index (COI)
 Loreto & Peers
 Arequipa
 Amazonas_BRA
 Pará
 Acre
 Callao
 La Libertad
 Ancash
 Lambayeque
 Piura
 Caquetá
 Ica
 Junin
 Loreto
 Cajamarca
 Puno
 Apurimac
 San M artin
 Tacna
 Ucayali
 Cusco
 Huanuco
 Putumayo
 Ayacucho
 Moquegua
 Amazonas_COL
 Lima
 Pasco
 Tumbes
 Huancavelica
 Madre De Dios
 Amazonas_PER
 Vichada
 Vaupés

 -3 -2 -1 0 1
 COI (Normalized)
 Source: Ow n calculations based on Dun & Bradstreet

In addition to defining how interconnected the different industries in Loreto are, our proximity
metrics also reveal which absent industries are “nearest” to Loreto’s current productive capacities.
This insight will allow us to identify the sectors in which Loreto has greater potential to grow, not
only at the state level, but also at the industry level.

15
 Given the similarity of results, this graph is calculated using the proximity by co-production metric. If we were to use
the proximity by co-location metric, Loreto would rank 14th out of 33.
 19
III. DIVERSIFICATION OPPORTUNITIES AND
 PRORITIZATION OF SECTORS
In previous sections, we deployed our methodology for surveying the diversity and ubiquity of existing
know-how in Loreto, and for quantifying technological proximity between industries. Based on this,
we can now determine which industries have the potential for driving the state’s productive
development. By selecting industries that require productive capacities similar to the ones that already
exist in Loreto, we can focus policy interventions on the acquisition of those productive capacities
that are absent. Our goal is to promote the emergence and growth of industries capable of generating
quality employment and sustaining higher wages for the citizens of Loreto, and to provide a roadmap
that may guide state and national policymakers in prioritizing policy interventions, targeting sectors
with the most potential which result from a rigorous, dynamic and iterative process for detecting and
addressing bottlenecks that inhibit growth.
Loreto’s sustained growth and productive diversification should arise from a combination of industries
that are already present in the state (intensive margin), and new ones that have high potential of
emerging given the existing productive capacities already in place (extensive margin). Thus, Loreto’s
development will hinge upon its ability to maximize the potential of both types of industries, by
expanding those which are already more dynamic and attracting new business models that can leverage
upon existing knowledge and latent capacities.
We have outlined a three-step process for identifying high-potential industries both in the intensive
and extensive margins.
The first step in this process involves selecting those industries that can be considered tradeable (goods
and services). 16 As previously stated, when it comes to tradeable goods and services, co-location as a
metric of technological proximity between industry pairs tends to be more useful in detecting the
existence of shared productive capacities. This is because non-tradeable goods and services tend to
co-locate in urban centers, where their diversity relies more on the existence of local demand rather
than on competitiveness. This does not mean that a productive development strategy based on
tradeable goods and services must exclude non-tradeable products, since demand for the latter usually
grows along with a place’s capacity to produce and export goods and services.
A second step in this process is the classification and prioritization of sectors according to complexity
metrics. On the intensive margin (i.e. the sectors that are already present in Loreto), we select those
industries that display a higher economic complexity (ECI) than the state average, and that also have
at least two registered firms. 17 Meeting these two conditions simultaneously will ensure that

16
 In this approach, activities in the categories of Retail, Construction, Wholesale, Real Estate, Insurance, Personal Services,
 Waste Management, Ground Transportation, Outpatient Health Services, and Private and Public Administration are
 mainly excluded. This reduces the number of industry codes from about 738 to 476 in the extensive margin, and from
 308 to about 173 in the intensive margin.
17
 This reduces the total of industrial codes from around de 173 to 126.
 20
governments focus productivity-boosting actions on the most sophisticated sectors that provide
higher wages, while also guaranteeing a minimum critical mass of industries within the state with which
the government can engage and establish joint work agendas for addressing bottlenecks.
In order to select sectors with the highest diversification potential on the extensive margin –industries
that are not yet present in Loreto – we must consider two additional variables that complement the
Product Complexity Index. The first of these is the Strategic Value (SV), which measures the extent
to which an industry can pave the way to other, more complex industries within the Industry Space.
This variable captures the value inherent in the possible diversification opportunities of an industry
into a broader array of sectors, which is additional to the value already present in an industry with a
revealed comparative advantage. SV represents the set of opportunities that the development of that
industry would bring to Loreto. The second variable is the distance metric that we have previously
described in Section II.a. We purposefully give a greater weight to this proximity indicator, to prioritize
the industries that are “closest” in terms of productive capacities, which can drive the path towards
diversification into other, more complex sectors in Loreto.
Extensive margin industries are selected using two different sets of rankings, which vary depending
on which proximity metric is used. The first is approximated through distance based on co-location
of firms and is the result of weighing distance (50%), strategic value (35%) and PCI (15%) for each
industry. 18 A second ranking uses distance based on co-production at the establishment level and is
the result of weighing distance (80%), SV (10%) and PCI for each industry (10%). We assign different
weights to the variables in each set of rankings due to the previously described advantages and
weaknesses of both proximity metrics. For proximity based on co-production, we assign greater
importance to distance within a same cluster. In this case, connections are stronger within clusters
than they are between clusters, so by assigning a greater relative weight to distance, we can more
faithfully capture which industries that are within the reach of Loreto’s productive capacities. When
working with co-location, we use the same weights that are used in the Atlas of Economic
Complexity’s “balanced approach.” 19
The two diagrams in Figure 9 show the relation between distance and economic complexity for
Loreto’s industries on the extensive margin, according to each of our two rankings. The 50 highest-
scoring industries for each proximity metric are shown in red.

18
 For calculation and presentation purposes, we have used the density of the sector, equivalent to the inverse of the
distance.
19
 Proximity metrics in the Atlas of Economic Complexity have been estimated based on co-location.
 21
Figure 9: Industry distance and complexity (extensive margin)
9a). Using co-location of firms and industries as a distance metric

 All Tradeable Industries and Co-Location Strategy
 Proxim ity based on industry co-location
 15

 10
 Complexity

 5

 0

 -5

 .6 .65 .7 .75 .8
 Distance

 Products using the co-location strategy Rest of products

 Source: Ow n calculations based on Dun & Bradstreet.

9b). Using co-production at the establishment level as a distance metric

 All Tradeable Industries and Co-Production Strategy
 Proxim ity based on industry co-production
 15

 10
 Complexity

 5

 0

 -5

 0 .2 .4 .6 .8 1
 Distance

 Products using the co-production strategy Rest of products

 Source: Ow n calculations based on Dun & Bradstreet.

 22
Figure 9a illustrates one of the main dilemmas inherent in the diversification process; more complex
industries tend to be located further away from the existing productive capacities of a place, while
industries that are relatively less complex, in general, tend to be closer. 20 This inverse relation can be
interpreted as a risk/return trade-off. In order to reach the more economically complex industries,
places must make longer jumps in terms of capacities. Industries that are reachable through longer
jumps tend to be more attractive, but the process is also riskier, since it requires the acquisition or
development of capacities that are further away from the place’s initial stock of know-how.
The classification exercise we performed, both for the intensive and extensive margins, is summarized
in Figure 10. On the left side, from both sets of rankings for the extensive margin – which correspond
to the two different proximity metrics– we have chosen 50 industries that have the highest weighed
score. On the right side, we have selected all the industries on the intensive margin that have an ECI
that is higher than Loreto’s average and have at least 2 registered firms.
Finally, and with the aim of making this list into a useful input for the design and implementation of
public policies, we group the identified industries into five thematic areas that can provide a roadmap
for Loreto’s productive diversification and structural transformation. The thematic areas that contain
the highest number of selected industries are defined as areas of growth and diversification, using the
NAICS industry classification system as a guide. As expected, this process requires that certain
discretionary decisions are taken.
We chose to exclude natural resource extraction –such as mining and natural gas– from the list of
potential sectors, because their location does not rely on knowledge agglomeration, but rather on
where the natural resource in question is being exploited. Moreover, natural resource extraction ranks
as one of the least complex activities in the entire industrial spectrum. A second consideration in this
process is more practical. In order to design effective policy interventions that can increase the
productivity of existing industries and maximize the likelihood of success of attracting new business
models, public policy in Loreto should organize around wider categories, as opposed to very specific
industrial sectors. Thus, we exclude from the lists all industries which do not map onto any of the five
thematic areas. In this way, we reduce the total number of potential economic activities to 28 in the
intensive margin, and 27 in the extensive margin, totaling a list of 55 industries.

20
 This inverse relation also holds true for an industry’s strategic value and distance.
 23
Figure 10: Process for Identifying Sectors

 Focus on Tradables
 Excludes Non-tradeable sectors

 Extensive Margin Intensive Margin
 (Missing industries) (Existing industries with > 1 firm)
 M=0 M=1

 Economic Complexity
 Higher weighting of several complexity metrics
 Exclusive weighting of complexity
 Co-Location Co-Production
 Density PCI COG Density PCI COG
 0.5 0.15 0.35 0.8 0.1 0.1 ECI ≥ ECI Loreto
 Top 50 Top 50 69 industries

 Themes with growth and diversification potential
 Only industries that can be grouped into a theme, excluding mining
 and gas NNRR

This process yielded five thematic areas that group industries, both on the intensive and extensive
margins, that have a high potential for driving Loreto’s productive transformation. These thematic
areas, shown in Figure 11, in no particular order, are: i) Forestry, flora and fauna activities, ii) Food
and chemical industries, iii) Manufacturing and transportation services, iv) Tourism and creative
industries, and v) Construction manufacturing. It is our hope that these sectors may spearhead the
structural transformation and diversification of Loreto’s economy.

 24
Figure 11: Thematic areas

Figure 12 lists the industries that make up each thematic area.

 25
Figure 12: Thematic areas and industries*

*Industries in bold correspond to the intensive margin.

 26
IV. CONCLUSIONS AND POLICY RECOMMENDATIONS
Our analysis shows that Loreto, Peru’s largest state in size and one of its most isolated, possesses a
stock of capacities and productive know-how that places it near the median of the rest of Peru’s states,
above most of its Colombian peers, and beneath its Brazilian counterparts. Although Loreto has relied
on the extraction of natural resources such as rubber, oil and lumber since its founding, these
industries have, in turn, generated a productive ecosystem around them that is more complex than
one would expect given the circumstances. This complexity opens possibilities for Loreto to expand
towards other, higher value-added economic activities that can sustain higher wages and contribute to
the prosperity of its population.
Given the agglomeration of productive know-how in Loreto, Gross Value Added per capita in this
state is below the expected levels. In order to bridge this gap, we must identify which industries could
develop based on the productive capacities that are currently available in the region, considering the
constraints that prevent such potential from being realized. We developed two alternative
technological proximity metrics for industrial sectors, all while trying to maximize the sources of
publicly available data. Based on these, and other economic complexity metrics, we identified the
industries with the greatest potential to drive Loreto’s productive transformation.
Our analysis yielded 55 high potential sectors, 28 of which are already present in Loreto, and 27 which
have yet to be developed using the productive capacities that are currently present there. Realizing the
potential that Loreto’s ecosystem harbors relies on the state’s ability to promote greater productivity
in strategic sectors that are already present, as well as attracting new business models. These 55
industries have been further grouped into 5 thematic areas: i) Forestry, flora and fauna, ii) Food and
chemical industries, iii) Manufacturing and transporting services, iv) Tourism and creative industries,
and v) Construction manufacturing.
This is but an initial roadmap for national and state policymakers on which to focus their efforts.
Although it is the result of a rigorous process, it is does not consider the viability, attractiveness and
environmental sustainability metrics that are crucial for Loreto’s context. Moreover, this analysis was
performed at the state level, which implicitly assumes that the letters (know-how) required to form
these words (goods and services) are present within this geographical unit. This assumption does not
necessarily hold true for all industries, especially when considering distance and connectivity issues
that are present throughout Loreto’s different provinces. These considerations, along with the
identification of binding constraints to the realization of these industries’ potential, will be covered in
the policy recommendations report that concludes this research engagement.

 27
BIBLIOGRAPHY
Balassa, B. (1964). “The Purchasing-Power Parity Doctrine: A Reappraisal”. Journal of Political
Economy, 72 (6), 584-596.
Coscia, Michele & Neffke, Frank (2017). “Network Backboning with Noisy Data”. 2017 IEEE 33rd
International Conference on Data Engineering (ICDE).
Hausmann, R., Velasco, A. & Rodrik, D. (2005) “Growth Diagnostics”. In J. E. Stiglitz & N. Seroa
(eds), The Washington Consensus Reconsidered: Towards a New Global Governance. Oxford University Press.
Hausmann, Ricardo, & Bailey Klinger (2006). “Structural Transformation and Patterns of
Comparative Advantage in the Product Space.” Harvard Center for International Development,
Faculty Working Paper Series, No. 128.
Hausmann, R., Hwang, J., & Rodrik, D. (2007), “What You Export Matters”, Journal of Economic
Growth, 12 (1): 1–25.
Hausmann, R., Rodrik, D., & Sabel, C. (2008). “Reconfiguring Industrial Policy: A Framework with
an Application to South Africa”. HKS Working Paper No RWP08-031.
Hausmann, R. & Hidalgo, C. (2009). “The Building Blocks of Economic Complexity”. Proceedings
of the National Academy of Sciences, 106, 10570‐10575.
Hausmann, R., Hidalgo, C., Bustos, S., Coscia, M., Chung, S., Jimenez J., Simoes, A., & Yildirim, M.
(2011). “The Atlas of Economic Complexity”. Puritan Press, Cambridge, MA.
Hausmann, Ricardo & Hidalgo, Cesar A. & Stock, Daniel P. & Yildirim, Muhammed A., 2014.
“Implied Comparative Advantage.” Working Paper Series rwp14-003, Harvard University, John F.
Kennedy School of Government.
Hausmann, R., Pietrobelli, C. & Santos, M. (2020). “Place-specific Determinants of Income Gaps:
New Sub-national Evidence from Mexico”. CID Faculty Working Paper No. 343, July 2018, revised
February 2020.
INEI (2017). “Perú: Estructura empresarial, 2016”. Lima, octubre de 2017.
https://www.inei.gob.pe/media/MenuRecursivo/publicaciones_digitales/Est/Lib1445/libro.pdf
INEI (2019a). “Perú: Evolución de los Indicadores de Empleo e Ingreso por Departamento, 2007-
2018”.
https://www.inei.gob.pe/media/MenuRecursivo/publicaciones_digitales/Est/Lib1678/libro.pdf
INEI (2019b). “Evolución de la Pobreza Monetaria 2007-2018”. Informe técnico.
https://www.inei.gob.pe/media/MenuRecursivo/publicaciones_digitales/Est/Lib1646/libro.pdf
Reynolds et al (2018). A Sub-national Economic Complexity Analysis of Australia’s States and
Territories. Regional Studies, 52:5, 715-726, DOI: 10.1080/00343404.2017.1283012.

 28
APPENDIX
As we have previously defined, a place is able to produce a good or render a service when there it at
least one firm registered under that corresponding good or service’s NAICS industrial code in that
location; in other words, our Revealed Comparative Advantage (RCA) metric. In a matrix Mcp where
a value of 1 is assigned if the place contains the industrial code or product p, and 0 if it does not,
diversity and ubiquity are, respectively, the sum of each line and each column of this matrix. For any
industry or product p and place c:

 = ,0 = ∑ (1)

 = ,0 = �

In order to approximate an indicator that can quantify a place’s productive capacities, or the stock of
know-how required to make a specific product, we must correct for the product’s diversity metric by
using its ubiquity data. Based on this information, we calculate the Product Complexity Index (PCI)
and the place’s Economic Complexity Index (ECI). In the case of products, we determine the average
diversity of the places that make them, and the average ubiquity of the other products that these places
are able to make. In the case of places, we estimate the average ubiquity of the basket of goods and
services that these locations can produce, and the average diversity of places able to make these
products. These successive adjustments can correct for possible errors that arise when calculating a
product’s or place’s complexity, such as in the case of natural resource extraction.
The fact that the diversity of places that display an RCA in natural resources is low, despite these being
low-ubiquity activities, means that we are not dealing with a complex industry, but rather with an
economic activity that tends to exist only in places where those resources are located. Usually, this
recursive process, known as the reflection method, is based on diversity and ubiquity metrics, and is
formally defined as:
 1
 , = ∑ , −1 (2)
 ,0

 1
 , = ∑ , −1 (3)
 ,0

For N ≥1. Where (2) is in place of (1) we obtain:
 1 1
 , = ∑ ∑ ′ ′ ′, −2 (4)
 ,0 ,0

 ′
 , = ∑ ′ ′, −2 ∑ (5)
 ,0 ,0

 29
Which can also be expressed as:
 � ′ ′, −2
 , = ∑ ′ (6)
Where:
 � ′ = ∑ ′
 (7)
 ,0 ,0

Equation (6) can only be satisfied when , = , −2 = 1. This is the eigenvector of � ′
corresponding to the highest eigenvalue. Since this is a vector of 1s, it is not informative. Therefore,
we look for the eigenvector with the second highest eigenvalue of the � ′ matrix, which we define
as the Economic Complexity Index. This is helpful in capturing the highest amount information within
the system of equations, and it is the method employed to measure economic complexity. 21 Similarly,
by calculating the average diversity of the countries that make a specific product, and the average
ubiquity of the other products that these countries make, we approximate the product complexity
index, which follows from a similar process as the previous:

 � ′ = ∑ ′
 (8)
 ,0 ,0

In order to obtain a sophistication metric (PCI) that is closer to the technological possibilities frontier,
we first calculate indicators for United States districts. We then use this metric, along with productive
know-how agglomeration indicators (ECI) for Loreto, Amazon peer states and the rest of Peruvian
states to calculate the average complexity of existing industries in each state:

 ∑ ∗
 = (9)
 =1

We now define the proximity measures, ∅ , ′ , regardless of whether they were approximated through
co-location or co-production. In this case, the distance of a product is defined as the sum of the
proximities connecting that product to all the products that the given location does not currently
produce. For industry or product p at location c, and distance d:
 ∑ (1− ′ )∅ , ′
 = ∑ ′ ∅ , ′
 (10)

21
 While Hidalgo and Hausmann (2009) introduce the Economic Complexity Index using an iterative calculation,
Hidalgo et al (2011, 2014), show that the system converges and that its solution is the second eigenvalue. Both solutions
are equivalent.
 30
You can also read