City sanitation and socioeconomics predict rat zoonotic infection across diverse neighbourhoods
←
→
Page content transcription
If your browser does not render page correctly, please read the page content below
Received: 25 March 2020     |   Revised: 11 May 2020   |   Accepted: 25 May 2020

DOI: 10.1111/zph.12748

ORIGINAL ARTICLE

City sanitation and socioeconomics predict rat zoonotic
infection across diverse neighbourhoods

Maureen H. Murray1      | Mason Fidino1     | Rebecca Fyffe2 | Kaylee A. Byers3,4                                                                |
James B. Pettengill5 | Kerry S. Sondgeroth6 | Halcyon Killion6 | Seth B. Magle1 |
Maria Jazmin Rios1 | Nora Ortinau7 | Rachel M. Santymire1

1
 Department of Conservation and Science,
Lincoln Park Zoo, Chicago, IL, USA                Abstract
2
 Landmark Pest Management, Chicago, IL,           Rat-associated zoonoses transmitted through faeces or urine are of particular con-
USA
                                                  cern for public health because environmental exposure in homes and businesses
3
 Department of Interdisciplinary Studies,
University of British Columbia, Vancouver,
                                                  may be frequent and undetected. To identify times and locations with greater public
BC, Canada                                        health risks from rats, we investigated whether rat characteristics, environmental
4
 Canadian Wildlife Health Cooperative,            features, socioeconomic factors, or season could predict rat infection risk across di-
Animal Health Centre, Abbotsford, BC,
Canada                                            verse urban neighbourhoods. In partnership with a pest management company, we
5
 Center for Food Safety and Applied               sampled rats in 13 community areas along an income gradient in Chicago, a large city
Nutrition, United States Food and Drug
                                                  where concern about rats has increased in recent years. We collected kidneys for
Administration, College Park, MD, USA
6
 Wyoming State Veterinary Laboratory,             Leptospira spp. testing and colon contents for aerobic bacteria such as Salmonella spp.
Laramie, WY, USA                                  and Escherichia coli. Of 202 sampled rats, 5% carried Leptospira spp. and 22% carried
7
 School of Public Health, University of
                                                  E. coli. Rats were significantly more likely to carry Leptospira spp. on blocks with more
Illinois at Chicago, Chicago, IL, USA
                                                  standing water complaints in higher-income neighbourhoods (OR = 6.74, 95% CI:
Correspondence
                                                  1.54–29.39). Rats were significantly more likely to carry E. coli on blocks with more
Maureen H. Murray, Department of
Conservation and Science, Lincoln Park Zoo,       food vendors (OR = 9.94, 2.27–43.50) particularly in low-income neighbourhoods
2001 N Clark St., Chicago, IL, USA, 60614.
                                                  (OR = 0.26, 0.09–0.82) and in the spring (OR = 15.96, 2.90–88.62). We detected a
Email: maureenmurray@lpzoo.org.
                                                  high diversity of E. coli serovars but none contained major virulence factors. These
Funding information
                                                  associations between environmental features related to sanitation and infection risk
This work was supported by the Grant
Healthcare Foundation.                            in rats support transmission through water for Leptospira spp. and faecal–oral trans-
                                                  mission for E. coli. We also found opposing relationships between zoonotic infection
                                                  risk and income for these two pathogens. Thus, our results highlight the importance
                                                  of sanitation for predicting zoonotic disease risks and including diverse urban areas
                                                  in pathogen surveillance to mitigate public health risks from rats.

                                                  KEYWORDS

                                                  disease reservoirs, sanitation, socioeconomic factors, urban rats, zoonoses

1 | I NTRO D U C TI O N                                                            Leptospira interrogans) or faeces (e.g., Escherichia coli; Himsworth,
                                                                                   Bidulka, et al., 2013; Himsworth, Parsons, Jardine, & Patrick, 2013).
Living with rats creates challenges for public health in cities world-             These rat-associated zoonoses are transmitted through environmen-
wide. Commensal rats (brown rats Rattus norvegicus and black rats                  tal contamination and are of particular concern for public health be-
Rattus rattus, hereafter ‘rats’) can carry several zoonotic pathogens              cause they do not require direct contact with rats. Exposure may thus
that can be transmitted to humans via contact with rat urine (i.e.,                be more frequent or undetected. For example, Leptospirosis is an

Zoonoses Public Health. 2020;00:1–11.                          wileyonlinelibrary.com/journal/zph© 2020 Blackwell Verlag GmbH                       |   1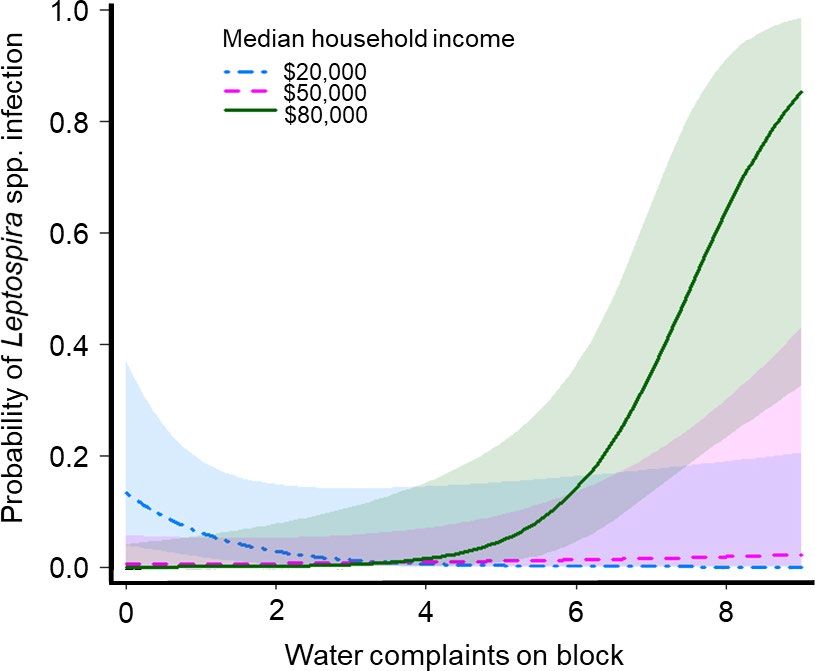
2   |                                                                                                                                  MURRAY et al.

emerging zoonotic disease with roughly 1 million cases and 58,000
deaths per year (Bharti et al., 2003; Costa, Hagan, et al., 2015).
                                                                                  Impacts
Although traditionally considered a rural disease, sporadic out-
                                                                                  • Rats were more likely to be infected with Leptospira spp.
breaks of Leptospirosis have been reported in urban centres (Vinetz,
                                                                                    on blocks with standing water issues in higher-income
Glass, Flexner, Mueller, & Kaslow, 1996) including tropical slums
                                                                                    neighbourhoods, which highlights that surveillance
(Hagan et al., 2016) and more recently in European cities (Dupouey
                                                                                    should not be limited to low-income communities.
et al., 2014). These outbreaks have led to increasing concern about
                                                                                  • Rats were more likely to carry Escherichia coli on blocks
expanding urban rat populations because households infested with
                                                                                    with more food vendors, particularly in low-income
rats can have a higher risk of infection (Hagan et al., 2016). Rat fae-
                                                                                    neighbourhoods. Although we did not detect concerns
ces can also contain antimicrobial-resistant and pathogenic strains
                                                                                    for human disease, rat infection near restaurants pro-
of bacterial pathogens known to cause diarrhoeal diseases in hu-
                                                                                    vides opportunities for food contamination.
mans (i.e., Salmonella enterica, Escherichia coli, and Staphylococcus
                                                                                  • Sanitation concerns and socioeconomic status in com-
aureus) (Guenther et al., 2012; Himsworth et al., 2015). Thus, even
                                                                                    munities may be important in predicting some rat-as-
living in proximity to rat infestations can increase public health risks
                                                                                    sociated zoonotic disease risks over large and diverse
for significant zoonotic infections.
                                                                                    urban areas.
        To minimize public health risks via targeted rodent control, it is
critical to understand the ecology of rats and rat-associated zoono-
ses to identify biological, spatial, and temporal predictors of rat in-
fection. Although urban rat ecology is complex and a growing field of
study, rats are often more abundant (Rael, Peterson, Ghersi, Childs,         transmitted zoonotic pathogens Leptospira spp., E. coli, Salmonella,
& Blum, 2016) and can be more likely to carry L. interrogans (Ayral          Campylobacter spp., and Staphylococcus aureus. We predicted that
et al., 2015) in neighbourhoods with lower incomes. This is likely be-       rats would be more likely to carry Leptospira spp. if they were sam-
cause fewer resources are available for property maintenance and             pled near areas with drainage issues, because this pathogen is trans-
rodent control. Local habitat features such as sanitation and food           mitted through water, and more likely to carry Salmonella and E. coli
waste may be strong determinants of spatial heterogeneity in rat in-         if they were sampled in areas with more food waste because they
fection because of their role in rat or pathogen ecology. For example,       are transmitted through faecal–oral contact. We also predicted
the presence of food waste in garbage can promote rat infestations           that infection risk would be higher in areas with lower incomes and
(Murray et al., 2018) and potentially the transmission of faecal–oral        higher rat densities. Because rat characteristics (i.e., age, sex, inju-
pathogens such as E. coli and Salmonella due to faecal contamination         ries) and season have been found to influence whether rats carry
and contact with food waste (Nelson, Jones, Edwards, & Ellis, 2008).         certain pathogens, we also evaluated how these factors influenced
Other sanitation concerns, such as standing water from poor drain-           pathogen status. Identifying the contexts in which urban residents
age, can create microhabitat conditions suitable for transmission of         are more at risk of rat-associated zoonoses will help mitigate public
Leptospira spp. via contact with contaminated surface water (Ganoza          health concerns in cities struggling with rodent pests.
et al., 2006). Variation in rat infection risk is likely also due to in-
dividual rat characteristics because rats that are older (Himsworth
et al., 2014) and have more injuries (Himsworth, Bidulka, et al., 2013;      2 | M E TH O DS
Himsworth, Parsons, Jardine, & Patrick, 2013) can be more likely to
carry some pathogens. Seasonal changes in weather may also af-               2.1 | Study area
fect pathogen transmission via seasonal peaks in population density
(Feng & Himsworth, 2014) and the persistence of bacteria in the en-          We studied rat disease ecology in Chicago, the third largest city in
vironment (Van Elsas, Semenov, Costa, & Trevors, 2011). Because              the United States with a population of 2.7 million (United States
of these factors, rat-associated zoonotic disease risk varies across         Census Bureau, 2017), which borders Lake Michigan and has warm
space and time. Understanding the spatiotemporal dynamics of rats            humid summers and cold winters (Wolfram Alpha, 2020). The city is
and their zoonoses will help to mitigate public health risks.                composed of over 200 neighbourhoods, grouped into 77 commu-
        Given that environmental and socioeconomic factors can pro-          nity areas whose permanent boundaries were defined by the City of
mote rat abundance and that increased rat density may promote                Chicago (CMAP, 2017). From 2013 to 2018, public complaints about
pathogen spread among rats, we investigated whether these factors            rats increased by 34% and these complaints appear to reflect differ-
could be used to predict areas of greater rat-associated zoonotic            ences in rat abundance across community areas (Murray et al., 2018).
risk. We studied predictors of rat zoonotic infection risk in Chicago,       Chicago neighbourhoods also differ in income, with affluent neigh-
Illinois, USA, a large city with increasing concerns about urban             bourhoods earning median household incomes nearly seven times
rats (Murray et al., 2018) and greater disparities in income than            higher than the least affluent neighbourhoods (CMAP, 2017). To
the national average (Asante-Muhammad, 2017). We sampled rats                capture this variation in rat conflicts and socioeconomic status, we
along an income gradient and tested them for the environmentally             sampled rats in 13 community areas that varied in the number of rat
MURRAY et al.
TA B L E 1 Summary of community areas in Chicago selected for rat sampling
Leptospira
Rats spp. positive E. coli positive Median Household Standing water Food Rat
Community area sampled (n) (prevalence) (prevalence) E. coli serovars detected Income (USD) complaints vendors complaints
Armour Square (AS) 19 1 (0.05) 10 (0.53) O10:H56, O129:H48, O153:H14, O17:H41, $24,336.46 1 213 158
O32:H12, O7:H7, O71:H45, O8:H25
Beverly (BE) 1 0 (0.00) 1 (1.00) O45:H8 $90,765.77 11 56 99
Englewood (EN) 6 1 (0.17) 2 (0.33) O109:H8, O4:H5 $19,853.78 5 62 631
Forest Glen (FG) 2 0 (0.00) 2 (1.00) O8:H8 $101,558.60 8 63 324
Greater Grand 12 0 (0.00) 1 (0.08) O150:H8 $26,515.05 12 140 490
Crossing (GG)
Lake View (LV) 32 5 (0.16) 8 (0.25) O13:H14, O153:H30, O170:H28, O4:H5, $76,854.22 49 1,094 1574
O62:H30, O7:H7, O71:H12
Logan Square (LS) 38 1 (0.03) 3 (0.08) O109:H21, O132:H49 $59,216.40 54 424 1515
Near North Side 19 0 (0.00) 5 (0.26) O132:H49, O163:H14, O39:H7, O71:H45 $84,975.80 25 1,043 355
(NN)
New City (NC) 10 1 (0.10) 0 (0.00) - $30,420.92 10 145 586
North Lawndale 6 1 (0.17) 3 (0.50) O132:H49, O18:H49 $22,383.49 12 98 827
(NL)
South Lawndale 31 0 (0.00) 5 (0.16) O132:H49, O153:H14, O174:H2 $30,700.56 17 273 1,142
(SL)
Washington Park 1 0 (0.00) 0 (0.00) - $22,084.75 0 41 74
(WP)
West Ridge (WR) 23 0 (0.00) 1 (0.04) - $46,091.23 33 417 1,042
All areas 202 10 (0.05) 43 (0.21) $48,904.39 237 4,069 8,817
Note: Two-letter initials correspond with Figure 3.
|
34 | MURRAY et al.
complaints received per year by the City of Chicago via 311 reports was evaluated on 1.5% agarose gel, and if present the case was con-
and represented an income gradient (Table 1). sidered positive. A positive control (DNA from Leptospira interrogans
serovar Copenhageni ATCC BAA-1198D-5) and no template control
(nuclease-free water) were used to ensure the PCR reaction was suc-
2.2 | Sample collection cessful and there was no contamination.
In collaboration with a pest management company, Landmark Pest
Management, we trapped rats in alleys using snap trap stations (pairs 2.4 | Aerobic culture
of Victor snap traps in JT Eaton aluminium stations). Traps were baited
with cat food or anchovy paste and checked every 48 hr. To maximize Intestinal contents were plated for isolation with a sterile swab onto
trap success, we selected four alleys in each community area with the multiple agar plates purchased and quality controlled from Hardy
highest number of rat complaints. Within community areas, the dis- Diagnostics including Columbia blood agar with 5% sheep blood
tance between alleys was 1,678 ± 573 m (mean ± SD). We followed (CBA), MacConkey (MAC), and Campy blood free Karmali (CAMPY).
a standardized trapping design of 10 traps per alley to calculate trap Subsequently, the swab was placed in selenite broth (Selenite
success, which is the number of rats caught per trap and per trap Cystine Broth, Hardy Diagnostics) for enrichment of Salmonella spp.
night. Although we could not account for sprung traps (i.e., bycatch or The CBA, MAC plates, and selenite broth were incubated at 37°C in
false closure), we accounted for any lost traps due to theft or damage ambient O2. CAMPY plates were incubated at 41°C in microaero-
(Murray et al., 2018). To detect seasonal changes in infection risk and philic conditions. At ~18–24 hr, the selenite broth was sub-cultured
minimize sample degradation from warm weather, we trapped rats from for isolation onto HardyCHROMtm Salmonella, and Hektoen Enteric
March 1 to June 20, 2018 (average ± SD trap nights per alley = 54 ± 3; agar plates and incubated at 37°C ambient O2. Culture plates were
daily average ± SD temperature = 10.2°C ± 5.7) and from November 5 read and documented once at 18–24 hr, and again at 36–48 hr.
to December 5, 2018 (30 ± 0 trap nights per alley; 1.5°C ± 2.1). Trapped Colonies from each sample were analysed by matrix-assisted laser
rats were immediately frozen at −20°C until processing. All rats were desorption/ionization time-of-flight mass spectrometry (Bruker
captured as part of ongoing pest management by a private company Biotyper, Hamburg Germany) following the manufacturer's instruc-
and so this study was exempt from IACUC Approval. tions for identification. S. aureus, E. coli, and Salmonella isolates were
Rats were thawed to 4°C and underwent a full necropsy. We sub-cultured and then frozen at −80°C for further analysis.
recorded rat sex and reproductive status as a proxy for age class
(sexually mature vs. immature) using genital morphology, recorded
the presence of cutaneous wounds, and collected morphomet- 2.5 | E. coli sequencing
ric measurements including mass, total length, tail length, hind
foot length, and ear length (Table S1). We collected both kidneys Whole-genome sequencing (WGS) was performed on all E. coli
for Leptospira spp. testing and colon contents for aerobic bacterial isolates using the Illumina MiSeq platform with the Nextera XT li-
culture, such as E. coli, Salmonella enterica, Campylobacter spp., and brary prep kit and V2 chemistry. Sequencing was done according to
Staphylococcus aureus. Biological samples were stored at −80°C in the manufacturer's protocols. Draft genome assemblies were cre-
sterile Whirlpak bags until they were shipped to the Wyoming State ated from the WGS data using the default settings in SKESA v.2.2
Veterinary Laboratory (Laramie, WY) for diagnostic PCR for patho- (Souvorov, Agarwala, & Lipman, 2018). The program ectyper v0.8.1
genic Leptospira spp. and culture for aerobic bacteria. The Wyoming was used to predict the serotype from the draft assemblies for each
State Public Health laboratory serotyped all Salmonella isolates. isolate (National Microbiology Laboratory, 2019). To evaluate the
virulence of each isolate, we ran AMRFinder v3.2.3 on each assem-
bly using the default settings (Feldgarden et al., 2019). In addition to
2.3 | Leptospira PCR including known antimicrobial resistance genes, the database used
with AMRFinder includes known virulence factors found in E. coli
DNA was extracted from kidney tissue using the MagMAX-96 DNA (e.g., Shiga toxin-producing genes). All sequence data are publicly
Multi-Sample Kit (Applied Biosystems) following manufacturer's accessible under the BioProject PRJNA230969 with the National
instructions. Four microliters of DNA extract was used in each Center for Biotechnology Information (Table S2).
Leptospira spp. PCR reaction targeting the lig gene found in patho-
genic leptospires (Palaniappan et al., 2005). Primers Lig1 (5'- TCA
ATC AAA ACA AGG GGC T-3') and Lig2 (5'- ACT TGC ATT GGA AAT 2.6 | Sanitation data
TGA GAG-3') were used in a 50 µl reaction containing 24 µl GoTaq
green Master Mix (Promega), nuclease-free water, 2 µl of 50 mM We assessed whether poor sanitation promoted zoonotic infec-
MgCl, and 650 nm of each primer. Cycling conditions of 95°C for tion risk in rats using several types of municipal sanitation data. We
5 min, 35 cycles of 95°C for 30 s, 48°C for 45 s, 72°C for 30 s, and first tested whether rats were more likely to carry Leptospira spp. if
72°C for 7 min (Palaniappan et al., 2005) . An amplicon size of 480 bp they were trapped in alleys where public complaints had been madeMURRAY et al. | 5
TA B L E 2 Comparison of candidate models containing predictors of Leptospira spp. or Escherichia coli infection in rats using AICc
Random effect
Pathogen Model Model description ΔAICc Deviance variance
Leptospira spp. Sanitation and SES Standing water complaints*Income 0.00 61.76 0.31
Global Injuries + Season +Sex + Reproductive 4.77 50.53 0.22
+Water*Income + Water*Trap success
Sanitation Standing water complaints 7.22 72.98 0.33
Sanitation and Trap success*Standing water complaints 7.34 69.10 0.27
abundance
Individual biology Injuries + Sex +Reproductive 10.52 68.28 1.72
Null Intercept 10.59 78.35 1.65
Relative abundance Trap success 11.97 77.73 1.54
Socioeconomics Median household income 12.03 77.79 1.63
Season Capture season 12.29 78.05 1.56
E. coli Global Injuries + Season +Sex + Reproductive 0.00 128.26 0.36
+Food inspections*Income + Food
inspections*Trap success
Season Capture season 9.95 160.21 1.11
Individual biology Injuries + Sex +Reproductive 24.83 165.09 1.83
Sanitation and SES Food inspections*Income + Proportion 25.39 171.65 1.63
failed inspection*Income
Sanitation Food inspections + Proportion failed 30.95 181.21 2.05
inspections
Relative abundance Trap success 30.76 181.02 2.22
Sanitation and Trap success*Food inspections 28.07 174.33 1.61
abundance
Null Intercept 32.21 184.47 2.20
Socioeconomics Median household income 33.82 184.08 2.17
Note: Asterisk (*) indicates that both terms were in the model individually as well as their interaction.
SES, socioeconomic status.
about the presence of standing water. We accessed all public com- especially associated with food vendors with rodent-related sanita-
plaints regarding standing water sanitation violations made to City tion complaints. To test this prediction, we calculated the proportion
of Chicago Streets and Sanitation via 311 between 2015 and 2018 of vendors that failed their inspections due to rodent sightings or
using the Chicago Data Portal (City of Chicago, 2020). We pooled signs such as droppings, chew marks, or grease marks.
complaints over multiple years to include areas with drainage issues To relate rat infection status with sanitation data, we re-
that persisted for months. corded the presence of standing water complaints or food inspec-
We also evaluated whether rats were more likely to carry E. coli tions if they were within 150 m of the trapping alley using QGIS
and Salmonella if they were trapped near areas with more food ven- (QGIS Development Team, 2020). This buffer size approximates
dors. We predicted a positive association between E. coli prevalence the size of rat home ranges in other cities (Byers, Lee, Patrick, &
and food vendors because food waste from restaurants may aggre- Himsworth, 2019; Combs, Puckett, Richardson, Mims, & Munshi-
gate rats and promote the transmission of pathogens that spread via South, 2018) and corresponds to roughly one city block.
a faecal–oral route, such as E. coli. Food vending can be a significant
source of food waste as vendors dispose of up to 20% of handled or
prepared food annually and can therefore create areas with higher 2.7 | Statistical analysis
amounts of food waste relative to residential or commercial areas
(Silvennoinen, Heikkilä, Katajajuuri, & Reinikainen, 2015). To include We used binomial generalized linear mixed models to test whether
the locations of food vendors, we accessed all food inspections per- rat zoonotic infection risk increased with sanitation concerns, lower
formed in 2018 by the Chicago Department of Public Health's Food socioeconomic status, season, rat relative abundance, and rat char-
Protection Program (Chicago Department of Public Health, 2020). acteristics. Our response variable was the infection status (positive
From this dataset, we included all locations of businesses that sell or negative) of each rat. We created nine candidate models for each
food to the public. We also predicted that rat infection risk would be pathogen, which reflect different hypotheses on the spatiotemporal6 | MURRAY et al.
predictors of rat zoonotic infection risk. These models included a (a) to be Rattus norvegicus based on the morphology of the ears and
global model (all terms) and (b) null model (intercept only) as well as tail relative to body size (Aplin, Chesser, & Have, 2003) but this was
models related to (c) individual biology, (d) season, (e) sanitation, (f) not confirmed via genetic analyses. Of these, 202 were trapped be-
socioeconomics, (g) rat relative abundance, (h) sanitation and socio- tween March 1–May 23 and November 8–December 1 and were in
economics, and (i) sanitation and rat relative abundance (Table 2). adequate condition to be necropsied with no visible signs of decom-
In all models, we censored trapping sites where fewer than four position. These included 105 females (67 adults, 36 subadults) and
rats were captured to minimize bias on prevalence from low sample 97 males (65 adults, 32 subadults; Table 1). Trap success ranged from
size (retained 82% of dataset). Capture site (i.e., alley) was treated 0.003 to 0.096 rats per trap per night across alleys. The overall preva-
as a random effect. We did not include highly correlated terms in lence of Leptospira spp. was 5.0% (10/202), 21.7% for E. coli (44/202),
2
the same model (R > .6), continuous variables were standardized 1.0% for Salmonella (2/202, both serovar Enteriditis), and 1.9% for
with a mean of 0 and standard deviation of 1 prior to analysis, and Staphylococcus aureus (4/202). We did not detect Campylobacter spp.
modelling was performed using the package lme4 in R (RStudio or Clostridium spp. Based on these prevalence rates, we only ana-
Team, 2016). The relative fit of each candidate model for each path- lysed predictors of infection for Leptospira spp. and E. coli and the
ogen was compared using AICc, and all models within two ΔAICc prevalence of both pathogens varied by neighbourhood (Figure 1).
of the best fit model were considered to have substantial support For Leptospira spp., the best model contained sanitation, socio-
(Burnham & Anderson, 2002). We then used top-ranked models to economic status, and their interaction (Table 2). Based on parameter
predict the probability of infection in all community areas across the 95% confidence intervals, rats were significantly more likely to carry
city using the predict.glm function in R. Leptospira spp. if they were trapped on blocks with more standing
water complaints, but this relationship was only significant as an
interaction with income (odds ratio = 6.74, 95% C.I. = 1.54–29.39;
3 | R E S U LT S Table 3). Alleys with standing water complaints in high-income
neighbourhoods were more likely to have Leptospira spp.-positive
In total, 254 rats were trapped between March 1–June 20 and rats than alleys with water complaints in lower-income neighbour-
November 5–December 5, 2018. All trapped rats were presumed hoods (Figure 2). Because the top model for Leptospira spp. infection
F I G U R E 1 Map of study community
areas showing pathogen prevalence in
sampled rats. Community areas where
≥4 rats were sampled are shaded by the
prevalence of Escherichia coli and pie
charts show the prevalence of Leptospira
spp. carriage in ratsMURRAY et al. | 7
TA B L E 3 Parameter estimates in top-ranked candidate models associated with Leptospira spp. and Escherichia coli carriage in urban rats in
Chicago
Pathogen Model Term Estimate SE Pr (>|z|) Odds Ratio (95% C.I.)
Leptospira Sanitation Intercept −5.15 1.13 4.77 x 10⁻⁶ 5.81 x 10⁻³ (6.41 x 10⁻⁴–5.28 x 10⁻²)
spp. and SES
Income −1.13 0.88 0.20 0.32 (0.06–1.81)
Water complaints 0.51 0.63 0.41 1.67 (0.49–5.67)
Income*Water complaints 1.91 0.75 0.01 6.74 (1.54–29.39)
E. coli Global Intercept −2.42 0.77 1.75 x 10⁻³ 0.09 (0.02–0.40)
Sex (Male) −1.62 0.58 5.14 x 10⁻³ 0.20 (0.06–0.62)
Reproductive 0.85 0.55 0.12 2.34 (0.79–6.94)
–3
Season (Spring) 2.77 0.87 1.48 x 10 15.96 (2.90–88.62)
Trap success −0.41 0.38 0.28 0.66 (0.31–1.40)
–3
Food inspections 2.30 0.75 2.30 x 10 9.94 (2.27–43.50)
Median income −0.64 0.38 0.09 0.52 (0.25 – 1.09)
Proportion failed −4.86 6.61 0.46 7.75 x 10⁻³ (1.83 x 10⁻⁸–3.28 x 10³)
inspections
Injuries 0.66 0.60 0.27 1.94 (0.60–6.33)
Food Inspections*Income −1.33 0.57 2.07 x 10⁻² 0.26 (0.09–0.82)
Trap success*Inspections −0.16 0.36 0.68 0.85 (0.39–1.85)
contained only spatial variables, we predicted the probability of (stx2) genes) that are associated with pathogenic E. coli strains.
Leptospira spp. infection for an individual rat trapped in any Chicago The global model best explained variation in rat E. coli carriage
community area based on the number of standing water complaints, (Table 2). Rats were significantly more likely to carry E. coli if they
income, and their interaction. Probability of infection ranged from were trapped on blocks with more food inspections (OR = 9.94,
.25 between communities (Figure 3). 2.27–43.50; Table 3). The interaction between food inspections
Of the 41 E. coli isolates that were successfully sequenced, we and income was also significant, such that the probability of E. coli
detected 25 unique serovars (Table 1). None of the E. coli serovars carriage was higher with food vendors in lower-income commu-
contained major virulence factors (e.g., Shiga toxin 1 (stx1) or 2 nity areas (OR = 0.26, 0.09–0.82; Figure 4). Rats were also signifi-
cantly more likely to carry E. coli in the spring (OR spring = 15.96,
2.90–88.62; sample prevalence in spring =39%, fall =8%) or if they
were female (OR males = 0.20, 0.06–0.62; female =27%, male
=15%).
4 | D I S CU S S I O N
In this study, we quantified the prevalence of several environmen-
tally transmitted rat-associated zoonotic pathogens across diverse
neighbourhoods in Chicago, a large city where concern about rats
is growing. We confirmed that rats in Chicago carry pathogenic
Leptospira spp. and diverse serotypes of E. coli. Both pathogens
were associated with poor sanitation and had opposing relationships
with socioeconomic status, such that the likelihood of exposure to
zoonotic bacteria varies by community based on income. We were
more likely to detect Leptospira spp. in higher-income areas with
F I G U R E 2 Interaction between the probability of Leptospira standing water issues. Conversely, we were more likely to detect
spp. carriage in Chicago rats, standing water complaints in the
E. coli in lower-income areas with higher densities of food vendors.
alley of capture, and median household income. Dashed and solid
Our results demonstrate the importance of public sanitation data
lines represent mean estimates of the probability of Leptospira
spp. carriage at varying income levels. Shaded bands show 95% and incorporating diverse urban areas in pathogen surveillance to
confidence intervals predict zoonotic disease risks across cities.8 | MURRAY et al.
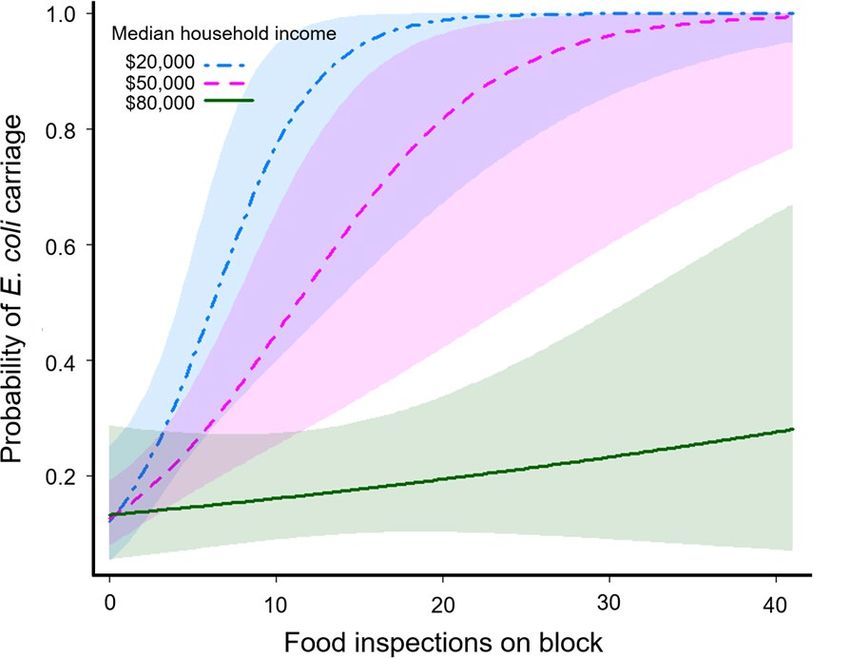
F I G U R E 3 Map of Chicago community
areas shaded by predicted probability
of Leptospira spp. in urban rats based
on standing water complaints, median
household income, and their interaction
in the top performing model. The 13
community areas where rats were
sampled are labelled with initials
corresponding to Table 1
Contact with water sources contaminated with Leptospira
spp. from rat urine, either through recreational or occupational
exposure, is a common route of transmission for Leptospirosis
(Mwachui, Crump, Hartskeerl, Zinsstag, & Hattendorf, 2015). In
Chicago, the positive relationship between rat Leptospira spp. in-
fection and standing water complaints in higher-income areas high-
lights public health concerns in urban alleys with poor drainage.
Potential for exposure to Leptospira spp. in alleys is not unique
to Chicago. For instance, Vinetz et al. (1996) similarly suspected
Leptospirosis transmission to involve contact with rat urine in
urban alleys in Baltimore, MD. In addition to humans, domestic
dogs can contract Leptospirosis from contact with contaminated
water (White et al., 2017), and so alleys with enough standing water
to warrant complaints may be hotspots for transmission between
people, domestic animals, and wildlife. In fact, the prevalence of
Leptospira spp. infection has been increasing for Chicago dogs F I G U R E 4 Relationships between the probability of Escherichia
coli carriage in rats in Chicago and the interaction between food
(White et al., 2017), suggesting a potential concomitant increase in
inspections on the block of capture and median household income.
exposure for urban residents. In these instances, mitigation efforts
Dashed and solid lines represent mean estimates of the probability
might aim to identify and resolve standing water issues to minimize of E. coli carriage at varying income levels. Shaded bands show 95%
Leptospira spp. risk. confidence intervalsMURRAY et al. | 9 The mechanisms supporting the unanticipated interaction in E. coli risk with income may be a symptom of the growing dispar- between standing water and higher incomes for Leptospira spp. ities in income and investment between Chicago neighbourhoods infection is less clear. Leptospirosis is typically associated with (Theodos, Hangen, Meixell, & Rajasekaran, 2019). Addressing these urban slums (Hagan et al., 2016) and so we predicted, as in other inequities and the challenges faced by lower-income food vendors studies (Ayral et al., 2015), that economically disadvantaged com- may mitigate these health risks exacerbated by rat activity. munities are more likely to be at risk of rat-associated zoonoses. Unlike the aforementioned factors, we did not find an associa- This hypothesized link between socioeconomic status and public tion between rat abundance and E. coli or Leptospira spp. prevalence, health risks from rats is complex but likely related to higher en- suggesting environmental exposure may be more important than vironmental exposure or fewer resources to mitigate rat infesta- density-dependent transmission. Previous work has also suggested tions. Contrary to our predictions, alleys with standing water in that rats are exposed to E. coli from the local environment and act high-income neighbourhoods had an order of magnitude higher as “pathogen sponges” (Himsworth et al., 2015). Exposure to a wide likelihood of Leptospira spp. in rats relative to lower-income neigh- variety of pathogen sources in the urban environment, such as gar- bourhoods. The importance of spatial predictors for Leptospira spp. bage, food waste, sewage, and pet waste in alleys, could explain the infection informed our predictions of rat infection risk across the high diversity of E. coli serotypes in Chicago rats (Table 1). city, identifying seven community areas where predicted infection Our results suggest several avenues for future research to pre- risk exceeds 10% (Figure 4). Our results highlight that surveillance dict public health risks from rat infestations. Detection of Leptospira for rat-associated zoonotic pathogens should not be limited to spp. in this study was based on PCR analysis of kidney tissue and was low-income communities. unable to identify the pathogen to species, a common limitation of Municipal sanitation data provided new insights to predict pub- rat studies (Boey, Shiokawa, & Rajeev, 2019). Additional testing to lic health risks from E. coli carriage in rats. Rats were more likely to identify the species and serovar would help advance pathogen ecol- carry E. coli on blocks with higher numbers of food vendors, which ogy in urban environments. Our analysis also does not determine may represent areas with greater rat attractants from food waste active shedding of leptospires in urine. However, the load of lepto- (Silvennoinen et al., 2015), potentially aggregating rats. None of the spires in rat kidneys and urine are highly correlated (Costa, Wunder, E. coli serovars we detected contained major virulence factors and et al., 2015). To more accurately infer risk of transmission, future thus are not cause for concern regarding human disease. However, studies could quantify leptospires in water samples from urban al- the relationships we found between food inspections and E. coli in- leys (Ganoza et al., 2006) and quantify the amount of Leptospira spp. fection in rats is of interest for public health because food vendors present in rat tissues, for example using qPCR. It is also worth noting represent locations where opportunities for food contamination that standing water complaints may not accurately reflect the ex- and spatial overlap between rats and humans are high. Although tent of standing water throughout the study area and the number the E. coli serovars we detected pose low risk for human disease, of complaints may overestimate the number of standing water bod- and we found very low prevalence of other food-borne pathogens ies in high-income neighbourhoods. Future studies should consider Salmonella enterica and Campylobacter spp., management strategies accounting for this by performing field visits to compare reported could emphasize proper containment of food waste to minimize rat environmental features to observations. Future work could also elu- attractants and risk of food contamination (Murray et al., 2018). cidate the mechanisms driving the higher prevalence of E. coli we Contrary to our predictions, we found no relationship for food detected in the spring trapping season. This pattern may be due to vendors with rodent-associated sanitation complaints, potentially higher ambient temperatures facilitating E. coli persistence in the en- because all food vendors produce food waste or because rodent vironment (Van Elsas et al., 2011) or based on other aspects of rat life concerns included mice. history because of the significant differences in carriage between We found the highest prevalence of E. coli near food vendors males and females. in low-income neighbourhoods. Restaurants in lower-income neigh- In this study, we highlighted municipal sanitation data as an bourhoods may pose additional risks for rat-associated pathogens important predictor to identify areas where rats are more likely if there are fewer resources available for decontamination, rodent to carry environmentally transmitted zoonotic pathogens. The control, or waste management. Although disparities in infectious dis- increase in E. coli carriage with increased food inspections is es- ease with socioeconomic status are complex (Gibney & Leder, 2019), pecially concerning because these areas promote spatial overlap previous work has detected increased risk of food-borne illness with between rats and humans. Socioeconomic status was also import- lower incomes (Jalava, Ollgren, Eklund, Siitonen, & Kuusi, 2011). ant in predicting rat infection risk and yielded opposing relation- This risk can be partially caused by access to food vendors; previ- ships between income, sanitation, and likelihood of infection for ous studies have found increased bacterial contamination (Koro, Leptospira spp. and E. coli. Both types of data represent an accessi- Anandan, & Quinlan, 2010) on produce from vendors in low-income ble method to predict risks from rats over large and diverse urban areas. Food vendors in low-income areas may have fewer resources areas. Advances such as these in identifying the contexts where to mitigate rodent infestations because they are often challenged urban residents are exposed to pathogens in rat excreta will help with lower revenue and higher costs associated with security and municipalities devise and deploy effective public health mitigation employee retention (Mauer et al., 2006). The patterns we observed strategies around the world.
10 | MURRAY et al.
AC K N OW L E D G E M E N T S Service-Reques ts/311-Service-Reques ts-Sanit a tion-Code-Compl
aints-No/rccf-5427
We thank Matthew Mulligan, Gabriella Barnas, and the staff of
CMAP (2017). Community Data Snapshots http://www.cmap.illinois.gov/
Landmark Pest Management for their assistance with data collec- data/community-snapshots
tion. We acknowledge the Office of Regulatory Science Division Combs, M., Puckett, E. E., Richardson, J., Mims, D., & Munshi-South, J.
of Microbiology at FDA CFSAN for performing whole-genome se- (2018). Spatial population genomics of the brown rat (Rattus nor-
quencing. We thank Julie Kase at FDA CFSAN for assistance in char- vegicus) in New York City. Molecular Ecology, 27, 83–98. https://doi.
org/10.1111/mec.14437
acterizing E. coli virulence. We also thank Wyoming State Veterinary
Costa, F., Hagan, J. E., Calcagno, J., Kane, M., Torgerson, P., Martinez-
Lab students Hannah Peterson, Hannah Looman, and Gunnar Silveira, M. S., … Ko, A. I. (2015). Global morbidity and mortality of
Malmstrom for their effort on culture setups and DNA extractions. Leptospirosis: A systematic review. PLoS Neglected Tropical Diseases,
9(9), 1–19. https://doi.org/10.1371/journal.pntd.0003898
Costa, F., Wunder, E. A., de Oliveira, D., Bisht, V., Rodrigues, G., Reis, M.
C O N FL I C T O F I N T E R E S T S
G., … Childs, J. E. (2015). Patterns in Leptospira shedding in Norway
The authors declare no conflicts of interest. rats (Rattus norvegicus) from Brazilian slum communities at high risk
of disease transmission. PLoS Neglected Tropical Diseases, 9(6), 1–14.
E T H I C A L A P P R OVA L https://doi.org/10.1371/journal.pntd.0003819
Dupouey, J., Faucher, B., Edouard, S., Richet, H., Kodjo, A., Drancourt,
All rats were captured as part of ongoing pest management by a pri-
M., & Davoust, B. (2014). Human leptospirosis: An emerg-
vate company and so this study was exempt from IACUC Approval. ing risk in Europe? Comparative Immunology, Microbiology and
Infectious Diseases, 37(2), 77–83. https://doi.org/10.1016/j.
ORCID cimid.2013.12.002
Feldgarden, M., Brover, V., Haft, D. H., Prasad, A. B., Slotta, D. J.,
Maureen H. Murray https://orcid.org/0000-0002-2591-0794
Tolstoy, I., … Klimke, W. (2019). Validating the AMRFINder tool
Mason Fidino https://orcid.org/0000-0002-8583-0307 and resistance gene database by using antimicrobial resistance
Kaylee A. Byers https://orcid.org/0000-0003-4008-4416 genotype-phenotype correlations in a collection of isolates.
Antimicrobial Agents and Chemotherapy, 63(11), 1–19. https://doi.
org/10.1128/AAC.00483-19
REFERENCES
Feng, A. Y. T., & Himsworth, C. G. (2014). The secret life of the city rat:
Aplin, K., Chesser, T., & Have, J. (2003). Evolutionary biology of the genus
A review of the ecology of urban Norway and black rats (Rattus nor-
Rattus: Profile of an archetypal rodent pest. In G. Singleton, L. Hinds,
vegicus and Rattus rattus). Urban Ecosystems, 17(1), 149–162. https://
C. Krebs, & D. Spratt (Eds.), Rats, mice and people: Rodent biology and
doi.org/10.1007/s11252-013-0305-4
management (pp. 487–498). Canberra, ACT: Australian Centre for
Ganoza, C. A., Matthias, M. A., Collins-Richards, D., Brouwer, K. C.,
International Agricultural Research.
Cunningham, C. B., Segura, E. R., … Vinetz, J. M. (2006). Determining
Asante-Muhammad, D. (2017). Racial wealth divide in Chicago. In Racial
risk for severe leptospirosis by molecular analysis of environmental
Wealth Divide Initiative. Chicago:CFED. https://prosperitynow.org/
surface waters for pathogenic Leptospira. PLoS Medicine, 3(8), 1329–
files/resources/Racial_Wealth_Divide_in_Chicago_OptimizedforScr
1340. https://doi.org/10.1371/journal.pmed.0030308
eenReaders.pdf
Gibney, K. B., & Leder, K. (2019). Socioeconomic disparities and infec-
Ayral, F., Artois, J., Zilber, A. L., Widén, F., Pounder, K. C., Aubert, D., …
tion: It's complicated. The Lancet Infectious Diseases, 19(2), 116–117.
Artois, M. (2015). The relationship between socioeconomic indices
https://doi.org/10.1016/S1473-3099(18)30511-5
and potentially zoonotic pathogens carried by wild Norway rats: A
Guenther, S., Bethe, A., Fruth, A., Semmler, T., Ulrich, R. G., Wieler,
survey in Rhône, France (2010–2012). Epidemiology and Infection,
L. H., & Ewers, C. (2012). Frequent combination of antimicrobial
143(3), 586–599. https://doi.org/10.1017/S0950268814 001137
multiresistance and extraintestinal pathogenicity in Escherichia
Bharti, A. R., Nally, J. E., Ricaldi, J. N., Matthias, M. A., Diaz, M. M.,
coli isolates from urban rats (Rattus norvegicus) in Berlin,
Lovett, M. A., … Vinetz, J. M. (2003). Leptospirosis: A zoonotic dis-
Germany. PLoS One, 7(11), e50331. https://doi.org/10.1371/journ
ease of global importance. The Lancet, 3(12), 757–771. https://doi.
al.pone.0050331
org/10.1016/S1473-3099(03)00830-2
Hagan, J. E., Moraga, P., Costa, F., Capian, N., Ribeiro, G. S., Wunder, E.
Boey, K., Shiokawa, K., & Rajeev, S. (2019). Leptospira infection in rats:
A., … Ko, A. I. (2016). Spatiotemporal determinants of urban lepto-
A literature review of global prevalence and distribution. PLoS
spirosis transmission: Four-year prospective cohort study of slum
Neglected Tropical Diseases, 13(8), 1–24. https://doi.org/10.1371/
residents in Brazil. PLoS Neglected Tropical Diseases, 10(1), e0004275.
journal.pntd.0007499
https://doi.org/10.1371/journal.pntd.0004275
Burnham, K. P., & Anderson, D. R. (2002). Model selection and multi-model
Himsworth, C. G., Bidulka, J., Parsons, K. L., Feng, A. Y. T., Tang, P.,
inference: A practical information-theoretic approach, 2nd. ed. Berlin,
Jardine, C. M., … Patrick, D. M. (2013). Ecology of Leptospira interro-
Germany: Springer-Verlag.
gans in Norway rats (Rattus norvegicus) in an inner-city neighborhood
Byers, K., Lee, M. J., Patrick, D. M., & Himsworth, C. G. (2019). Rats about
of Vancouver. Canada. Plos Neglected Tropical Diseases, 7(6), e2270.
town: A systematic review of rat movement in urban ecosystems.
https://doi.org/10.1371/journal.pntd.0002270
Frontiers in Ecology and Evolution, 7, 1–22. https://doi.org/10.3389/
Himsworth, C. G., Parsons, K. L., Jardine, C., & Patrick, D. M. (2013). Rats,
fevo.2019.00013
cities, people, and pathogens: A systematic review and narrative syn-
Chicago Department of Public Health (2020). Restaurant and Food Service
thesis of literature regarding the ecology of rat-associated zoonoses
Inspection Reports. Healthy Chicago, https://www.chicago.gov/city/
in urban centers. Vector-Borne and Zoonotic Diseases, 13(6), 349–359.
en/depts/cdph/provdrs/healthy_restaurants/svcs/restaurant_food_
https://doi.org/10.1089/vbz.2012.1195
inspec tion.html
Himsworth, C. G., Patrick, D. M., Mak, S., Jardine, C. M., Tang, P., &
City of Chicago (2020). 311 Service Requests - Sanitation Code Complaints
Scott Weese, J. (2014). Carriage of Clostridium difficile by wild urban
- No Duplicates. Chicago Data Portal, https://data.cityofchicago.org/
Norway rats (Rattus norvegicus) and black rats (Rattus rattus). AppliedMURRAY et al. | 11
and Environmental Microbiology, 80(4), 1299–1305. https://doi. RStudio Team. (2016). RStudio: Integrated Development for R vol 1.1.453.
org/10.1128/AEM.03609-13 RStudio, Inc. http://www.rstudio.com/
Himsworth, C. G., Zabek, E., Desruisseau, A., Parmley, E. J., Reid-Smith, Silvennoinen, K., Heikkilä, L., Katajajuuri, J. M., & Reinikainen, A.
R., Jardine, C. M., … Patrick, D. M. (2015). Prevalence and character- (2015). Food waste volume and origin: Case studies in the Finnish
istics of Escherichia coli and Salmonella spp. in the feces of wild urban food service sector. Waste Management, 46, 140–145. https://doi.
Norway and black rats (Rattus norvegicus and Rattus rattus) from an org/10.1016/j.wasman.2015.09.010
inner-city neighborhood of Vancouver, Canada. Journal of Wildlife Souvorov, A., Agarwala, R., & Lipman, D. J. (2018). SKESA: Strategic
Diseases, 51(3), 589–600. https://doi.org/10.7589/2014-09-242 k-mer extension for scrupulous assemblies. Genome Biology, 19(1),
Jalava, K., Ollgren, J., Eklund, M., Siitonen, A., & Kuusi, M. (2011). 1–13. https://doi.org/10.1186/s13059-018-1540-z
Agricultural, socioeconomic and environmental variables as Theodos, B., Hangen, E., Meixell, B., & Rajasekaran, P. (2019).
risks for human verotoxigenic Escherichia coli (VTEC) infec- Neighborhood disparities in investment flows in Chicago (Issue May).
tion in Finland. BMC Infectious Diseases, 11(1), 275. https://doi. https://www.urban.org/sites/d efaul t/files/p ublic atio n /100261 /
org/10.1186/1471-2334-11-275 neighborhood_disparities_in_investment_flows_in_chicago_1.pdf
Koro, M. E., Anandan, S., & Quinlan, J. J. (2010). Microbial quality of United States Census Bureau (2017). QuickFacts: Chicago, Illinois, https://
food available to populations of differing socioeconomic status. www.census.gov/quickfacts/chicagocityillinois
American Journal of Preventive Medicine, 38(5), 478–481. https://doi. Van Elsas, J. D., Semenov, A. V., Costa, R., & Trevors, J. T. (2011). Survival
org/10.1016/j.amepre.2010.01.017 of Escherichia coli in the environment: Fundamental and public health
Mauer, W. A., Kaneene, J. B., DeArman, V. T., Roberts, C. A., Miller, R. aspects. The ISME Journal, 5(2), 173–183. https://doi.org/10.1038/
A., Pong, L., & Dickey, T. E. (2006). Ethnic-food safety concerns: An ismej.2010.80
online survey of food safety professionals. Journal of Environmental Vinetz, J., Glass, G., Flexner, C., Mueller, P., & Kaslow, D. (1996). Sporadic
Health, 68(10), 32–38. urban leptospirosis. Annals of Internal Medicine, 125(10), 794–798.
Murray, M. H., Fyffe, R., Fidino, M., Byers, K. A., Ríos, M. J., Mulligan, M. https://doi.org/10.7326/0003-4819-125-10-199611150-00002
P., & Magle, S. B. (2018). Public complaints reflect rat relative abun- White, A. M., Zambrana-Torrelio, C., Allen, T., Rostal, M. K., Wright, A. K.,
dance across diverse urban neighborhoods. Frontiers in Ecology and Ball, E. C., … Karesh, W. B. (2017). Hotspots of canine leptospirosis in
Evolution, 6, 189. https://doi.org/10.3389/fevo.2018.00189 the United States of America. Veterinary Journal, 222, 29–35. https://
Mwachui, M. A., Crump, L., Hartskeerl, R., Zinsstag, J., & Hattendorf, J. doi.org/10.1016/j.tvjl.2017.02.009
(2015). Environmental and behavioural determinants of leptospirosis Wolfram Alpha. (2000). Chicago weather over time. Retrieved January
transmission: A systematic review. PLoS Neglected Tropical Diseases, 2, 2020, from https://www.wolframalpha.com/input/?i=chica
9(9), 1–15. https://doi.org/10.1371/journal.pntd.0003843 go+weather+over+time
National Microbiology Laboratory (2019). ectyper (0.8.1). https://github.
com/phac-nml/ecoli_serot yping
Nelson, M., Jones, S. H., Edwards, C., & Ellis, J. C. (2008). Characterization S U P P O R T I N G I N FO R M AT I O N
of Escherichia coli populations from gulls, landfill trash, and waste- Additional supporting information may be found online in the
water using ribotyping. Diseases of Aquatic Organisms, 81(1), 53–63.
Supporting Information section.
https://doi.org/10.3354/dao01937
Palaniappan, R. U. M., Chang, Y. F., Chang, C. F., Pan, M. J., Yang, C.
W., Harpending, P., … Roe, B. (2005). Evaluation of lig-based con-
ventional and real time PCR for the detection of pathogenic lep- How to cite this article: Murray MH, Fidino M, Fyffe R, et al.
tospires. Molecular and Cellular Probes, 19(2), 111–117. https://doi. City sanitation and socioeconomics predict rat zoonotic
org/10.1016/j.mcp.2004.10.002
infection across diverse neighbourhoods. Zoonoses Public
QGIS Development Team (2020). QGIS Geographic Information System.
Open Source Geospatial Foundation Project, http://qgis.osgeo.org Health. 2020;00:1–11. https://doi.org/10.1111/zph.12748
Rael, R. C., Peterson, A. C., Ghersi, B. M., Childs, J., & Blum, M. J.
(2016). Disturbance, reassembly, and disease risk in socioecolog-
ical systems. EcoHealth, 13, 450–455. https://doi.org/10.1007/
s10393-016-1157-1You can also read