Investor presentation - Third quarter 2020 November - December 2020 - bpost Group

Page created by Oscar Sharp
 
CONTINUE READING
Investor presentation - Third quarter 2020 November - December 2020 - bpost Group
Investor presentation
    Third quarter 2020
     November – December
            2020
Investor presentation - Third quarter 2020 November - December 2020 - bpost Group
Investor presentation
Third quarter 2020

Contents                                                                                                                                                                             Financial Calendar
Highlights & guidance                                       3Q20 results                                            YTD20 results                                                    08.12.2020 (10:30 CET)
3Q20 Highlights – 4                                         EBIT bridge – 39                                        EBIT bridge – 53                                                 Strategy update and capital allocation
Outlook 2020 – 5                                            Key financials – 40                                     Key financials – 54
                                                            Results by segment – 41                                 Results by segment – 55                                          09.03.2021 (17:45 CET)
bpost group at a glance                                     Mail & Retail – 42 & 43                                 Cash flow – 56                                                   Annual results 2020
Investment rationale – 7                                    Parcels & Logistics Eurasia – 44 & 45
Dividend policy – 8                                         Parcels & Logistics N. America – 46 & 47                Additional Info                                                  05.05.2021 (17:45 CET)
Overview – 9                                                Corporate – 48                                          Key financials FY19 – 58                                         Quarterly results 1Q21
LT vision & strategic aspirations – 10                      Cash flow – 49                                          Results by segment FY19 – 59
Management – 11                                             Balance sheet – 50                                      Relationship with State – 60
Sustainability – 12-14                                      Financing Structure & Liquidity – 51                    USO & SGEI – 61
Mail & Retail – 15-23                                                                                               European mail market – 62
Parcels & Logistics Eurasia – 24-32                                                                                 Key contact – 63                                                 More on corporate.bpost.be/investors
Parcels & Logistics N. America – 33-37

    Disclaimer
    This presentation is based on information published by bpost group in its Third Quarter 2020 Interim Financial Report made available on November 3rd, 2020 at 5.45pm CET and in its 2019 Annual Report available on corporate.bpost.be/investors. This
    information forms regulated information as defined in the Royal Decree of November 14th, 2007. The information in this document may include forward-looking statements1, which are based on current expectations and projections of management about future
    events. By their nature, forward-looking statements are not guarantees of future performance and involve known and unknown risks, uncertainties, assumptions and other factors because they relate to events and depend on circumstances that will occur in the
    future whether or not outside the control of the Company. Such factors may cause actual results, performance or developments to differ materially from those expressed or implied by such forward-looking statements. Accordingly, no assurance is given that
    such forward-looking statements will prove to have been correct. They speak only as at the date of the Presentation and the Company undertakes no obligation to update these forward-looking statements contained herein to reflect actual results, changes in
    assumptions or changes in factors affecting these statements. This material is not intended as and does not constitute an offer to sell any securities or a solicitation of any offer to purchase any securities.
1   as defined among others under the U.S. Private Securities Litigation Reform Act of 1995

2                                                                                                                    3Q20 Roadshow presentation
Investor presentation - Third quarter 2020 November - December 2020 - bpost Group
Highlights 3Q20
Guidance 2020
Investor presentation - Third quarter 2020 November - December 2020 - bpost Group
Highlights of 3Q20                                                                                                                                  3Q20

Strong e-commerce driven performance in PaLo Eurasia and North America
further accelerates the mix shift and drives 2020 outlook upgrade

                                                                                                                         2020 group
    Group operating    Mail & Retail                    Parcels & Logistics             Parcels & Logistics              adjusted EBIT
    income                                              Eurasia                         N. Am.                           at least € 270m
    € 972.9m           € 35.7m                          € 29.7m                         € 8.7m                           including
    up 10.4%           7.7% EBIT margin                 11.3% EBIT margin               2.9% EBIT margin                 ransomware
                       • Total operating income at      • Total operating income at     • Total operating income at      attack
                         € 463.7m (-4.6%) driven by       € 263.1m (+32.7%) driven        € 295.9m (+22.6%) driven
                         COVID-19 impact on retail        by thriving e-commerce          by continued strong
                         and by deconsolidation of        both domestically (Parcels      momentum in E-commerce
                         Alvadis                          BeNe +33.1%) and abroad         logistics                      S&P reaffirms
                                                          (Cross-Border +36.0%)
                       • Underlying mail volume                                         • Adjusted EBIT increase         the long- &
    Group adjusted       decline proving resilient at   • Parcels B2X organic             (€ +14.0m) mainly driven by
                                                                                                                         short-term
    EBIT                 -8.2% and better than pre-       volumes +49.0% from             operating leverage in
                         COVID-19 guided -9 to            continued strong e-             E-commerce logistics           credit rating at
    € 69.5m              -11% range                       commerce development          • Following ransomware
                                                                                                                         A/A-1, outlook
    up 81.5%           • Limited adjusted EBIT          • Adjusted EBIT up € +19.4m       attack on Radial NA on Oct.
    7.1% EBIT margin
                         decline (€ -2.7m) driven by      and nearly tripling. Strong     15th, 2020, Radial has         stable
                         stellar growth in parcel         margin improvement driven       managed to regain sufficient
                         volumes handled through          by stellar growth in parcel     functionality to restart       Note: COVID-19 impacts not
                         the mail network for PaLo        volumes handled through         fulfilment operations at all   separately disclosed as
                                                                                                                         increasingly artificial and less
                         Eurasia                          the mail network                locations                      meaningful

4                                                       3Q20 Roadshow Presentation
Investor presentation - Third quarter 2020 November - December 2020 - bpost Group
2020 group EBIT outlook revised upwards                                                                                                                                  Outlook FY20

    Group                                                                                           Dividend
    FY20 group adjusted EBIT can be revised upwards to at least € 270m, including                   The updated capital allocation framework, including new dividend policy, will be
    the estimated financial impact of the ransomware attack at Radial North                         communicated to the market on December 8th, 2020.
    America. Due to the second wave of the pandemic and lockdown measures
    taken, the visibility for 4Q20 is however limited.

    Contribution per Business Unit will differ from the initial outlook issued in March.

    Gross capex of € 150m maximum (vs. up to € 200m pre-COVID-19)

    COVID-19 disclaimer
    Given ongoing limited visibility about the duration and severity of the pandemic and its different impacts across the globe, the revised outlook could still be impacted by
    these uncertainties or any event deriving thereof.

5                                                                                 3Q20 Roadshow Presentation
Investor presentation - Third quarter 2020 November - December 2020 - bpost Group
bpost group
at a glance
Investor presentation - Third quarter 2020 November - December 2020 - bpost Group
bpost group offers a strong investment rationale                                                                              at a glance – group

bpost group aims at being a responsible company, delivering sustainable returns to its shareholders

What?                                          How?
    We continue to transform the mail and       Multiple levers for            Experienced            Growth in           A solid balance
    proximity business in the home market to    transformation of              management             e-commerce          sheet with single
    sustain solid cashflows                     the legacy                     team with              logistics &         'A' credit rating
                                                business: natural              embedded               parcels: aspired
                                                attrition,                     financial discipline   sizeable share of
                                                alternating                    and a strong           revenues
                                                distribution                   business
                                                model, stable and              transformation
                                                predictable                    track record
    We develop sustainable activities in the    regulation,
    high growth e-commerce logistics &          network
    parcels business in our                     optimization,…
    Belgium/Netherlands home market and
    key geographies in Europe and North
    America

7                                                            3Q20 Roadshow presentation
Investor presentation - Third quarter 2020 November - December 2020 - bpost Group
We create value for shareholders                                                                                                                                         at a glance – group

Capital allocation and dividend policy are under review with new policy to be communicated on Dec. 8th, 2020

    Dividend Policy
    • IPO dividend policy until 2019: Minimum 85% of BGAAP net profit of the
      mother company bpost SA/NV (unconsolidated). This policy is now
      suspended.
    • Dividend on FY19 results limited to interim dividend due to COVID-19 crisis
    • Board will recommend not to grant a dividend on FY20 results to preserve                                            1.26      1.29                 1.31   1.31   1.31
      the strength of bpost’s balance sheet, cash reserves and capacity to invest on                         1.13
                                                                                                                          0.22      0.24             0.25       0.25   0.25
      the long term.                                                                                     0.20
    • Updated dividend policy: A new dividend policy will be decided by the Board
      when the longer-term impact of the COVID-19 crisis becomes clear.                                                                                                             0.62
                                                                                                                          1.04      1.05             1.06       1.06   1.06
                                                                                                         0.93

    Dividend is constrained by net results of a given year
    (in BGAAP) + distributable reserves                                                                  2013             2014      2015             2016       2017   2018        2019

                                                                                                                                        Pay-out ratio
    Distributable reserves (€ 199m end 2019)                                                             91%              85%       90%              85%        90%    100%        72%
    built gradually as from 2013, primarily to neutralize the non-recurring impact of
    exceptional costs                                                                                   Final gross DPS (€)      Interim gross DPS (€)

8                                                                               3Q20 Roadshow presentation
Investor presentation - Third quarter 2020 November - December 2020 - bpost Group
A diversified mail operator with a footprint in                                                                                                                                                     at a glance – group

e-commerce logistics
                                                                                                                                                                                         Revenues        % of total

€ 3,837.2m1                                € 310.8m
                                                                                                                                              Transactional mail                         € 748m             19%
                                                                                              Mail & Retail                                   Advertising mail                           € 236m             6%
revenues                                   8.1%                                               € 1,897m
                                           EBIT                                               49%                                             Press                                      € 344m             9%

                                                                                                                                              Proximity and convenience retail network   € 465m             12%

€ 537.0m                                   € 181.2m                                                                                           Value added services                       € 104m             3%
14.0%                                      net profit
EBITDA                                                                                        Parcels & Logistics                             Parcels Be-Ne                              € 381m             10%

                                                                                              Europe & Asia                                   E-commerce logistics                       € 133m             3%

35,377                                                                                        € 813m
                                                                                              21%                                             Cross-border                               € 300m             8%
average
# FTE & interims
                                                                                              Parcels & Logistics
                                                                                                                                              E-commerce logistics                       € 1,018m          26%
                                                                                              North America
                                                                                              € 1,098m                                        International mail                          € 87m             2%
                                                                                              29%

2019 figures (adjusted)
1 49.4% Mail & Retail, 21.2% Parcels & Logistics Europe & Asia, 28.6% Parcels & Logistics North America and 0.8% Corporate revenue

9                                                                                                                3Q20 Roadshow presentation
Investor presentation - Third quarter 2020 November - December 2020 - bpost Group
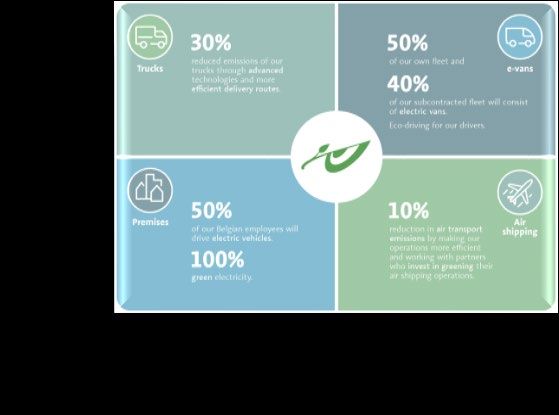
Long-term vision & strategic aspirations                                                       at a glance – group

     ”Beyond mail, be an efficient global e-commerce logistics player anchored in Belgium”

     1                               2                                    3
     Mail services to citizens and   Drive profitable growth in           Optimize Radial to deliver in
     State remain core and will      Parcels BeNe and further             the promising North
     continue to generate profit     develop e-commerce logistics         American e-commerce
     with a more adapted             in Europe                            market
     distribution model

10                                           3Q20 Roadshow presentation
Our experienced management team has                                                                                            at a glance – group

responsibilities down to the bottom-line

     Jean-Paul Van Avermaet     Luc Cloet                                 Kathleen Van Beveren                  Henri de Romrée
            Group CEO          CEO Mail & Retail                      CEO Parcels & Logistics Europe & Asia   CEO Parcels & Logistics North
                                                                                                                       America

         Mark Michiels        Leen Geirnaerdt                                   Dirk Tirez                         Nico Cools
              CHRO                    CFO                                           CLO                                  CIO

11                                                 3Q20 Roadshow presentation
Sustainability is at the heart of our activities                                                                                                                              at a glance – group

3-pillar CSR strategy linked to United Nations

       People                          Proximity               Planet                                        Selected awards and recognition
       we care about our               we are close to the     we strive to reduce our
       employees and engage            society                 impact on the                                 •   IPC EMMS Scorecard 2019 (sector index): #3
       them                                                    environment                                   •   EcoVadis (clients index): Gold rating
                                                                                                             •   Ethibel Indexes: reconfirmed as a constituent of the Ethibel Sustainability Index
                                                                                                                 (ESI) Excellence Europe since 19/03/2018

     Shared Value Creation                                                                                   •
                                                                                                             •
                                                                                                                 Sustainalytics: score 17.7% (low risk)
                                                                                                                 MSCI: Score A
     • Continuity of our business                                                                            •   Vigeo Eiris: 91% (sector average: 71%)
     • Employee satisfaction and engagement                                                                  •   ISS: Governance Score: 5, Environment Score: 1, Social Score: 3
     • Customer satisfaction                                                                                 •   Carbon Disclosure Project: Score B (peer average C)

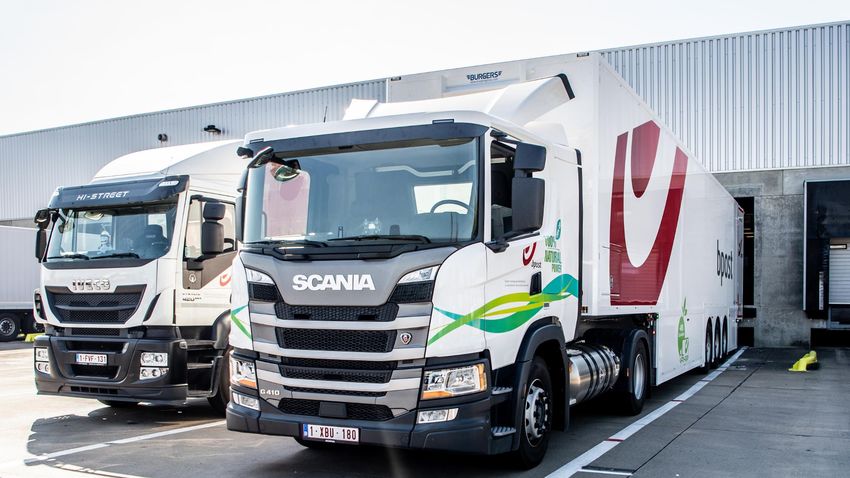
      • Employee health &            • To our community       • Green fleet
        safety                       • To our suppliers       • Green buildings
      • Employee training and
        talent development
                                     • To our customers
                                       through our services
                                                              • Waste management
                                                                                                             Ambitious CO2 reduction targets
      • Ethics & diversity
      • Social dialogue                                                                                      •   Since 2007 bpost group has cut its CO2 emissions by almost 40%
                                                                                                             •   Target of reducing CO2 emissions from activities by at least 20% by 2030
                                                                                                             •   By 2030, at least 50% of vehicles will be fully electric

12                                                                              3Q20 Roadshow presentation
Sustainability, the road to a resilient bpost group                                                                 at a glance – group

                                                                                                    Committed member of
                                                                                                    the Belgian Alliance for
                                                                                                        Climate Action
                                                                                                       12 October 2020
                                                    Science Based                   Bpost group
                             Signing of the             Targets                    Target setting
                              Belgian SDG         Public commitment                  program
                         Charter to keep Global    to set ambitious                                          2020
     CEO engagement to      Warming below               targets
        COP 21 Paris       the 2°C threshold
                                                                                    2018-2019

                                                         2017
           2015                  2016

13                                                    3Q20 Roadshow presentation
Putting People, Planet & Proximity into ESG                                                                             at a glance – group

     Environment                                Social                                    Governance
     Carbon footprint reduction program         COVID response management: ensuring       Materiality assessment: involving our
       • LNG trucks & Double Deck Trailers      our people are safe and protected in      stakeholders in our sustainability
                                                accordance with the latest health &       roadmap
       • Ecozone Mechelen: Low & zero           safety regulations
         emission delivery                                                                —
                                                —                                         Joining the Belgian Alliance for Climate
       • LED lighting implementation
                                                Dual Learning: inclusive program          Change: exchange of best practices with
       • Circular business: recycling more      providing low skilled employees with a    suppliers and clients
         than 10 million kg of e-waste in the   formal diploma
         Netherlands

14                                                           3Q20 Roadshow presentation
Mail & Retail                                                                                                                 at a glance – M&R

at a glance

Sub-segments                               Revenues 2019, €m                                               Key facts & figures
                                                 748
Transactional mail
                                                                                                               ~7.1m
                                                                                                               letters handled daily
                                                            236
Advertising mail
                                                                                                               ~20.1k
                                                                          344                                  operational FTEs
Press

                                                                                       465
                                                                                                               Servicing 5m
Proximity and convenience retail network                                                                       letter boxes

Value added services
                                                                                             104               5
                                                                                                               industrial sorting centers

                                                                                                   1,897
Total                                                                                                          ~2,300
                                                                                                               points of presence in Belgium

15                                                        3Q20 Roadshow presentation
Key value drivers for Mail & Retail                                                                                                             at a glance – M&R

Key value drivers                                                                   From                             To

                  Speed of mail volume decline                                      -7.9%                            Between 9% - 11%
                                                                                    in 2019                          in 2020 (ex-COVID-19)

                  Share of mail volume decline compensated                          18-45%                           >50%1
                  through price increase                                            over 2014-2017

                                                                                    Three contracts                  Extension
                  Renegotiation/retendering of future 6th                                                            of the 2 press concessions until end 2022
                  Management contract and press concessions                         until end 2020;                  Expected extension
                                                                                    compensation contractually set
                                                                                                                     on 6th Management contract

                  Evolution of operating model                                      Fixed D+1                        Flexible,
                  (mail collect and distribution)                                   based model                      differentiated offering
                                                                                    (everywhere, everyday)           (prior vs. non-prior.)
1   58% in 2019

16                                                     3Q20 Roadshow presentation
Domestic mail volume decline expected to accelerate from                                                                                                                          at a glance – M&R

-7.9% in 2019 up to ~-9% to -11% in 2020 (ex-COVID-19 impact)
                                                           2013           2014          2015             2016    2017        2018        20191   YTD20

                                                                                                                                                          Key drivers
       Underlying change                                  -4.2%          -4.4%
       in domestic mail volume
                                                                                       -5.0%             -5.0%   -5.8%      -5.8%
                                                                                                                                         -7.9%            • E-substitution at large
                                                                                                                                                 -12.2%     corporates and SMEs
             Transactional mail                           -3.7%
                                                                         -5.0%
                                                                                                                                                          • Intensifying competition in
                                                                                       -5.3%
                                                                                                                                                            advertising media
                                                                                                         -5.9%              -5.7%
                                                                                                                 -8.1%                   -9.2%
                                                                                                                                                 -11.5%

                                                                                                                 1.5%                                     • Shift to digital for newspapers
                                                                                                                                                            & magazines
                                                                         -3.0%                           -3.0%                           -4.7%
             Advertising mail                                                          -4.9%
                                                                                                                                                          • Service level elasticity
                                                                                                                            -7.2%
                                                           -9.1%

                                                                                                                                                 -18.4%     from the implementation of the
                                                                                                                                                            Alternating Distribution Model

             Press                                        -3.0%          -2.8%         -2.8%             -2.8%
                                                                                                                 -3.7%      -3.8%
                                                                                                                                         -6.5%   -6.2%

1   As of start FY19 Transactional Mail excludes outbound and Press includes Ubiway press distribution

17                                                                                                               3Q20 Roadshow presentation
Regulatory aspects                                                                                                                                                                              at a glance – M&R

       Designated provider of the                                                               4 key contracts with the                                     Postal law of 10 February 2018
       Universal Service Obligation                                                             Belgian State                                                provides stable & predictable
       until end 20231                                                                                                                                       mail pricing framework
       • Collection, sorting, transport and distribution of                                     • Management contract for the provision of the               • Single piece mail & USO parcels falling within
         postal items up to 2kg and single piece postal                                           USO (2019-2023)                                              “small user basket” are subject to a price cap
         packages up to 10kg                                                                    • 6th Management Contract (2016-2020): for the                 • Price cap2 = inflation - (volume evolution +
       • Collect and deliver 5x per week                                                          provision of certain SGEIs, i.e. maintenance of                cost reduction factor x efficiency gains
       • Cover full territory of Belgium for collection and                                       retail network, cash at counter, cash payment of               sharing factor)
                                                                                                  pensions at home
         delivery of items belonging to universal service                                                                                                    • Volume and operational discounts allowed for
       • Apply uniform tariffs and an identical service                                         • 2 press concessions (2016-2020 extended for 2                other USO products (bulk)
                                                                                                  years until end 2022): (1) for distribution of
         across the territory                                                                                                                                • Price increases done in practice on a yearly
                                                                                                  periodicals and (2) for distribution of                      basis: +5.1% on average in 2020 on all domestic
                                                                                                  newspapers                                                   mail items; +6.0% on average for 2021

1   Refer to slide 60 for more details
2   Exact formula: Price cap = health index April n-1/health index April n-2 * (1 - [expected volume decline/(expected volume decline +1)] - 2.8%*33%) - 1

18                                                                                                                     3Q20 Roadshow presentation
New Postal Law                                                    (Effective as of February 10, 2018)
                                                                                                                                                                                                                            at a glance – M&R

provides stable and predictable regulatory framework to
increase prices in context of accelerating mail volume decline
                                                                                                            Drivers of the price cap formula

                                                    Inflation                                                           Volume decline                                                      Efficiency gains
Description                                         Compensation for inflation                                          Compensation for
                                                                                                                        mail volume decline
                                                                                                                                                                                            Mechanism to share 1/3 of the
                                                                                                                                                                                            efficiency gains target
                                                                                                                                                                                            with consumers

Correlation                                         Higher inflation results in                                         Larger mail volume decline results                                  Constant and fixed by law
                                                    larger allowed price increase                                       in larger allowed price increase
to price cap

Calculation                                         Ratio of the health index as                                        [V/(V+1)] with V as the expected                                    Fixed by the law at 0.9%

logic                                               measured in April of the years
                                                    n-1 and n-2
                                                                                                                        negative volume trend on the Small
                                                                                                                        User Basket
                                                                                                                                                                                            (i.e., 1/3 of 2.8% efficiency
                                                                                                                                                                                            gains target)

    Illustrative example assuming 2% inflation and -6% average volume decline:

    Price cap1: 7.6% = 102%                                                                                     x                       [ 106.4%                                        –                0.9% ]
1   Detailed formula: Price cap = (1 + inflation) * (1 - [V/(V+1)] – 0.9%) – 1, giving for the above example the following calculation (1+2%) * (1 – [-6%/(-6%+1)] – 0.9%) - 1 = 7.6%

19                                                                                                                        3Q20 Roadshow presentation
Price increase and mix effects expected to compensate                                                                                                                           at a glance – M&R

>50% of mail volume decline

    Volume and price/mix impact on revenue €m
                                                                                                                                                        Key drivers
          Domestic mail volume      Domestic mail price/mix          %    Share of volume effect compensated by price/mix

                                                                                                                                                        • Accelerating domestic mail
                  72%                     45%                      30%                      31%                       18%                     >50%
                                                                                                                                                          volume decline

                                                                                       68
                                                                                                                 71                                     • New price cap mechanism of
                                                              67
                                     60                                                                                                                   Postal Law defining max price
             57
                                                                                                                                                          increase for small user basket,
                         42                                                                                                                               and serving as guideline for
                                                                                                                                                          price increase on non-price
                                                27
                                                                         20                       21
                                                                                                                                                          capped products
                                                                                                                            13
                                                                                                                                                        • Price increase partly
                                                                                                                                                          offset by shift to less expensive
                  2013                     14                       15                       16                        17                   2018-191      mail products
                                                                                         Price increase on small                 Building on the New
                                                                                         user basket rejected by                 Postal Law for price
1   2018 was at 70%, 2019 was 58%                                                        regulator                               regulated products

20                                                                                                          3Q20 Roadshow presentation
Management has developed an                                                                                           at a glance – M&R

extended set of cost control options

     Operating model         Industrial Mail       Collect &                       Distribution              FTE Unit cost
                             Centers               Transport
     • Differentiated        • Optimize mail       • Align number of red           • Introduce new           • Further optimize FTE
       offering and            sorting centers       boxes to mail                   generation of             mix
       Alternating             footprint             volume decline                  Georoute and time
       Distribution Model    • Pursue continuous   • Stop collect on                 potential
     • Take measures to        improvement           Saturday and                    management
       address absenteeism                           increase flexibility of       • Simplify process for
                                                     pick-up, delivery               selected transactions
                                                     and dispatch timing           • Enhance customer
                                                     constraints                     experience and
                                                   • Transport                       productivity through
                                                     optimization (fill-in           digital (e.g.,
                                                     rate and routes)                consumer
                                                                                     preferences)

21                                                    3Q20 Roadshow presentation
A differentiated offering enables a new distribution                                                                                                                                         at a glance – M&R

model to accommodate changing customer needs

      Differentiated offering                                                              Alternating Distribution Model                          Optimizing drop density
      as of January    1st,   2019                                                         as of mid-March 2020                                    Share of houses receiving mail on any given day, %

                                                                                                                                                                                                   ADM:
      D+1                                                                                           Mail                                                Model until mid-March 2020:
                                                                                                                                                          everywhere, everyday
                                                                                                                                                                                                D+3 combined
                                                                                                                                                                                                  with D+1
      Available to consumers                                                               Adjusted “day certain” distribution
                                                                                                                                                        ~70                                         ~70
      who need D+1 delivery                                                                frequency: in each street, mail will be                                     ~55
Labor cost will benefit from decrease of mail                                                                                                                          at a glance – M&R

related FTEs and optimized employee mix

      Operational FTE evolution1                                                          Age pyramid                                                                  Natural
                                                                                                                                                                       attrition
      Average FTEs and interims, ‘000                                                     Headcount bpost SA/NV per age, 31/12/19
                                                                                                                                                                       Average
                                  18.8            19.3   20.0    20.1                          9,633                    9,739
                                                                                                                                                                       natural attrition
                                                                                                                                    Non pay-scale contractuals
              Allocated
                                                                                                           6,787                                                       is expected to
                                                                                                                                    Pay-scale contractuals
                  to mail                                       80-85%                                                                                                 range from
                                                                                                                                    Civil servants
              Allocated                                                                                                                                                1,200 to 1,300
              to parcels                                                                                                                                               FTEs/year
                                                                15-20%
                                 2016             17     18       19                           0-39       40-49          50+

      Operational FTE mix evolution1                                                      Average cost per contract type1
                                                                                          Indexed
                   Other           8%             10%    10%     9%
                                  18%             17%    17%     16%
            Contractual
                                                                                           Contractual                                                                             ~95
                Auxiliary
                                  34%             39%    42%     47%
                postman
                                                                                              Auxiliary
                                                                                                                                                                 ~74
                                                                                              postman
            Civil servant         39%             35%    31%     28%
                                                                                          Civil servant                                                                                  100
                                   16             17     18       19
1   bpost SA/NV scope, excluding retail network

23                                                                      3Q20 Roadshow presentation
Parcels & Logistics Europe and Asia                                                                             at a glance – PaLo Eurasia

at a glance

Sub-segments           Revenues 2019 (€m)                                                         Key facts & figures
                                                         • Last-mile B2C delivery in the                 Peak days of up to
Parcels BeNe               381                             Benelux                                       530k parcels during COVID-19
                                                         • Total of ~74m parcels in 2019                 lockdown

                                                         • Mostly fulfilment & transport          Fulfilment footprint
                                                           activities in Europe spread over 8
E-commerce logistics              133                      commercial locations
                                                         • Activities include Radial EU, Active
                                                           Ants and DynaFix
                                                                                                  covers over 8 commercial locations
                                                         • International mail & parcels           across 5 countries in Europe
                                          300            • Majority of cross-border volume is
Cross-border
                                                           inbound mail and parcels from          3 main cross-border
                                                           Europe and Asia
                                                                                                  activity centers

Total                                                  813

                                                                                                  i.e. Brussels brucargo, Heathrow UK
                                                                                                  and Hong Kong

24                                      3Q20 Roadshow presentation
Key value drivers for Parcels & Logistics Europe & Asia                                                                                  at a glance – PaLo Eurasia

Sub-segments        Key value drivers                                                  From                                To
     Parcels BeNe   Ability to capture profitable growth in a competitive
                    environment
                                                                                       Volume growth rate of 20-30% with
                                                                                       price/mix effect up to -6% over
                                                                                                                           Double-digit volume growth rate,
                                                                                                                           address price/mix
                                                                                       2016-2018

                    BeNe-wide offering addressing customer requirements                Focus on Belgium (sales force,      BeNe-wide approach
                                                                                       contracts, DHL partnership)

                    Optimized last-mile operations based on parcels                    Parcel hubs where enough density    Flexible parcels distribution
                    characteristics and in line with delivery requirements                                                 footprint in close collaboration with
                                                                                                                           Mail & Retail

     E-commerce     Ability to organically capture market growth of ~10%
                    p.a. (vs. in-sourcing, pan-European players)
                                                                                       E-commerce logistics in PL, NL &
                                                                                       BE and DynaFix
                                                                                                                           Increase scale & skills by leveraging
                                                                                                                           capabilities of Radial US and Active
     logistics                                                                                                             Ants

     Cross-border   Develop international cross-border parcels, also across
                    continents
                                                                                       Natural business evolution          Developing international parcel
                                                                                                                           flows driven by growing
                                                                                                                           e-commerce activity
                    Ability to maintain international mail volume

25                                                                   3Q20 Roadshow presentation
Four strategic initiatives for Parcels BeNe                                                                          at a glance – PaLo Eurasia

                                              Focus on 4 strategic initiatives

     Integrated                 Differentiate                                 Attract key foreign       Convenience
     BeNe offering              pricing policy                                e-commerce players        & Cost leadership
     • Dedicated, specialized   • Strategic pricing initiatives               • Partnerships with       • Increased convenience
       sales force                                                              e-commerce players        through improved receiver
                                                                                                          journey and additional pick-
     • Integrated commercial                                                  • E2E service offering      up drop-off lockers (KPI: Net
       offers                                                                   (“gateway to Europe”)     Promoter Score)
     • Partnership with DHL                                                                             • Flexible distribution footprint
       Parcels                                                                                            in close collaboration with
                                                                                                          Mail & Retail
                                                                                                        • Increase sorting capacity
                                                                                                        • Fulfilment infrastructure
                                                                                                        • Transport optimization
                                                                                                        • Digital excellence

26                                                          3Q20 Roadshow presentation
We have an established position in                                                            at a glance – PaLo Eurasia

the Belgian B2C/C2C parcels market
2019 parcel market1: 100% = € 1.6bn
                                         Unique selling proposition
                                         Offer best last-mile and broadest delivery options,
                                   B2C
                                         supported by acquisitions and partnerships:
                     B2B
                                         • Home delivery 7/7 & evening delivery,
                                           including high-end deliveries (2-man)
                             C2C         • ~2,300 pick-up & drop-off points
CAGR 2019-25e1, % volume growth          • >250 parcel lockers in Belgium
              ~9%                          (2 new parcel lockers every week in 2020)
                                         • Click & Collect
                           ~4%
                                         • Non-exclusive partnerships with DPDHL for B2C parcel delivery into
                                           Belgium (from Germany/France & Benelux)

         B2C / C2X         B2B
1   Source: Effigy

27                                       3Q20 Roadshow presentation
Partnership with DHL Parcels NL allows to cover the full                                                   at a glance – PaLo Eurasia

BeNe region and to capture important cross-border flows
Launched in June 2018
                                                Purchasing behavior
                                                •   NL is the most important import country to BE (~30% of import flows)
                                                •   BE consumers mainly buy from NL players such as Bol.com and Coolblue

                                                Large NL-based
                                                e-commerce players
                                                •   Looking for a BeNe wide offering with regards to last-mile
                                                •   Benchmarking prices on a BeNe level

                                                Competitive offering
                                                •   Very competitive & dynamic region with many large players such as PostNL,
                                                    DHL, DPD, FedEx

28                            3Q20 Roadshow presentation
The parcels operating model                                                                                                       at a glance – PaLo Eurasia

will be continuously optimized

     Optimize distribution cost                    Evolve towards dedicated                          Increase sorting capacity
     using drop density of mail                    parcel infrastructure to match
     rounds                                        customer requirements

     • Maximize parcels in mail rounds             • Nationwide Parcel distribution footprint to     • Increase sorting capacity in the existing centers
     • Cost advantage due to higher drop density     accommodate distribution of parcels that are      of Brussels, Charleroi & Antwerp to cope with
       leading to lower unit costs                   not in mail rounds                                increasing volume (optimizing sorting footprint
                                                   • Benefits for customer proximity and special       mail & parcels)
                                                     services e.g. late-in services, “large scale”   • Use technology (e.g. address recognition)
                                                     evening distribution or same day distribution

29                                                                3Q20 Roadshow presentation
Supported by acquisitions, bpost group has initial assets                         at a glance – PaLo Eurasia

along the entire value chain of e-commerce logistics

     1                                                               2
     Order                                                           Fulfilment
     • Order management                                              • Order reception in warehouses
                                                                       in the proximity of clients
     • Payment services, tax services
       and fraud prevention                                          • Preparation for shipment
                                           Realtime
                                          technology

     4                                                               3
     Customer Care                                                   Delivery
     • Phone, email, social media &                                  • Hybrid transport network for
       chat support                                                    high-end and urgent delivery

     • Advanced analytics                                            • Last-mile delivery

30                                      3Q20 Roadshow presentation
E-commerce logistics activities in Europe can be                                                                                     at a glance – PaLo Eurasia

developed thanks to an already strong European footprint

                                                                                                     8                       ~1,200
                                                                                                     Commercial fulfilment   FTEs
                                                                                                     centers / facilities
                                           The
                              UK   Netherlands

                                                    Germany
                                                                        Poland
                                          Belgium

                                                        Italy                                        5                       ~€ 133m
                                                                                                     Countries               2019 revenue

     Cold chain facility   Fulfilment sites               Personalized logistics

31                                                                                 3Q20 Roadshow presentation
E-commerce logistics in Europe has 2 complementary                                                                                                       at a glance – PaLo Eurasia

engines of growth i.e. Radial Europe and Active Ants

                                                                          1

Type of clients                                        E-tailers & click-and-mortar (omnichannel)                    Pure e-tailers

Size of clients                                        Medium/large                                                  Small/medium

Level of automation                                    Lower, depends on client                                      High (AutoStore + automated packaging)

Level of Customization                                 High, product and price tailored by client                    Very low

Current locations                                      UK, Germany, Belgium, The Netherlands, Italy and Poland       The Netherlands

                                                       Leveraging knowledge and                                      Leveraging NL success story
                                                       experience from Radial US                                     in other European countries
1   Including Landmark Global and Belgium fulfilment

32                                                                                      3Q20 Roadshow presentation
Parcels & Logistics North America                                                                                                                        at a glance – PaLo N. Am.

at a glance

Sub-segments                                         Revenues 2019, €m
                                                                                   US e-commerce logistics         Capabilities to support
                                                                                                                                               Objectives
                                                                                   provider fulfilling 72m         mid-sized e-tailers to
                                                                                   parcels p.a. with proven        expand cross-border and     • Growth engine for bpost
E-commerce logistics1                                         1,008                client base, IT                 last-mile distribution in     group, to be a leading
                                                                                   infrastructure and              Canada and Australia          e-commerce logistics
                                                                                   capabilities along the E2E
                                                                                   value chain                                                   player in US
                                                                                                                                               • Grow with cross-border
                                                                                   International mail
                                                                      89           solutions and catalogue                                       commerce
International Mail2
                                                                                   fulfilment through US
                                                                                   companies                                                   • International mail
                                                                                                                                                 providers delivering
                                                                                                                                                 profit through
                                                                                                                                                 infrastructure
Total                                                                      1,098                                                                 optimization

1   Radial North America, Landmark Global, Apple Express and FDM
2   MSI, Imex, Mail Inc. = The Mail Group

33                                                                                    3Q20 Roadshow presentation
Acquisition of US-based Radial                                                                                                                            at a glance – PaLo N. Am.

on 16 November 2017

     Acquisition rationale                                                                  Key acquisition data Radial Global
     Our growth                                                                             •   Enterprise Value: $ 820m
     • Integrated e-commerce logistics provides access to a larger and more                 •   Sales 2017: $ 1,082m
       attractive profit pool                                                               •   EBITDA 2017: $ 57m (5.3% margin)
     • Radial as growth engine and key profit contributor                                   •   100% acquisition of the shares
                                                                                            •   Financed through a € 650m 8-year bond issue carrying a coupon of
     Presence in the US and Europe                                                              1.25% (issued 4 July 2018)
     • Strengthen US position building on presence with Landmark Global
     • Scale bpost group’s e-commerce logistics capabilities in the Benelux and
       Europe

     Strong growth of e-commerce                                                            Key indicators for Radial North America
     • e-commerce is growing rapidly with US being an attractive and advanced
       space (+15% p.a. growth of online retail over 2004-2022e)                            • TCV of new business went from $ 217m in 2018 to $ 385m in 2019
                                                                                              and is at > $ 1bn YTD20 (Sept.)
     • Transatlantic e-commerce is growing at >25% p.a. with 20% of European
       parcels coming from the US                                                           • ~7,100 average # of FTEs & interims (2019)
                                                                                            • 21 fulfilment centers mainly in the US, a 22nd fulfilment center is
     Knowledge and experience                                                                 announced and will open end 2Q21
     • Knowledge and experience of the e-commerce logistics chain increase
       exponentially with the acquisition of an experienced player

34                                                                            3Q20 Roadshow presentation
Radial North America offers multiple services                                                                                                                 at a glance – PaLo N. Am.

across the entire e-commerce logistics value chain
                                  Revenues   Radial North
                                  share %    America assets                     Description and key strengths

                  Payment, Tax,              Fraud Zero software                Processing global payments,            •   98.3% approval rate vs. 97.1% industry average
                                                                                maximizing successful authorization
                  and Fraud                                                     and reconciling tax districts and
                                                                                                                       •   1.6% manual review rate vs. 25% industry average
     Technology

                  Prevention                                                    global duties
                                   17%
                  Omnichannel                8,700 Stores with fulfilment       Optimizing efficiency of order         •   Ability to handle complex orders
                                                                                management, ship-from-store and
                  Technology                 12,500 Dropship suppliers          in-store pick-up
                                                                                                                       •   < 12 weeks to deployment vs. competition 4-6 months
                                                                                                                       •   Scalability of technology

                  Warehousing &              21 fulfilment sites                Adapting warehouse management          •   80%+ orders shipped day 0
                                                                                and parcels preparation to
                  fulfilment                 in North America                   e-commerce with pragmatic
                                                                                                                       •   ~100% US coverage
                                                                                automation                             •   Experience of scaling employees / workforce up to ~20k
     Operations

                                                                                                                           peak capacity
                                   74%
                  Freight                    100%                               Managing a large network of carriers   •   Rates 5-15% cheaper than in-sourcing for mid-sized players
                                                                                for a seamless customer experience
                  Management                 Asset light                                                               •   Clients reached in 2.4 days on average

                  Customer Care     9%       3,400+                             Having a single view of customer’s     •   Advanced data analytics
                                                                                history and profile combined with
                                             Seats across 4 sites               leading self-service tech

35                                                                     3Q20 Roadshow presentation
Radial North America market dynamics                                                                                                                        at a glance – PaLo N. Am.

and competitive landscape
                                                                                                    Addressable e-commerce logistics sector
       Online revenue e-tailers, US
                                                                                                        ~$ 680bn total          Radial’s target             $ 45-57bn
       $ 680bn1 expected US online retail revenue in 2020
                                                                                                        US online Retail        audience                    addressable
                                                                                                        e-commerce              e-commerce                  e-commerce
                                                                                                                                revenue                     logistics
                                                                                                                                $ 225-230bn

             $ 2,000m                                      • Mid-market segment
                                                             ($ 20-200m online revenue)             Independent e-commerce logistics providers
                                                           • Enterprise segment                           Omnichannel      Fulfilment             Freight          Customer Care
                                                             ($ 200-600m)                                   & PT&F
                                                           • Some selected key accounts
       $ 20m
                                                             ($ 600m-$ 2bn)

1   Source: Forrester Data, Online Retail Forecast, 2020

36                                                                                    3Q20 Roadshow presentation
Positive commercial development at Radial                                                                                               at a glance – PaLo N. Am.

and financial results in line with expectations

     Commercially heading in the right direction                                       FY18 & FY19 results impacted, as expected, by:

     • We continue to reap benefits from our customer-focused                          • Churn (mostly in Fulfilment & Transport) and repricing, with
       approach, strong new signings in 2019, along with continued                       revenue growth from new and existing customers not fully
       improvement in NPS. Strong 2019 peak with a double-digit                          compensating revenue loss from clients terminating with Radial.
       increase in shipped parcels vs. 2018.                                           • Webstore business phase-out, completed by end FY19

     • Starting in 2Q18 and continuing in 2019 and 2020, we are seeing a
       positive contract renewal cycle for existing clients.                           FY19 results in line with expectations
     • New contracts signed had a TCV of $ 385m for FY19, which was
                                                                                       • Good end of year 2019 peak management, with productivity gains
       above target and above the previous 3 years ($ 150m in 2016 and
                                                                                         partly offset by higher costs related to maintaining a sufficient
       2017, $ 217m in 2018).
                                                                                         labor pool within a tight US labor market.
     • Very strong TCV development continued through YTD20,
       accelerated by COVID-19, with $ 1,156m total contract value
       signed.
                                                                                       Significant growth at existing clients and 2019
                                                                                       new business in YTD20 (partly COVID-19 driven)
                                                                                       • YTD20 adjusted EBIT above break-even at € 18.8m for PaLo NA

37                                                                   3Q20 Roadshow presentation
3Q20 Results
3Q20 EBIT nearly doubles driven by high growth in                                                                                                                                                                                 3Q20

Parcels & Logistics Eurasia and North America
€ million                                                                                                                                                                      0.5
                                                                                                                                                                                                             69.5
                                                                                                                                                                                                              4.4

                                                                                                                                                14.0

                                                                                                                                                                                                                          +31.2

                                                                                                                 19.4
                                                  38.3
                                                   4.0                            -2.7
                                                                                                                                                                                                              65.1

                                                                                                     or € +21.1m when excluding
                                                                                                     3Q19 € +1.7m contingent
                                                                                                     considerations reversal on
                                                                               Adjusted1
                                                  34.3                                               Dynagroup
                                                                               Reported

                                                  EBIT                          Mail &                          PaLo                          PaLo                         Corporate                          EBIT
                                                  3Q19                          Retail                         Eurasia                     N. America                                                        3Q20
1 Adjusted previously called Normalized, change of terminology “Adjusted” in order to align the label of this APM to the ESMA guidelines, definition and approach remain unchanged. Adjusted excludes items that are

non-recurring in nature and significant (> € 20m). All profits or losses on disposal of activities are adjusted whatever the amount they represent, as well as the amortization and impairment on the intangible assets
recognized throughout the Purchase Price Allocation (PPA) of the acquisitions. Reversals of provisions whose addition had been excluded from income are also adjusted whatever the amount they represent.

39                                                                                                                  3Q20 Roadshow presentation
Key financials 3Q20                                                                                                                                    3Q20

 € million                                 Reported                                    Adjusted1                     1   Adjustment of € -0.6m at operating
                                  3Q19                3Q20                    3Q19                 3Q20      %↑          income level related to the disposal of
                                                                                                                         Alvadis on August 30, 2019
Total operating income        1   881.5               972.9               1   880.9                972.9     10.4%
Operating expenses                783.0               840.1                   783.0                840.1     7.3%
EBITDA                            98.5                132.8                   97.9                 132.8    35.7%    2   Amortization of intangibles recognized
                                                                                                                         during PPA is adjusted, leading to
Depreciation & Amortization        64.2                67.8                    59.6                 63.3     6.3%        increase in EBIT (€ +4.4m) and income
EBIT                              34.3            2   65.1                    38.3            2    69.5     81.5%        tax expense (€ +0.3m)

Margin (%)                        3.9%                6.7%                    4.3%                 7.1%
Financial result                  -12.4                -11.5                  -12.4                 -11.5
                                                                                                                     3   Adjusted FCF excludes the cash Radial
Profit before tax                 27.1                59.2                    31.1                 63.6     104.7%       receives on behalf of its customers for
                                                                                                                         performing billing services
Income tax expense                 13.8           2    14.8                    14.0           2     15.1     7.4%
Net profit                         13.4               44.4                     17.0                48.6     184.8%
FCF                               -15.8           3    -9.1                    -9.7           3    33.0        -
Net Debt at 30 September          751.3               597.6                   751.3                597.6    -20.5%
Capex                             47.6                 41.1                   47.6                  41.4    -12.8%
Average # FTEs and interims       34,976              38,274                  34,976               38,274    9.4%

40                                                             3Q20 Roadshow presentation
Results by segment 3Q20                                                                                       3Q20

 € million
                                M&R      PaLo Eurasia                 PaLo N. Am.    Corp     Eliminations    Group
External operating income        414.3              259.5                    294.9     4.2              0.0    972.9
Intersegment operating income     49.4                 3.6                     1.0    86.2           -140.2      0.0
Total operating income          463.7              263.1                   295.9     90.4          (140.2)    972.9
Operating expenses               405.8              228.2                    269.2    77.0           -140.2    840.1
EBITDA                           57.8               34.9                     26.7    13.4                     132.8
Depreciation & Amortization       22.7                 5.9                    21.1     18.1                     67.8
Reported EBIT                    35.1               29.0                      5.6    -4.7                      65.1
Margin (%)                       7.6%                11.0%                   1.9%    -5.2%                      6.7%
Adjusted EBIT                    35.7               29.7                      8.7    -4.7                      69.5
Margin (%)                       7.7%                11.3%                   2.9%    -5.2%                      7.1%

41                                       3Q20 Roadshow presentation
Top-line decline driven by COVID-19 impact on retail                                                                                                                                         3Q20 – M&R

and by deconsolidation of Alvadis
M&R external
operating income, € million                              Domestic Mail                                          Transactional                                   Proximity and convenience
                                                         Operating income decline at € -8.7m i.e.               Good resistance of transactional mail           retail network
             3Q19               444.5                    € -20.9m volume (-8.2% underlying                      volumes with -8.3% underlying volume
                                                         volume decline), and € +12.1m price/mix.               decline driven by the known structural          Decrease mainly driven by:
                                                                                                                trends of continued e-substitution by big          ‐ Ubiway retail revenues mainly
                                                                                                                senders and SMEs, higher acceptance of               impacted by reduced footfall from
 1   Transactional                                -0.5
                                                                                                                e-documents at the receivers’ side and               COVID-19, especially in travel
                                                                                                                digitization of C2B communication                    environments
                                                                                                                through smartphone apps.                           ‐ 2-month Alvadis deconsolidation
 2     Advertising                            -4.9                                                                                                                   effect (€ -5.4m) until 31 August 2020
                                                                                                                                                                   ‐ Decline in banking & finance
                                                                                          1    2    3                                                       1                                            4
                                                                                                                                                                     revenues
 3           Press                         -3.4

     Proximity and                                       Advertising                                            Press                                           Value added services
 4    convenience               -20.7
     retail network                                      -9.4% underlying volume decline driven by              -5.4% underlying volume decline driven by       Lower revenues from data and document
                                                         continued recovery in unaddressed                      e-substitution and rationalization.             management partly compensated by
      Value added                                        advertising mail aimed at driving traffic to                                                           higher revenues from European license
 5                    -0.7                               the store, while Direct Mail sales is                                                                  plates.
          services
                                                         impacted by ongoing limited visibility due
                                                         to COVID-19 uncertainties.
             3Q20       414.3

                                   -30.1                                                            2                                                       3                                            5

42                                                                                            3Q20 Roadshow presentation
Limited M&R EBIT decline driven by stellar growth in parcel                                                                                        3Q20 – M&R

volumes handled through the mail network for PaLo Eurasia

                                                                                      Key takeaways 3Q20
€ million
Mail & Retail                                    3Q19      3Q20          %↑
External operating income                         444.5     414.3       -6.8%
     Transactional                                168.8     168.3       -0.3%         • Total operating income decline of € -22.3m or -4.6% (€ -21.7m
     Advertising                                   50.8      45.9       -9.7%
                                                                                        adjusted) primarily driven by lower Proximity and convenience retail
     Press                                         82.1      78.7       -4.1%
     Proximity and convenience retail network     116.9      96.2      -17.7%
                                                                                        network revenues and mail volume decline, partly compensated by
     Value added services                          25.9      25.2       -2.6%           mail pricing and higher intersegment operating income related to
Intersegment operating income                      41.6      49.4       18.8%           higher parcels volumes.
Total operating income                           486.0     463.7     -4.6%
                                                                                      • Operating expenses (incl. adjusted D&A) declined by € +19.0m (-4.3%):
Operating expenses                                426.9     405.8       -4.9%
EBITDA                                            59.1      57.8     -2.2%                ‐ Higher payroll & interim costs driven by (1) increased headcount
Depreciation & Amortization                        20.7      22.7        9.9%
                                                                                            mainly from higher parcel volumes and absenteeism and (2) higher
Reported EBIT                                     38.5      35.1     -8.6%                  price from regular salary indexation; together with specific COVID-19
Margin (%)                                        7.9%      7.6%
                                                                                            opex (€ 1.6m) incl. bad debt
Adjusted EBIT                                     38.4      35.7      -7.1%
Margin (%)                                        7.9%       7.7%                         ‐ More than compensated by lower material costs from Ubiway retail
Average # FTEs and interims                     23,070    24,092       4.4%                 incl. Alvadis deconsolidation impact, increased sorting expenses
Additional KPIs
                                                                                            transferred to PaLo Eurasia driven by growth in parcel volumes
Underlying Mail volume decline                    -7.8%     -8.2%
                                                                                            handled through the mail network, lower project-related costs and
Transactional                                     -9.2%     -8.3%                           lower use of sub-contractors.
Advertising                                       -6.5%     -9.4%
Press                                             -3.4%     -5.4%                     • M&R adjusted EBIT declined by € -2.7m to € 35.7m.
43                                                                  3Q20 Roadshow presentation
PaLo Eurasia revenue driven by thriving                                                                                                                                                         3Q20 – PaLo Eurasia

e-commerce both domestically and abroad
PaLo Eurasia external
operating income, € million
                                               Parcels BeNe                                                      E-commerce logistics                                        Cross-border
                                               Parcels B2X1 revenues up 45.3%                                    Revenue evolution mainly driven                             Strong revenue development
             3Q19     195.1
                                               driven by volume growth of +49.0%                                 by:                                                         driven by:
                                               fuelled by continued strong e-                                    ‐ Active Ants growth at existing                            ‐ Continued exponential growth of
                                               commerce development                                                customers as well as the                                    Asian parcel volumes with
                                               accelerated by COVID-19.
 1   Parcels BeNe       31.3                                                                                       integration of MCS Fulfilment as                            revenues more than tripling YoY
                                               Total Parcels BeNe revenues up                                      from October 1, 2019                                        linked to rail transport of
                                               € 31.3m (+33.1%) or € +32.9m                                                                                                    containers as an alternative to air
                                                                                                                 ‐ Radial Europe growth of UK sales
                                               excluding last year’s positive effect                                                                                           freight
                                                                                                                   both from existing and new
      E-commerce                               of the reversal of the contingent
 2                                8.5                                                                              clients and opening of new                                ‐ Partly offset by declining cross-
          logistics                            consideration of Dynagroup                                          fulfilment site in Poland                                   border postal business where
                                               (€ 1.7m). Dilution of the revenue
                                                                                                                                                                               growth in inbound parcels could
                                               growth % vs. parcels B2X revenue                                                                                                not fully compensate the decline
                                               growth is explained by flattish YoY
 3   Cross-border                       24.6                                                                                                                                   in both inbound & outbound
                                               revenue development of business                                                                                                 mail volumes
                                               not captured in Parcels B2X, driven
                                               among others by LY’s closure of
                                               non-profitable businesses.
             3Q20             259.5

                               +64.5                                                                1                                                               2                                            3

                                               1   Since 3Q20, volume growth % consists of B2X parcels, not including Euro-Sprinters, CityDepot, Future Lab and Dynagroup.
                                                   Restated 1Q20 and 2Q20 are respectively at +25.2% and +79.3%, leading to 51.5% YTD20.
44
Stellar growth in parcel volumes handled through the mail                                                                                           3Q20 – PaLo Eurasia

network drives steep EBIT margin improvement

                                                                                             Key takeaways 3Q20
€ million
Parcels & Logistics Europe and Asia                      3Q19     3Q20          %↑
External operating income                                 195.1    259.5       33.1%
       Parcels BeNe                                        94.4    125.6       33.1%         • Total operating income up € +64.8m or +32.7% (€ +66.5m or 33.8%
       E-commerce logistics                                32.3     40.8      26.5%
                                                                                               excl. last year’s € 1.7m contingent considerations reversal on
       Cross-border                                        68.4     93.0      36.0%
Intersegment operating income                               3.2      3.6        11.1%
                                                                                               Dynagroup) driven by positive development in all revenue lines,
                                                                                               especially Parcels BeNe (€ +31.3m, +33.1%) and Cross-border
Total operating income                                   198.3    263.1     32.7%
Operating expenses                                        183.5    228.2      24.4%
                                                                                               (€ +24.6m, +36.0%).
EBITDA                                                    14.8     34.9    136.2%            • Operating expenses (incl. adjusted D&A) were up € -45.4m
Depreciation & Amortization                                 5.1      5.9       14.8%
                                                                                               (+24.2%), mainly explained by higher volume-linked variable costs
Reported EBIT                                              9.7     29.0    200.2%              translating into increased payroll, interim and transport costs across
Margin (%)                                                4.9%     11.0%
                                                                                               all business lines. PaLo EA also recorded higher intersegment
Adjusted EBIT                                             10.4     29.7    187.2%              operating expenses from M&R driven by solid parcels growth in the
Margin (%)                                                5.2%     11.3%
                                                                                               integrated last-mile mail & parcels network.
Average # FTEs and interims                              3,230    3,507       8.6%
Additional KPIs                                                                              • Adjusted EBIT increased by € +19.4m, nearly tripling to reach
Parcels volume growth1                                    21.1%   49.0%                        € 29.7m. Excluding last year’s contingent considerations reversal on
                                                                                               Dynagroup, adjusted EBIT was up € +21.0m operationally. The steep
                                                                                               margin improvement is explained by stellar growth in parcel volumes
                                                                                               handled through the mail network.
1   3Q19 restated to reflect Parcels B2X volume growth

45                                                                         3Q20 Roadshow presentation
Parcels & Logistics North America driven by                                                                                                         3Q20 – PaLo N. Am.

continued strong e-commerce development
PaLo North America external
operating income, € million
                                                           E-commerce logistics                            International mail
                                                           YoY increase of +25.2% (+31.6% at               Revenues flat YoY (+5.1% at
                       3Q19      239.9                     constant exchange rate).                        constant exchange rate) with lower
                                                           Revenue increase mainly driven by               volumes in the business mail
                                                           Radial NA benefitting from                      segment compensated by higher
                                                           changing e-commerce shopping                    domestic parcels revenues from
                                                           habits due to COVID-19 concerns.                new contract wins.
           E-commerce
 1                                               55.0      Growth mainly driven by existing
               logistics
                                                           customers (+34%) as well as
                                                           customers launched in 2019, slightly
                                                           offset by client churn.
                                                           Cross-border activities (Landmark,
           International
 2                                                   0.0   Apple Express & FDM) benefitted
                    mail
                                                           from new client wins and increased
                                                           e-commerce business overall,
                                                           leading to higher sales from
                                                           existing customers.
                      3Q20               294.9

                                                                                               1                                                2
1 Combination   IMEX, Mail Inc & MSI
                                                 +55.0

46                                                                                       3Q20 Roadshow presentation
Sharp EBIT uplift driven by Radial North America                                                                                3Q20 – PaLo N. Am.

                                                                         Key takeaways 3Q20
€ million
Parcels & Logistics North America   3Q19      3Q20          %↑
External operating income            239.9     294.9      22.9%
     E-commerce logistics            218.4     273.4      25.2%          • Total operating income increase of € +54.5m or +22.6% (+28.9% at
     International mail               21.4      21.4        0.0%
                                                                           constant exchange rate) fully driven by e-commerce logistics which
Intersegment operating income           1.5      1.0      -31.5%
                                                                           continues to benefit from strong momentum.
Total operating income              241.4     295.9     22.6%
Operating expenses                   229.7     269.2       17.2%         • Operating expenses (incl. adjusted D&A) increased by € -40.5m
EBITDA                                11.6     26.7    129.1%              (€ -52.6m excl. FX) resulting from volume-driven higher variable
Depreciation & Amortization           20.2      21.1        4.2%           labour and transportation costs, higher fixed payroll and benefits,
Reported EBIT                        -8.6       5.6            -           COVID-19 related expenses and increased D&A from additional
Margin (%)                           -3.6%      1.9%
                                                                           fulfilment sites. This was partly compensated by higher productivity
Adjusted EBIT                        -5.3       8.7            -           and benefits from our cost savings program as well as cost
Margin (%)                           -2.2%     2.9%
                                                                           containment measures in general.
Average # FTEs and interims         7,059     9,102     28.9%
                                                                         • Adjusted EBIT up € +14.0m to € 8.7m mainly driven by positive
Additional KPIs, adjusted
Radial North America revenue, $m     195.3     261.8       34.1%
                                                                           operating leverage in E-commerce logistics, in particular at Radial.
Radial North America EBITDA, $m         5.1     21.2     315.7%
Radial North America EBIT, $m         -11.2      3.2

47                                                     3Q20 Roadshow presentation
Corporate EBIT slightly above last year                                                                                    3Q20 – Corporate

driven by higher building sales

                                                                    Key takeaways 3Q20
€ million
Corporate                       3Q19     3Q20          %↑
External operating income         2.2      4.2       92.9%
Intersegment operating income    88.6     86.2        -2.7%         • External revenues up by € +2.0m driven by higher building sales.
Total operating income          90.8     90.4      -0.4%
Operating expenses                77.8     77.0       -1.0%         • Operating expenses (incl. D&A) decreased by € +0.8m driven by
EBITDA                           13.0     13.4       3.4%             lower demand for services from the different operational Business
Depreciation & Amortization       18.2     18.1       -0.3%           Units (€ -2.4m intersegment operating income). Net of the
Reported EBIT                   -5.2      -4.7            -           intersegment operating income, opex (incl. D&A) increased by
Margin (%)                      -5.7%    -5.2%                        € -1.6m mainly driven by higher provisions.
Adjusted EBIT                   -5.2      -4.7            -
Margin (%)                      -5.7%    -5.2%                      • As a result, adjusted EBIT increased by € +0.5m YoY to € -4.7m.
Average # FTEs and interims     1,617    1,574      -2.7%

48                                                3Q20 Roadshow presentation
Increased FCF1 thanks to strong operating activities                                                                                                                                                               3Q20

       Reported - € million
                                                                                                    3Q19                                    3Q20                                 Delta
+      Cash flow from operating activities                                                             31.8                                    28.4                                  -3.4
            out of which CF from operating activities before ∆ in WC & provisions                          85.6                                  93.6                                  8.0
+      Cash flow from investing activities                                                            -47.5                                   -37.5                                  10.0
=      Free cash flow                                                                                -15.8                                     -9.1                                  6.6
+      Financing activities                                                                           -46.8                                   -47.2                                  -0.5
=
       Net cash movement                                                                            -62.5                                   -56.4                                     6.1
       Capex                                                                                        -47.6                                   -41.4                                     6.1

     CF from operating activities                                                                                     CF from investing activities
     € +8.0m variance in CF from operating activities before change in working capital and                            Disposal of Alvadis in 3Q19: € -5.9m
     provisions, mainly thanks to higher EBITDA (€ +34.3m) partially offset by higher tax
                                                                                                                      M&A activities in 3Q19: € +7.3m (contingent consideration Dyna and
     prepayments (€ -19.0m)
                                                                                                                      purchase AtoZ and MCS)
     Change in working capital and provisions (€ -11.4m) of which :
                                                                                                                      Capex at € 41.4m decreased by € +6.1m vs 3Q19 and was mainly
     - More cash outflows relating to collected proceeds due to clients in Radial: € -36.2m, high                     spent on increased capacity for e-commerce: Radial and Active Ants
       level of merchandise sales in COVID-19 period                                                                  additional sites and Parcels B2X sorting capacity
     - € +23.1m improvement in working capital evolution: primarily driven by higher settlements of
       receivables due to increased sales in 2Q20 partially offset by outflow related to social security
       deferred to 3Q20 and lower supplier balances                                                               1 Free   cash flow = cash flow from operating activities + cash flow from investing activities

49                                                                                               3Q20 Roadshow presentation
Balance Sheet                                                                                                                                                                                   3Q20

 € million                                                                                               € million
Assets                                                        Dec 31, 2019        Sep 30, 2020          Equity and Liabilities                                      Dec 31, 2019       Sep 30, 2020
PPE                                                                     1,133.6             1,109.6     Total equity                                                          682.6               765.5
Intangible assets                                                        898.3               860.8      Interest-bearing loans & borrowings (incl.Bank overdraft)           1,449.9              1,453.6
Investments in associates and joint ventures                             239.5               239.1      Employee benefits                                                     320.6                311.2
Other assets                                                              41.8                43.4      Trade & other payables                                               1,278.5              1,175.1
Trade & other receivables                                                759.0               638.1      Provisions                                                             29.8                28.5
Inventories                                                               34.7                36.7      Derivative instruments                                                   1.3                 0.7
Cash & cash equivalents                                                  670.2               856.1      Other liabilities                                                      14.3                49.4
Total Assets                                                          3,777.1            3,783.9        Total Equity and Liabilities                                       3,777.1             3,783.9

     Main balance sheet movements
     Trade & other receivables decreased mainly due to the settlement of the SGEI receivable in the first quarter.

     Trade & other payables decreased mainly due to the decrease of trade payables and social payables. The decrease of the trade payables was mainly explained by the cost containment
     actions in 2020, partially offset by the positive impact of extended payment terms in 2Q20 and 3Q20 due to COVID-19.

     Total equity increased in line with the realized profit (€ 135.9m), partially offset by the fair value adjustment of bpost bank’s bond portfolio (€ 14.0m), the exchange differences on
     translation of foreign operations (€ 26.4m) and the net impact of the integration of Active Ants International comprising the non-controlling interests and the recognition of the
     contingent consideration for the purchase of the remaining shares (€ 14.6m).

     Other liabilities increased due the lower advanced tax payment.

50                                                                                       3Q20 Roadshow presentation
Financing Structure & Liquidity                                                                                                                                                                                                 3Q20

    € million                                                                                                                       € million
    Available Liquidity                                                          Dec 31, 2019            Sep 30, 2020               External Funding                                               Dec 31, 2019           Sep 30, 2020
    Cash & cash equivalents                                                                    670.2                       856.1    Long-ter m
        Cash in network                                                                        163.6                       134.8    Long-term bond1 (1.25% - 07/2026)                                         650.0               650.0
        Transit accounts                                                                       105.8                        42.7    Bank loans                                                                183.2               176.2
        Cash payment transactions under execution                                              -26.7                         -7.1      Amortizing Loan (€ 100m) - 12/2022                                       18.2               18.2
        Bank current accounts                                                                  377.4                       486.6       Term Loan ($ 185m) - 07/2023                                           165.0               158.0
        Short-term deposits                                                                     50.0                       199.0
    Undrawn revolving credit facilities                                                        375.0                       375.0    Shor t-ter m
        Syndicated facility - 10/2024                                                         300.0                        300.0    Bank loans: Amortizing Loan (€ 100m) - 12/2022                                  9.1             9.1
        Bilateral facility - 06/2025                                                            75.0                        75.0    Commercial Papers                                                         164.5               165.1
    Total Available Liquidity                                                             1,045.2                    1,231.1        Total External Funding                                                1,006.8              1,000.4

       Liquidity: Cash & Committed credit lines                                                                                       External Funding & Debt Amortization (excl. IFRS16 lease liabilities)
       Total available liquidity at September 30, 2020 consisted out of € 856.1m cash & cash equivalents                              Out of € 1,000.4m external funding on balance sheet at September 30, 2020:
       of which € 685.6m is readily available on bank current accounts and as short-term deposits.
                                                                                                                                          ‐ € 165.1m need to be repaid or will be rolled over between 4Q20 and 1Q21
       In addition, bpost group has 2 undrawn revolving credit facilities for a total amount of € 375.0m.                                   (i.e. commercial paper with maturity ranging between 1 to 6 months).
                                                                                                                                          ‐ € 9.1m during 4Q20 (i.e. the current portion of the amortizing loan).

1   € 650m long-term bond with a carrying amount of € 643.3m, the difference being the re-offer price and issuance fees.

51                                                                                                                  3Q20 Roadshow presentation
YTD20 Results
YTD20 EBIT impacted by significant COVID-19 related mail                                                                                                                                                                          YTD20

volume decline, partly compensated by strong PaLo performance
€ million                                         241.6

                                                   15.0                                                                                                                                                                   -21.5
                                                                                                                                                                              -12.2                          220.1
                                                                                                                                               32.5                                                           13.7
                                                                                 -69.0

                                                                                                                 27.1                                            or € +7.7m when excluding
                                                                                                                                                                 2Q19 € 19.9m gain on HQ
                                                                                                                                                                 disposal

                                                  226.6
                                                                                                    or € +28.8m when                                                                                         206.4
                                                                                                    excluding 3Q19 € +1.7m
                                                                                                    contingent considerations
                                                                               Adjusted1            reversal on Dynagroup

                                                                               Reported

                                                  EBIT                          Mail &                          PaLo                          PaLo                         Corporate                         EBIT
                                                 YTD19                          Retail                         Eurasia                     N. America                                                       YTD20
1 Adjusted previously called Normalized, change of terminology “Adjusted” in order to align the label of this APM to the ESMA guidelines, definition and approach remain unchanged. Adjusted excludes items that are

non-recurring in nature and significant (> € 20m). All profits or losses on disposal of activities are adjusted whatever the amount they represent, as well as the amortization and impairment on the intangible assets
recognized throughout the Purchase Price Allocation (PPA) of the acquisitions. Reversals of provisions whose addition had been excluded from income are also adjusted whatever the amount they represent.

53                                                                                                                  3Q20 Roadshow presentation
Key financials YTD20                                                                                                                                   YTD20

 € million                                  Reported                                    Adjusted1                      1   Adjustment of € -0.6m at operating
                                  YTD19                YTD20                  YTD19                 YTD20      %↑          income level related to the disposal of
                                                                                                                           Alvadis
Total operating income        1   2,724.0              2,960.2            1   2,723.4               2,960.2    8.7%
Operating expenses                2,312.7              2,554.5                2,312.7               2,554.5    10.5%
EBITDA                            411.3                405.7                  410.7                 405.7     -1.2%    2   Amortization of intangibles recognized
                                                                                                                           during PPA is adjusted, leading to
Depreciation & Amortization        184.7                199.3                  169.1                 185.6     9.8%        increase in EBIT (€ +13.7m) and income
EBIT                              226.6            2   206.4                  241.6            2    220.1     -8.9%        tax expense (€ +0.8m)

Margin (%)                         8.3%                 7.0%                   8.9%                  7.4%
Financial result                   -34.7                -29.9                  -34.7                 -29.9
                                                                                                                       3   Adjusted FCF excludes the cash Radial
Profit before tax                 201.3                190.1                  216.3                 203.9     -5.8%        receives on behalf of its customers for
                                                                                                                           performing billing services
Income tax expense                 74.4            2    54.3                   75.6            2     55.1     -27.2%
Net profit                        126.9                135.9                  140.7                 148.8      5.7%
FCF                               174.9            3   298.3                  204.2            3    323.3     58.3%
Net Debt at 30 September          751.3                597.6                  751.3                 597.6     -20.5%
Capex                             89.0                  86.8                   89.0                  86.8      -2.4%
Average # FTEs and interims       34,254               36,941                 34,254                36,941     7.8%

1 Unaudited   figures

54                                                              3Q20 Roadshow presentation
Results by segment YTD20                                                                                         YTD20

 € million
                                 M&R       PaLo Eurasia                 PaLo N. Am.    Corp      Eliminations     Group
External operating income        1,279.6               762.1                   906.7      11.8             0.0    2,960.2
Intersegment operating income     152.3                  9.5                     4.4    262.1           -428.2        0.0
Total operating income          1,431.8              771.5                     911.1   273.9         (428.2)     2,960.2
Operating expenses               1,230.9               678.2                   838.3    235.2           -428.2    2,554.5
EBITDA                          200.9                 93.3                     72.8     38.7                      405.7
Depreciation & Amortization        65.7                 16.5                    63.7     53.4                       199.3
Reported EBIT                    135.2                76.8                      9.1    -14.7                      206.4
Margin (%)                        9.4%                10.0%                    1.0%     -5.4%                       7.0%
Adjusted EBIT                    136.9                79.0                     18.8    -14.7                       220.1
Margin (%)                        9.6%                10.2%                    2.1%     -5.4%                       7.4%

55                                         3Q20 Roadshow presentation
Positive evolution of FCF1 mainly driven by payment terms                                                                                                                                                                YTD20

in payables and lower tax related cash flows
       Reported - € million
                                                                                                YTD19                                YTD20                                  Delta
+      Cash flow from operating activities                                                        206.7                                  370.3                                 163.7
           out of which CF from operating activities before ∆ in WC & provisions                     299.5                                366.5                                  67.1
+      Cash flow from investing activities                                                         -31.8                                 -72.0                                -40.2
=
       Free cash flow                                                                            174.9                                 298.3                                 123.4
+
       Financing activities                                                                       -151.7                                 -98.2                                  53.5
=
       Net cash movement                                                                             23.1                              200.0                                 176.9
       Capex                                                                                     -89.0                                  -86.8                                   2.2

     CF from operating activities                                                                                 CF from investing activities                                          CF from financing activities
     € +67.1m variance in CF from operating activities before change in working capital and provisions            Proceeds from buildings sales: € -43.6m                               Absence of dividend payment YTD20:
     mainly thanks to                                                                                                                                                                   € +50.0m
                                                                                                                  Capex: € +2.2m (€ 86.8m YTD20 vs €
     - Higher EBITDA excluding gain on HQ (€ +14.3m when deducting non-cash gain of € +19.9                       89.0m LY). Main investments in YTD20
       from EBITDA €-5.6m ) partially offset by tax prepayments (€ -19.0m)                                        include increased capacity at Radial,
     - Lower tax prepayments YTD20 :€ +30.7m vs. LY                                                               Parcels B2C and Active Ants and ICT
     - Tax assessments on previous years: € +21.3m YoY variance (€ +7.5m positive settlement in                   projects
       1Q20 vs. € -13.8m in 1Q19)
     Change in working capital and provisions (€ +96.6m) mainly thanks to positive impact of
     extended payment terms in payables due to some temporary initiatives set up in the context of
     the pandemic, which will be unwound during 1Q21, and the increased cross border activities
     leading to increased terminal dues and terminal dues                                                    1 Free   cash flow = cash flow from operating activities + cash flow from investing activities

56                                                                                            3Q20 Roadshow presentation
You can also read