Welfare and Housing Interface - EVIDENCE AND POLICY OPTIONS - Welfare Expert Advisory Group
←
→
Page content transcription
If your browser does not render page correctly, please read the page content below
SOCIAL SECURITY IN NEW ZEALAND

DECEMBER 2018

   Welfare and Housing Interface
                        EVIDENCE AND POLICY OPTIONS

                                                      BACKGROUND PAPER
                                                                    01
WELFARE AND HOUSING INTERFACE – EVIDENCE AND POLICY OPTIONS
Summary
This paper provides an overview of housing policy options to enhance access to affordable
housing, improve family and household security, and deliver a choice of tenure for low- and
low-middle-income households.
Demand-side subsidies such as Accommodation Supplement, Temporary Additional Support
and Income Related Rent Subsidy are not covered in this paper; they are addressed in a
separate paper.
Some preliminary views:
• New Zealand’s reliance on direct state agency building of public housing is unusual – most
countries have over time built large third-sector public housing provision supported through
government funding of various sorts.
• Housing allowances like the Accommodation Supplement are common across countries.
• Large-scale tax credits or financial products that bring institutional investors into providing
affordable housing are a major feature of the United States’ system and new options are
being explored in Australia.
• It is common to have tax incentives, low-interest loans and other programmes to help
low-income renters into home ownership or shared equity. New Zealand is no exception –
historically it had considerably more extensive options available than it does today.
• There are various options to define affordable housing – the two broad options are ratios of
house prices or rents to income, and more complex residual income measures that attempt
to get closer to measuring actual household income and costs.
02Scope
The Welfare Expert Advisory Group has been set up to provide advice to the government on the
future of the welfare system. It is due to report back in February 2019.
This paper forms the evidence base for a paper on housing policy options that could enhance
access to affordable housing, improve family and household security, and deliver a choice of
tenure for low- and low-middle-income households.
In particular, this paper draws on New Zealand and international literature, examples from other
jurisdictions and innovative housing developments in New Zealand to provide examples of:
• programmes that support third-sector providers to deliver housing together with other
support services
• state-supported building programmes, including developments by organisations such as
Housing New Zealand (HNZ) and private- and third-sector providers that provide choice of
tenure (renting and home ownership)
• how systems incorporate the preferences of those being assisted, in particular how they
ensure that housing development is culturally appropriate for the intended occupants
• innovative housing financial products that include low-interest loans, capitalisation of
financial support, rent-to-buy schemes, shared equity and micro-financing
• housing tenure as a significant factor for positive social and economic impacts
• general regulatory approaches to housing security, quality, affordability and accessibility
• definitions of housing affordability.
This paper summarises the results of the research. It follows the seven points set out above,
beginning with a short section on the conceptual framework.
It was not part of the scope to define the problem, estimate its scale or evaluate the extent to
which any of these options would help.
03WELFARE AND HOUSING INTERFACE – EVIDENCE AND POLICY OPTIONS
Framework
• The supply of housing is influenced by the availability of land, land use and building
regulations, infrastructure availability, construction costs and the scale and incidence of
various taxes, levies and charges.
• The demand for housing is influenced by population and demographic factors, trends
in household formation, incomes and therefore employment, the availability and cost of
finance, government income support, and housing design and quality preferences.
• The price of housing, for sale or for rent, depends on the mix of supply and demand. Because
the factors referred to above can vary from place to place, and a house in one place may
not be a good substitute for a house in another place, housing markets are separated by
geography. And because households differ, a house that works for one household may not
suit another.
• Government action is extensive, particularly on the supply side. It regulates land use and
building quality, provides infrastructure and in New Zealand directly provides housing for
some parts of the population who would be poorly served by the private market. It also acts
on the demand side, providing housing subsidies for people who would struggle to meet
their housing costs on their own.
Some rough numbers are useful as well at this point.
• There are 1.56 million occupied private dwellings in New Zealand. About 65 percent of
households own the homes they live in or hold them in family trusts, and about 35 percent
are renting. About 32,000 new dwellings were consented in the year to June 2018.
• Home ownership rates in New Zealand have fallen to the lowest levels in 60 years (Johnson
et al., 2018). Māori home ownership is 28 percent, Pacific People 19 percent and European
57 percent. Home ownership for Māori households declined by 20 percent between 1986
and 2013. These proportions compound inequities and make it hard for people to develop
lives independent of the welfare system.
• The home-ownership rate for Pacific households had the greatest decline of 35 percent
between 1986 and 2013. The majority of Pacific People are living in rental properties, with
over a quarter of the Pacific population living in social housing. Crowded housing is highest
among Pacific People.
• There are about 67,000 public houses. HNZ has around 60,000 tenancies, and community
housing providers about 5,000. Not counted in these figures is housing provided by
local government.
• House prices have grown rapidly in the past 20 years, much faster than incomes. House price
inflation in the past five years has been around 30 percent in New Zealand overall, while
incomes have risen by half this rate (Johnson et al., 2018). Very low mortgage interest rates
blunt the impacts of these price rises somewhat, but buying a house has become much less
affordable in general, and out of reach entirely of those on low incomes.
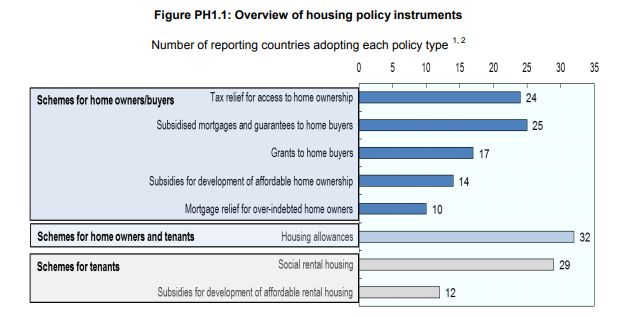
04The Organisation for Economic Co-operation and Development (OECD) defines eight
categories of public policy for affordable housing. It notes that demand-side measures
to help make housing more affordable are more common than supply-side measures to
encourage more affordable housing to be built. In order, by the number of countries in the
35-country OECD sample that report having each type of policy, the eight types are:
• housing allowances
• public rental housing
• subsidised mortgages and mortgage guarantees for home buyers
• tax relief for home ownership
• grants to home buyers
• subsidies for the development of affordable home ownership
• subsidies for the development of affordable rental housing
• mortgage relief for over-indebted home owners.
It is noted that 5 of these policies relate to home ownership.
New Zealand has substantial programmes in the first two groups. The Ministry of Social
Development is forecast to spend $2.7 billion on housing support in 2018-2019, mostly
in income support for rental accommodation (Accommodation Supplement $1.4 billion,
Temporary Additional Support $160 million) and subsidies for state housing tenants (Income
Related Rent Subsidy $900 million). However, New Zealand currently has much smaller
programmes in most of the other six categories.
OECD supply-side measures include subsidies for the development of affordable homes and
rental housing, and construction, management and maintenance of public housing. The figure
below shows the number of OECD countries that offer the various instruments:1
1 http://www.oecd.org/social/affordable-housing-database.htm
05WELFARE AND HOUSING INTERFACE – EVIDENCE AND POLICY OPTIONS
Programmes that support
third-sector providers to deliver
affordable housing
In many jurisdictions affordable housing is delivered through third-sector providers with some
government support. Here are some examples:
Australia
The Australian Government2 provides grants to state and territory governments that are tied
to house building as well as other housing outcomes. In its 2017 budget, the government
introduced new measures to increase the supply of new homes in particular. State and territory
governments also devote their own resources to housing support. Long-term trends show
that state-provided and third-sector housing, while growing in absolute terms, is not growing
as quickly as housing overall (Australian Institute of Health and Welfare, 2018; Australian
Productivity Commission, 2017). Community housing doubled between 2008 and 2016 from
39,800 to 82,900 dwellings. Australia provides:
• housing cooperatives, providing tenancy management and maintenance of housing that is
owned by government, central finance companies or individual cooperatives
• local government housing associations, providing low-cost housing within particular
municipalities. They are closely involved in policy, planning, funding and/or monitoring roles,
and can manage the housing stock directly
• regional or local housing associations, providing property and tenancy management services,
and support services to tenants
• specialist providers, with specific purposes or functions such as tenancy management or
housing development, or for specific target groups (including people with disabilities)
• broad service-delivery organisations, which provide housing and other welfare services, such
as aged care and disability services
• vertically integrated providers of affordable housing, which are involved in all stages of
providing affordable housing, from construction to property and tenancy management
• community ownership and/or management, where housing is owned and/or managed by
not-for-profit or community housing associations
• joint ventures and housing partnerships, where church and welfare entities, local government
and private sector and other organisations provide resources in cooperation with state and
territory governments, or where groups of community housing providers form partnerships
to maximise growth opportunities, share resources and/or manage risks
• equity-share rental housing, where housing cooperatives wholly own housing stock and
lease it to tenants (who are shareholders in the cooperatives and therefore have the rights
and responsibilities of cooperative management).
2 https://www.australia.gov.au/about-government/how-government-works
06United States
In the United States, the Office of Affordable Housing Programs within the Department
of Housing and Urban Development administers two grant programmes designed to
increase the stock of housing that is affordable to low-income households. The larger
programme, the Home Investments Partnerships Program, provides grants to states and
local governments that include funding for building, built or ‘rehabilitating’ housing for rent
or ownership by low-income families.
In the 2018 fiscal year, US$967 million was spent on contributing to the costs of 25,000
properties. From current data on committed projects, new construction accounts for 60
percent of funding, renovation about 30 percent and buying units about 3 percent. About
three-quarters of activity is for rentals and 17 percent for units to be sold. Funding has been
falling in recent years, from a peak of around US$2 billion a year in the mid-2000s.
A second programme, the National Housing Trust Fund, provides money to support the
buying, construction or reconstruction of what we would call public housing. From a
review of materials from Washington State, it seems the funds are distributed to affordable
housing projects through a competitive application process, and generally serve people with
incomes below 30 percent of the median income in their areas.
These two grant programmes sit within a wider set of policy efforts and programmes,
including a large state-supported mortgage insurance programme that is covered later
in this paper.
United Kingdom Housing Associations and private social housing providers
The social housing sector in England is diverse in both the size of providers that operate within
it and the range of activities each undertakes. In total there are around 1,500 active providers,
of which the majority have fewer than 1,000 homes.
Currently social housing stock owned by private social housing providers exceeds 2.8 million
units/bed spaces and has had year-on-year growth. In the year ended March 2018 the social
housing sector delivered a surplus (£3.7 billion, representing a 5 percent increase from 2017)
used to support additional borrowings to fund capital investment. Profits are reinvested in
homes and communities.
One in 10 people lives in a housing association home. In 2017 the associations built more than
41,500 new homes, which represented 26 percent of the new homes in England. These new
homes added an estimated £1.75 billion to England’s economy and supported more than 31,000
full-time jobs. For every £1 of public money associations receive for building new houses,
they invest another £6 of their own or from private finance. Housing associations help people
onto the housing ladder, currently providing 169,000 shared ownership homes (https://www.
housing.org.uk/about-us/about-our-members/about-housing-associations).
07WELFARE AND HOUSING INTERFACE – EVIDENCE AND POLICY OPTIONS
The third-sector social housing range covers five main activities:
• Low-cost home ownership/affordable home ownership – occupied or made available
for occupation in accordance with shared ownership arrangements, equity percentage
arrangements or shared ownership trusts; it is made available to people whose needs are
not adequately served by the commercial housing market. The landlord retains the freehold
interest in the property where the purchaser has not acquired 100 percent of the equity in
the property. The purchaser may have the right to staircase their ownership of the equity
over time but has not yet stair-cased to 100 percent. It also includes properties where
the maximum equity share is restricted to below 100 percent. Low-cost home ownership
represents 6.2 percent of third-sector provision.
• General needs housing – housing for rent that is not designated for specific groups or
investment programmes. This represents the majority of private housing provision, at
76.3 percent.
• Supported housing – purpose-designed or designated supported housing, at 4.9 percent.
• Housing for older people – available exclusively for older people and fully meets specific
regulations, at 9.4 percent.
• Non-social rented and non-social leased housing – encompasses all rented and leasehold
properties belonging to private providers that do not meet the definition of social
housing. This includes properties developed for rental on the open market, key worker
accommodation and student accommodation at 3.2 percent.
New Zealand
There have been small efforts to boost third-sector provision in New Zealand:
• The Housing Innovation Fund was established in 2003 to support the growth of small
community housing organisations. It ran until 2010-2011, in which time 505 housing
units were built by community housing providers and local government agencies, with
total funds of $140 million and an average of $277,000 per unit (New Zealand Productivity
Commission, 2012:226).
• The Social Housing Unit was established within the then Department of Building and Housing
in 2011 as an interim institutional arrangement to fund the expansion of social housing
providers for 2011-2012. $35.35 million was allocated to the new Social Housing Fund for
building houses (New Zealand Productivity Commission, 2012:221). This function was picked
up by the Ministry of Social Development in 2014 when it took over the roles of assessing the
need for social housing and purchasing housing to meet that need.
• In 2016 and 2017 the government transferred stock from HNZ to not-for-profit housing
providers in Tauranga and Tāmaki in Auckland. It also adjusted contractual terms to enable
longer-term contracts with community housing providers and to pay more than the standard
subsidy amount to make it easier for providers to attract capital and reduce the uncertainty
involved in expanding their housing stock.
The community housing sector has expanded quickly in recent years, now providing about
8 percent of occupied public housing places. There is an increasing number of partnering
opportunities and larger providers able to embark on larger-scale developments.
08State-supported building
programmes
From a brief review of the situation in Australia, the US and the UK, and OECD data, it seems
common to have direct government support for house building or redevelopment, but there are
few government entities directly building houses.
The UK has a long tradition of public housing, with local councils and not-for-profit housing
associations providing both rental and home-ownership options for those on low incomes.
The government also requires housing developers to provide some public housing within
new developments through rules imposed on local authorities as one way to ensure that
more affordable housing is built. However, it does not build houses directly.
There have also been some more direct efforts to encourage house building from devolved
governments. For example, the Welsh government has a target to boost the affordable
housing supply by 20,000 homes between 2016 and 2021. As part of that, it has put £90
million into the Innovative Housing Programme, a three-year contestable fund to deliver
1,000 new, high-quality, affordable homes. The Programme is also intended to trial new
models of housing provision to address other needs, such as minimising the cost of heating,
providing emergency housing and reducing carbon emissions.
HNZ’s work to increase public housing in New Zealand includes a pipeline of approximately
2,600 additional state houses through the Auckland Housing Programme and approximately
460 state houses in the rest of New Zealand. HNZ is in the process of reviewing and improving
operational policies to focus on the needs of its tenants with a view to helping them sustain
their tenancies, and establishing an intensive tenancy management team to improve its service
delivery for tenants with high needs.
In Budget 2018 the Government committed to increase public housing, with at least 1,000 net
new houses per year (over four years) on average being HNZ homes. In addition to funding
the extra public housing, HNZ is investing a further $1.8 billion in purchasing more homes and
upgrading and improving its existing stock.
KiwiBuild is a multi-billion-dollar development programme with the aim of delivering 100,000
homes for first-time buyers in the next 10 years. Projections are 1,000 KiwiBuild homes by June
2019, 5,000 homes by June 2020 and 10,000 homes by June 2021. The initial focus is on areas
with high housing demand and affordability pressures.
On 24 November 2018 the Minister of Housing and Urban Development announced that a new
authority would be responsible for leading the Government’s large-scale urban development
projects. The new Housing and Urban Development Authority will bring together functions
from the Ministry of Business, Innovation and Employment, HNZ, its subsidiary HLC and the
KiwiBuild Unit.
09WELFARE AND HOUSING INTERFACE – EVIDENCE AND POLICY OPTIONS
Examples of how systems
incorporate the preferences
of those being assisted
(in particular how they ensure that housing development
is culturally appropriate to the intended occupants)
Australia and Canada have specific housing programmes for indigenous peoples.
In Australia there are four major public housing programmes, of which two are only open to
Aboriginal and Torres Strait Islander tenants. State-owned and Managed Indigenous Housing
comprises rental properties owned and managed by state housing authorities, including
indigenous housing agencies. Indigenous Community Housing (ICH) refers to dwellings that
are managed by ICH organisations and community councils. They can be owned or leased
(Australian Institute of Health and Welfare, 2014).
In Canada there is a set of programmes designed to provide and improve housing for
indigenous people who live on reserves, as part of a 10-year housing strategy that was
developed with indigenous people. The programmes include support for both rental and
ownership developments, as well as efforts to improve market-provided housing through easier
access to loans. Funding levels are substantial, with about C$200 million a year proposed in the
2017 and 2018 budgets.
The government has also announced an innovation competition, with up to C$30 million
available to fund new approaches to the design and construction of homes for indigenous
people, both on and off reserves, with the first funds to be awarded in 2019.
These schemes have some similarities to the Māori Housing Network, established by Te Puni
Kōkiri to support Māori-led housing initiatives, and Te Ara Mauwhare, a $9 million, three-year
project to trial new models to assist low- to median-income Māori whānau to move towards
home ownership. The first trial has been announced and six further trials are in co-design, with
rent-to-own, shared-equity and collective ownership models all part of the mix.
In general, the public housing system in New Zealand provides limited scope to respond to
tenant preferences, as compared with the private housing market. Public housing tenants have
few choices of places to live or typologies that they might prefer, and it is hard for them to move
houses if their circumstances or preferences change.
10Innovative housing financial
products
There are various examples of housing financial products designed to support those building
affordable housing or help people renting to become home owners.
The Australian Government established an Affordable Housing Working Group in 2016 to
investigate ways to boost the supply of affordable rental housing through innovative financing
models. The intention is to boost supply by public housing providers and in the private rental
market for low-income and disadvantaged households.
The idea is to overcome the lack of interest that institutional investors are showing in affordable
housing due to perceptions of risk and comparatively low returns.
The Affordable Housing Working Group consulted on four possible models: a housing bond
aggregator, a housing trust, housing cooperatives and social impact investing bonds. It
concluded that the bond aggregator model provided the best likelihood of helping investment
at the scale needed. The model involves the creation of a financial intermediary to combine
the borrowing of affordable housing providers and to issue bonds on their behalf. The potential
benefits of the model include allowing providers to refinance existing borrowings and finance
new developments on longer timeframes and at lower cost. The Working Group also noted that
the housing trust model was well supported by stakeholders and should be investigated further
as it too could provide affordable housing at the significant scale needed (Council on Federal
Financial Relations, 2016:2).
In the US, the most important instrument for affordable housing provision is the
Low-Income Housing Tax Credit. States and local government entities issue tax credits to
people who buy, renovate or build rental housing for lower-income households. Owners of
qualified projects can use these credits to offset their other tax liabilities for a period of 10
years. Typically, developers will sell their tax credits to outside investors as a way to reduce
the financial contributions they need to make to their projects, and those lower costs end up
being reflected in lower rents.
The programme is estimated to cost the federal government US$9 billion a year and deliver
about 90,000 homes. There are various ways for a project to qualify:
• One way is to ensure that at least 40 percent of the units in the development are let at
affordable rents and occupied by people whose incomes are no more than 60% of the
median gross income in the area.
• Additionally, the Federal Housing Administration offers mortgage insurance that is
cheaper than market options for people with poor credit histories or low deposits.
This is not specifically aimed at affordable housing, but there might be overlaps
in the population who benefit. It has no fiscal cost, being funded from premiums
from home owners.
Gibb et al (2013) reviewed recent international experiences with innovative financing systems
for affordable housing and provided some lessons. They noted that the scope for innovation
is linked to the regulatory context, which includes not only social housing regulation but also
financial regulation and accounting frameworks. While they counsel caution with the adoption
of state-backed guarantee schemes, these schemes are one of a number of international
examples seen to have potential. Others include:
11WELFARE AND HOUSING INTERFACE – EVIDENCE AND POLICY OPTIONS
• the Spanish Vivienda de Protección Oficial (VPO, literally ‘officially protected housing’) – a
developer/occupier new supply subsidy that uses a combination of supply- and demand-side
subsidies. This has provided scale, responsiveness and an efficient subsidy but, while
means tested, is less tightly targeted and has somewhat succumbed to the economic
crisis. It is flexible in principle if not completely transparent. Spain has the highest level of
owner-occupation in Europe, with a strong tradition of the state promoting house building.
Since 1978 VPO has added more than one million units to the housing stock. The scheme
provides a subsidy to the developer (private, public, union etc), which is then passed on,
usually in the form of a mortgage, to the resident
• the Australian National Rental Affordability Scheme3 (NRAS) tax credit application of
the US Low-Income Housing Tax Credit model. The competition among providers and
opportunities to blend subsidy and beneficial placemaking (designing and managing public
spaces through ongoing consultation with the local community) are attractive innovations.
NRAS targets moderate-income households with a capped subsidy, and can operate
responsively and to scale
• the Danish housing association national building fund4. Based on solidarity principles, this
allows the creative use of surplus funds, although the government may simply offset the
Fund with a lower subsidy. New housing is financed in part by capital grants (typically 14
percent), but mostly by private-sector loans (typically 84 percent). There are three important
differences, however: a small tenant contribution (2 percent) is required; the municipality
guarantees the loan; and there is also a revenue subsidy paid in the earlier years of the loan
to smooth out rental payments. An important contextual difference is that Denmark has one
of the lowest levels of income poverty and inequality in Europe, and related to this, housing
associations house a broader section of the population
• the Irish model of private renting with discounted long-lease rents. This addresses work
incentives and augments affordable supply by binding private landlords into long leases and
sub-market rents. This model has grown quickly in Ireland and may act to limit future social
security expenditure
• the Scottish National Housing Trust, which provides state-backed loan guarantees with
marginal public finance commitment
• Canadian programmes that help people to become home owners through initiatives such
as a C$750 federal tax credit for first-home buyers, a way to withdraw up to C$25,000
from retirement savings schemes to buy or build a house, and a rebate scheme for some
of the sale tax paid on the purchase price or cost of building or renovating or converting a
non-residential property into a new home.
The UK government has a set of schemes designed to help people buy houses and
encourage new builds:
• There is an equity loan scheme called Help to Buy: Equity Loan, which lends up to 20 percent
(40 percent in London) of the value of a newly built home, with no interest being due on the
loan for the first five years.
• There is a scheme called Help to Buy: Shared Ownership, which enables first-home buyers to
buy between 25 percent and 75 percent of a home, paying rent on the remainder and buying
bigger shares later on.
• People saving for first homes through special retirement savings accounts can get
government-funded 25 percent boosts to their savings up to a maximum of £3,000.
3 https://www.qld.gov.au/housing/renting/rent-assistance/nras
4 http://www.housingeurope.eu/resource-102/social-housing-in-europe
12• A Right to Buy scheme gives some council and housing association tenants in England the
chance to buy the homes they live in with substantial discounts. A tenant has the right to buy
when they have spent at least three years as a public-sector tenant. The longer the period
as a tenant, the higher the discount. The maximum discount is £78,600 (excluding London
where it is £104,900) and it is increased annually if the consumer price index increases.
Recent research by the Australian Housing and Urban Research Institute (AHURi) concluded
that of five social housing investment models considered, the capital grant model was the most
cost-effective pathway. The five investment pathways are:
Scenario Definition
1 Operating subsidy Base case, funding gap is supported by an annual
operational subsidy payment that supports paying for
finance (where all the required debt is taken out by the
provider in the expectation of future subsidy support).
2 Operating subsidy + National Housing Builds on Scenario 1 but applies an interest rate deduction
and Finance Investment Corporation on private finance of 1.5 percent, which is consistent with
(NHFIC) bond aggregator estimated impacts of a bond aggregator on the cost of
private finance.
3 Up-front capital grant As an alternative to private debt, a capital fund invests in
developments, which reduces the level of required subsidy
because it eliminates financing costs.
4 Up-front capital grant + NHFIC Introduces an interest rate deduction on the capital grant
bond aggregator model, similar to that of Scenario 2. This reduces the
interest rate of finance from an assumed market rate of
5 percent per annum to 3.5 percent per annum.
5 Up-front capital grant + NHFIC bond Commonwealth Rent Assistance (CRA) is appropriately
aggregator, but with no CRA conceptualised as tenant income and not as a cost in
delivering new housing developments. Models the impact
of excluding CRA payments from a capital grant model.
AHURi also found that “demand side subsidies alone cannot increase supply of social housing
and are particularly ineffective where provision is for profit, rents are deregulated and
vacancies are low”.
There is also a set of small home-buyer support schemes in New Zealand. These include:
• the Welcome Home Loan programme, which enables buyers with gross incomes under
$85,000 to buy houses with a 10 percent rather than 20 percent deposit
• the Kāinga Whenua Loan Scheme5, which provides loans for people building, purchasing or
relocating houses on Māori land
• the KiwiSaver HomeStart grant6, which gives people who have been contributing to KiwiSaver
a subsidy of up to $5,000 to buy first homes. Additionally, all KiwiSaver members can
withdraw their savings to purchase first homes.
5 https://www.hnzc.co.nz/ways-we-can-help-you-to-own-a-home/kainga-whenua/
6 https://www.hnzc.co.nz/ways-we-can-help-you-to-own-a-home/kiwisaver-homestart-grant/
13WELFARE AND HOUSING INTERFACE – EVIDENCE AND POLICY OPTIONS
HNZ runs a home-ownership programme for tenants, mainly in areas with low or no demand
for public housing. The Tenant Home Ownership7 programme has sold 322 houses to tenants
since the programme was introduced in 2009.
Examples of not-for-profits involved in housing schemes include:
• small-scale shared-equity options: Housing Foundation, Queenstown Lakes Community
Housing Trust, Dwell Housing Trust and Marlborough Sustainable Housing Trust
• rent-to-buy scheme: Housing Foundation
• sweat equity and rent-then-buy scheme: Habitat for Humanity.
The Ministry of Housing and Urban Development has noted that the government committed as
part of KiwiBuild to introduce a rent-to-own or similar progressive home ownership scheme.
Historically New Zealand has had a more extensive set of options to help people into home
ownership, including subsidised mortgages for low-income families and more proactive
programmes for sales of houses to tenants. It was also possible to capitalise the Family Benefit,
a universal welfare payment to families with children, to provide a deposit for a home.
If there were to be a further expansion of these demand-side schemes, the interface with the
benefit system would need investigation. The capitalisation of Accommodation Supplement
has been suggested as a way to provide deposits for home ownership. The New Zealand
Productivity Commission (2012:210) was sceptical that the numbers would be made to work
if this were to be fiscally neutral, especially because house prices are out of line with rents at
present. Servicing a mortgage together with rates and maintenance would consume a higher
proportion of income than renting with an Accommodation Supplement payment.
As one example, Victoria in Australia offered a 12-month moratorium on rent increases for
tenants in public housing, who increased their incomes, to try to reduce the disincentive to
improve their circumstances.
7 https://www.hnzc.co.nz/ways-we-can-help-you-to-own-a-home/tenant-home-ownership/tenant-home-
ownership-programme-with-the-firsthome-grant/
14Social and economic impacts of
housing tenure
Long-term residence in social housing can be detrimental
Many studies in the UK and US conclude that long-term residence in social housing can in
fact stall residents’ outcomes and reduce life chances (e.g. Feinstein et al., 2008). Residing in
social housing as a child is significantly associated with a range of negative social outcomes
in adulthood (e.g. young parenthood, lack of qualifications, and mental health problems
such as depression, anxiety and psychosocial dysfunction). While it is difficult to isolate the
effects of social housing, Feinstein et al (2008:10) state that “at the very least, it appears
from these findings that social housing policy has not overall been a sufficient response to
individual and household disadvantage”.8
Home ownership may provide a platform for helping children do
better in schools
Home ownership is associated with improved housing conditions, more residential and
household stability, an avoidance of financial exclusion and insecurity, and its positive
effects on wider attitudes and behaviour. There is some evidence that home ownership
has an additional effect on school attainment beyond that explained by poverty and other
associated variables, although there is some uncertainty about how separable these effects
are at school and neighbourhood levels. Changing the tenure mix in housing regeneration
changes the overall profile of neighbourhoods and schools (Bramely & Karley, 2007).
Housing tenure is a significant factor for positive social and economic outcomes. Home
ownership, as opposed to renting, is often significantly associated with positive health, crime
and educational outcomes in studies, usually even after controlling for a range of variables
including socio-economic status and income. This means that the findings pertaining to
better outcomes as a result of greater security of tenure, through either rental or ownership,
cannot simply be discounted on the basis of the wealth of the household. The majority of
studies find significant positive effects of home ownership under each of six categories: health,
employment, crime, welfare, wealth and education (Waldegrave & Urbanova, 2017; Waldegrave
et al., 2017).
The burden on the government’s fiscal accounts from social renters, compared to both
private renters and owner-occupiers, on a per capita basis is quite significant. These fiscal
impacts focus on three main costs to the government: health (hospitalisation), corrections and
benefit payments.
8 The relationship between different dimensions of housing and social outcomes is complex and determining causality is
problematic. Affordable, appropriate housing is necessary but not always sufficient to achieve many social outcomes –
especially where people are experience multiple disadvantages. Feinstein et al (2008) argues that social housing policy
has become disconnected from efforts elsewhere to improve people’s life chances. They conclude that social housing
has become an indicator of risk for adult life chances.
15WELFARE AND HOUSING INTERFACE – EVIDENCE AND POLICY OPTIONS
Annual per capita cost
Owner-occupiers Renters Social renters
Public hospital admissions 5,260 6,237 7,813
Corrections 54 273 554
Ministry of Social Development benefits 302 1,910 1,480
The difference in the average annual per-capita cost of social renters compared to
owner-occupiers is marked (Nana et al., 2017).
Additional New Zealand research to estimate the impacts on government fiscal costs of
transitioning 1,000 social renters towards owner-occupancy shows that a net fiscal saving over
the 15-year horizon, discounted at 3 percent per annum, accrues to a value of $11.1 million
(Nana et al., 2017).
The use of regulatory approaches
to manage security of tenure,
housing quality and rental
affordability
This paper sets out some preliminary observations on general regulatory approaches in different
jurisdictions to housing security, quality, affordability and accessibility. Most of the observations
on other countries are sourced from information in the OECD Affordable Housing Database.
Security of tenure
Across countries, there are significant variations in the circumstances in which landlords
have the right to terminate tenancies. However, common circumstances include if the tenant
does not pay rent or damages the property or if the landlord needs to occupy the rental
property to live in.
New Zealand has very short notice periods for tenants to terminate tenancies in comparison
with other countries. The standard durations are 90 days for landlords (or 42 days in some
circumstances) and 21 days for tenants.
The Government is considering reforms to the Residential Tenancies Act 1986, and a discussion
document was released for consultation in September-October 2018. The primary objective of
the reforms is to improve tenants’ security and stability of tenure. Proposals include removing
landlords’ ability to end periodic tenancies at any time without having to give reasons (so
called ‘no cause’ terminations), making the notice period for landlords 90 days for all tenancy
terminations, and allowing rent to be raised only once per year (instead of every six months as is
currently the case unless otherwise specified in a fixed-term tenancy agreement).
16Minimum quality regulations
The OECD (2016) indicators of housing quality focus on housing space, percentage of
households living without indoor flushing toilets, and severe housing deprivation.
The Healthy Homes Guarantee Act 2017 made changes to the Residential Tenancies Act that
will allow for the introduction of new minimum standards for insulation, heating, ventilation,
draught stopping, drainage and moisture ingress for all residential rental premises. These
minimum standards are being developed and the changes will come into force on 1 July 2019.
Compliance with the minimum standards will be required before 1 July 2024. All landlords still
need to make sure their properties are insulated (unless an exception applies) before 1 July 2019.
Rental affordability
Some countries have rent-control protections. In Sweden’s case this is in the rental sector.
In other countries (e.g. Austria, Denmark and the US), rent control in the private rental sector
only applies to older housing stock. Of the OECD countries where information is available,
most regulate the rate at which rents can be increased during rental contracts and/or the
frequency of such increases.
Other regulatory supports that are common include housing allowances, social housing
and financial support for home buyers (e.g. grants, subsidised mortgages and mortgage
guarantees). Many countries also support access to home ownership through tax relief
(e.g. exemptions from property transfer tax, stamp duty, legal fees and the deductibility
of mortgage interests).
Proposals to limit rent increases are being considered as part of the reforms of the Residential
Tenancy Act. This reform is considering options to address the practice of rental bidding
(where a prospective tenant offers more than the advertised rent for a property). The potential
impacts of this practice could include a push-up in overall rental prices, particularly in areas
of high demand.
There is also a bill before the House that prohibits letting agents, or any person, from requiring
tenants to pay letting fees, or any other fees, in relation to tenancies.
17WELFARE AND HOUSING INTERFACE – EVIDENCE AND POLICY OPTIONS
Definitions of housing affordability
Housing affordability is generally a measure of housing costs (rents or house prices plus other
costs of home ownership such as rates and insurance) against a measure of income.
There are many ways to define the relevant housing costs and income measures, and there is no
objectively right method. The most useful definition will depend on the situation that one wishes
to measure, and therefore on the policy problems on which one is focused, as well as the data
that is available.
One distinction is between simpler ratio measures that might compare the lower-quartile
cost of housing with lower-quartile household incomes, and more complex residual income
measures that try to get at the capacity of a household to maintain an acceptable standard of
living after housing costs are paid (Gabriel et al., 2005).
Another distinction is between point-in-time measures, for example the proportion of
households that own their own houses by income quintile, and measures that take into account
the persistence of housing affordability issues over time for individual households (Borrowman
et al., 2015).
It is common to separate a measure of affordability for home buyers from affordability for
renters. The (now disestablished) National Housing Policy Advice Unit in the UK proposed three
affordability indicators (Wilson & Barton, 2018:14):
• The deposit measure: the deposit required as a proportion of take-home household income.
• Mortgage costs: mortgage costs as a proportion of take-home household income.
• Rents: rent as a proportion of take-home household income.
The overall measurement is typically at a household level, in keeping with the nature of housing.
The variety of household structures and preferences, and the differences in costs of different
housing options in different places, plus the varying costs of finance, make comprehensive
measurement difficult and mean that a measure can only be an indication of actual
circumstances.
One common threshold for housing stress is where housing costs are more than 30 percent of
gross income. Since the focus is on low- and low-middle-income households, the question of
interest is how housing costs look for the bottom two household income quintiles. The picture
for these groups is notably different (and worse) from the average for everybody.
There are various other examples of measures.
Ministry of Business, Innovation and Employment
Housing Affordability Measure
The Ministry of Business, Innovation and Employment (MBIE) calculates a Housing Affordability
Measure from Census household income data and data on rent and mortgage costs. There
are two measures, one for potential first-home buyers and one for renters. In each case the
measure compares the income after housing costs for that group with the national median
household income after housing costs.
The measure is calculated using unit-record household income Census data adjusted for
inflation, less either rent data from tenancy bonds (for the rental measure) or mortgage
payments, rates and insurance (for the potential first-home buyers measure). The remaining
household income is adjusted for household composition, to reflect the fact that larger
households need larger incomes.
18The proportion is produced quarterly to March and can be broken down by region, territorial
authority and ward in Auckland.
The measures show how the financial positions of potential first-home buyers and renters, after
paying housing costs, compare with the positions of all households. They give a relative picture
of the positions of renters and potential home buyers in different locations around the country
and how those are changing over time.
MBIE also calculates the proportion of households spending more than 30 percent of their
incomes on housing.
Productivity Commission
The Productivity Commission (2012:59) reviews the following measures of housing affordability:
• The ratio of house prices to income, which shows the number of years of household
disposable income needed to cover the purchase price of a house. It has the virtue
of simplicity.
• A measure of ‘borrowing capacity’, which measures the amount a household earning
the median income, could borrow via a table mortgage at the effective mortgage rate.
This measure takes account of changes in financing costs, which are a big influence on
affordability in practice, but does not directly reflect movements in house prices.
• Massey University’s Housing Affordability Index, which is calculated using data on median
house prices from the Real Estate Institute of New Zealand, average earnings from Stats
NZ and interest rate data from the Reserve Bank of New Zealand. It therefore includes both
housing costs and financing costs. It is produced quarterly with a breakdown into 12 regions.
These are all nominal measures. It is also possible to calculate an affordability index based on
real prices, which recognises that in a table mortgage, where nominal payments are the same
throughout its term, payments get cheaper in real terms over time due to inflation.
Measures of affordability can be disaggregated in various ways. The Productivity Commission
calculates a measure of the proportion of those aged 25 or over who could afford to purchase
lower-quartile-priced houses in their regions without mortgage payments exceeding 30 percent
of their gross incomes. It breaks down this measure by income levels, between singles and
couples, by age group, by ethnic group and by region.
For renting affordability, the Productivity Commission reports median rent levels as a proportion
of household disposable income. It then breaks these down by income quintile.
It notes (page 68) that none of these measures says anything about the suitability of houses for
their occupants. There is evidence of widespread quality issues with rental housing in particular.
OECD measures
The OECD maintains an Affordable Housing Database, with data on various measures of
affordability across countries, including expenditure on housing as a proportion of household
expenditure, housing costs as a proportion of income, and the ability of households to keep
their dwellings warm. It also maintains a set of house price indicators, including a ratio of house
prices to prevailing rents and to incomes.
It also refers to the “housing cost overburden rate”, which measures the proportion of
households or the population that spends more than 40 percent of their disposable
incomes on housing.
19WELFARE AND HOUSING INTERFACE – EVIDENCE AND POLICY OPTIONS
Other countries
At the federal level, the United States Department of Housing and Urban Development considers
that families that spend more than 30 percent of their incomes on housing are “cost burdened”
and likely to have difficulty with other necessities.
The US National Association of Realtors publishes a monthly index of housing affordability based
on the proportion of the median family income required to purchase an existing median-priced
single family home (National Association of Realtors, 2018). It is built on some assumptions
about financing arrangements and prevailing mortgage rates. It is disaggregated into four
macro regions.
In Australia, the Australian Bureau of Statistics and various housing industry associations publish
ratios of house prices or housing expenditure to household incomes. There are also more
academic residual income measures, typically published by researchers or academics (Thomas
and Hall, nd).
20References
Australian Housing and Urban Research Institute Unit, Lawson, J., Pawson, H., Troy, L., van den
Nouwelant, R., and Hamilton, C. (2018) Social Housing as Infrastructure: An Investment Pathway,
AHURI Final Report 306, Melbourne.
Australian Institute of Health and Welfare (2014) Housing Assistance for Indigenous Australians.
Australian Institute of Health and Welfare (2018) Housing Assistance in Australia 2018.
Australian Productivity Commission (2017) Report on Government Services 2017,
Chapter 18: Housing.
Borrowman, L., Kazakevitch, G., & Frost, L. (2015) How Long Do Households Remain in Housing
Affordability Stress?, Monash University, Department of Economists, Discussion Paper 42/15.
Bramley, G. & Karley, N. (2007) Homeownership, Poverty and Educational Achievement: School
Effects as Neighbourhood Effects. Housing Studies, Vol. 22, No. 5, 693–721, September. http://
web.ebscohost.com/ehost/pdfviewer/pdfviewer?sid=3374eb30-7fd8-4f2e-8c90-a048669c43
12%40sessionmgr112&vid=2&hid=119
Council on Federal Financial Relations (2016) Innovative Financing Models to Improve the
Supply of Affordable Housing, Affordable Housing Working Group Report to Heads of Treasuries.
Feinstein, L., Lupton, R., Hammond, C., Mujtaba, T., Salter, E. & Sorhaindo, A. (2007) The public
value of social housing: A longitudinal analysis of the relationship of housing and life chances.
Centre for Research on the Wider Benefits of Learning, Institute of Education, University of
London http://www.learningbenefits.net/Publications/DiscussionPapers/Public%20value%20
of%20social%20housing%2008-01.pdf
Gabriel, M., Jacobs, K., Arthurson, K., Burke, T., & Yates J. (2005) Conceptualising and measuring
the housing affordability problem. National Research, Venture 3: Housing Affordability for Lower
Income Australians, Research paper.
Gibb, K., Maclennan, D., & Stephens, M. (2013) Innovative Financing of Affordable Housing:
International and UK Perspective. York: Joseph Rowntree Foundation.
Johnson, A., Howden-Chapman, P., & Eaqub, S. (2018) A Stocktake of New Zealand’s Housing.
Ministry of Social Development (2018) Factsheet: Public Housing Budget 2018.
Ministry of Social Development (2018) Housing Quarterly Report June 2018.
Nana, G., Fareti, N., Hurren, K., & Dixon, H. (2017) Fiscal Costs of Different Housing Tenure
Groups: Social Renting to Housing Security Independence. Auckland: New Zealand Housing
Foundation. https://www.nzhf.org/files/Researchper cent20Papers/BERL_on_Social_renting_
to_housing_independence.pdf
National Association of Realtors (2018) Housing Affordability Index.
New Zealand Productivity Commission (2012) Housing Affordability Inquiry: Final report, March.
OECD (2016) PH5.1 Measures Financing Affordable Housing Development, Affordable
Housing Database.
OECD (2016) HC1.2. Housing Costs over Income, Affordable Housing Database.
OECD (2016) HC2.2. Living Space, Affordable Housing Database.
OECD (2016) PH1.1 Policy Instruments and Level of Governance, Affordable Housing Database.
OECD (2016) PH2.2 Tax Relief for Access to Home Ownership, Affordable Housing Database.
OECD (2016) PH6.1 Rental Regulation, Affordable Housing Database
21WELFARE AND HOUSING INTERFACE – EVIDENCE AND POLICY OPTIONS
Thomas, M. & Hall, A. (nd) Housing Affordability in Australia. https://www.aph.gov.au/
About_Parliament/Parliamentary_Departments/Parliamentary_Library/pubs/BriefingBook45p/
HousingAffordability
Waldegrave, C. & Urbanova, M. (2017) Social and Economic Impacts of Housing Tenure.
Auckland: New Zealand Housing Foundation. http://www.familycentre.org.nz/Publications/
PDF’s/Social_and_Economic_Impacts_of_Housing_Tenure.pdf or http://www.nzhf.org/files/
Researchper cent20Papers/Social_and_Economic_Impacts_of_Housing_Tenure_FCSPRU.pdf
Waldegrave, C., Nana, G., & Fareti, N. (2017) Housing Tenure: A Brief Synthesis of Two Studies
Including a Review of the International Literature and an Assessment of Long Term Fiscal Costs
in New Zealand. Auckland: New Zealand Housing Foundation. https://www.nzhf.org/files/
Researchper cent20Papers/Synthesis_Summary_FCSPRU_and_BERL_Reports.pdf
Wilson, W. and Barton, C. (2018) What is affordable housing?, House of Commons, Briefing
Paper Number 07747, 21 September 2018
Web materials
https://gov.wales/topics/housing-and-regeneration/housing-supply/innovative-housing-
programme/?lang=en
https://impact.canada.ca/en/challenges/indigenous-homes
https://impact.canada.ca/en/challenges/indigenous-homes
https://seneddresearch.blog/2018/07/05/what-next-for-affordable-housing-in-wales/
https://www.aph.gov.au/About_Parliament/Parliamentary_Departments/Parliamentary_
Library/pubs/BriefingBook45p/HousingAffordability
https://www.beehive.govt.nz/release/kiwibuild-pre-qualification-opens]
https://www.beehive.govt.nz/release/new-urban-development-agency-unveiled-build-more-
homes
https://www.commerce.wa.gov/building-infrastructure/housing/housing-trust-fund/
http://www.familycentre.org.nz/Publications/PDF’s/Social_and_Economic_Impacts_of_
Housing_Tenure.pdf
https://www.hud.gov/program_offices/comm_planning/affordablehousing
https://www.hud.gov/program_offices/housing/fhahistory
https://www.hud.govt.nz/news-and-resources/consultations/consultation-reform-of-the-
residential-tenancies-act-1986/
https://www.hnzc.co.nz/news/latest-news/budget-2018-more-public-houses-to-be-built/_
https://www.hnzc.co.nz/news/latest-news/2018-public-housing-plan/
https://www.nzhf.org/recent-news/80-new-housing-research
https://www.nzhf.org/files/Researchpercent20Papers/BERL_on_Social_renting_to_housing_
independence.pdf
https://www.nzhf.org/files/ResearchPapers/Social_and_Economic_Impacts_of_Housing_
Tenure_FCSPRU.pdf
https://www.ownyourhome.gov.uk/schemes-all/
http://www.oecd.org/social/affordable-housing-database.htm
22WELFARE AND HOUSING INTERFACE – EVIDENCE AND POLICY OPTIONS 24
You can also read