Results Presentation Presenter Name - 31 December 2020 For the half year ended - AFR
←
→
Page content transcription
If your browser does not render page correctly, please read the page content below

Results
Presentation
For the half year ended
  31 December 2020
  Presenter Name
Agenda

Overview              Marnie Baker

1H21 financials       Travis Crouch

Questions         Presenter  Name
                     Marnie Baker, Travis Crouch, Taso Corolis

                                                                 22
Overview
Marnie Baker
Managing Director

                    3
1H21 Overview
    Strong and resilient business performance

                                                                                                                                                    1
                                                                                    •     Total lending growth of 9.2% against 0.1% system growth
                                       Delivery                                     •     Total deposit growth of 16.9%, 2.2x system
                                                                                                                                       1

                                                                                    •
                                       of strategy                                        Cost transformation program contributing towards the 3.1% reduction in
                                                                                          operating expenses

                                                                                    •    Continuing to support our customers through COVID-19
                                                                                    •    Unique business model supporting communities across Australia
                                       Purpose
                                                                                    •    Playing our part, and assisting our customers and their communities to play
                                       in action                                         their part, in the transition to a sustainable and low carbon economy
                                                                                    •    Ongoing dedicated bushfire recovery support program

                                                                                    •    Underlying asset quality sound, with COVID-19 deferrals reduced by 90.5%
                                                                                         since peak to represent 0.98% of gross loans as at 31 January 2021
                                       Strong                                       •    Continued strong deposit funding and liquidity position with customer deposits
                                                                                                                                                 2
                                       financial                                         representing 77.3% of total deposits and LCR of 139%
                                                                                    •    Interim dividend of 23.5c and FY20 final dividend of 4.5c, with a DRP discount
                                       position                                          of 1.5% and fully underwritten
                                                                                    •    Strong capital position with CET1 increasing 11bps to 9.36%3
1 APRA Monthly Banking Statistics 2020. Data is an annualised growth rate based on a 6-month period (30/06/20 – 31/12/20)
2 Liquidity Coverage Ratio represents average daily LCR over respective 6 monthly period to 31 December 2020
3 As at 31 December 2020

                                                                                                                                                                          4
Key measures
    Continued strong growth with heightened cost focus
                                                                                                                                                                                                          32.0           29.0
                                                                                                                                                                                        24.6

      Customer
                                                                                                   1.96m
                                                                                                                                       Net promoter
                                                                                 1.88m                                                       3                                                                                   2.2
      numbers                                                 1.79m                                                                    score                                                     -0.7            -1.0

                                                              Dec-19             Jun-20            Dec-20
                                                                                                                                                                                          Dec-19           Jun-20         Dec-20

                                                                 75.44%
                                                                                    75.08%
                                                                                                        74.92%                                                                                            48.0           47.3
      Market                                                                                                                            MFI business                                    46.1
            1                                                                                   2.34%                                       4
      share                                               2.18%              2.24%                                                      NPS
                                                                                                                                                                                               -18.4             -16.0          -14.0

                                                              Dec-19             Jun-20            Dec-20                                                                                 Dec-19           Jun-20         Dec-20

      Total lending                                                           8.7%               9.2%                                  Employee                                             76%              75%           74%

      growth
              2
                                                           2.8% 0.6%
                                                                                     2.2%                                              Engagement
                                                                                                        -0.3%                                5
                                                                                                                                       Index                                              Dec-19           Jun-20         Dec-20
                                                               1H20              2H20               1H21

                                                                                                                                       Return on
       Cost to                                                                   66.1%                                                                                                    10.98%                          10.01%
                                                                                                                                       tangible equity
       income                                                 59.3%                                 60.9%                                                                                                   4.10%

                                                               1H20              2H20               1H21
                                                                                                                                       (cash)                                               1H20            2H20           1H21

1  APRA Monthly Banking Statistics December 2020
2
  APRA Monthly Banking Statistics December 2020. BEN total lending growth rate and major bank average against system
3
  Roy Morgan Net Promoter Score – Roy Morgan Research, 6 month rolling averages, comparing BEN to the industry average. Industry includes: ANZ, BOM, BOQ, Bank SA, Bankwest, CBA, ING, NAB, St. George,
Suncorp & WBC. Net Promoter, Net Promoter System, Net Promoter Score, NPS and the NPS-related emoticons are registered trademarks of Bain & Company, Inc., Fred Reichheld and Satmetrix Systems, Inc.
4 DBM Atlas (Business) MFI NPS – Total Business with
1H21 financial result
     Comparison to previous halves

                                                              1H21    1H21 vs    1H21 vs
                                                              ($m)     2H20       1H20         2H20 Statutory net
                                                                                                                 1
                                                                                               profit impacted by
         Statutory net profit1                               $243.9    419%       67%      •   COVID-19 collective
                                                                                               provision overlay of $127.7m
         Cash earnings                                       $219.7    156%        2%
                                                                                           •   Software impairment of
                                                                                               $34.8m
         Total income2                                       $849.0     5%         3%
                                                                                           •   Restructuring and other
         Cost to income                                      60.9%    (520bps)   +160bps       specific expense items of
                                                                                               $10.5m
         Return on tangible equity                           10.01%   +591bps    (97bps)
                                                                                               1H20 Statutory net
                                                                                                                 1
         CET1                                                9.36%    +11bps     +36bps        profit impacted by
                                                                                           •   Software impairment of
         Net interest margin                                 2.30%     +1bp      (7bps)        $87.1m
                                                                                           •   Accelerated amortisation
         Cash earnings per share                             41.4c     149%       (6%)         of $19.0m
                                                                                           •   Other specific expense
         Interim dividend per share                          23.5c     422%      (24.2%)       items of $3.7m

1
    Identified items are pre-tax
2   Total income includes Homesafe realised income pre-tax

                                                                                                                              6
1H21 divisional results
Cash earnings up across all divisions

                                  Cash earnings ($m)       Business division
                                                       •   Income up 7.3%
                                                       •   Opex down 12.9%
                                                       •   Cash earnings up 39.7%

Consumer division
•   Income up 3.6%
•   Opex down 1.2%
•   Cash earnings up 12.0%                             Agribusiness division
                                                       •   Income up 12.6%
                                                       •   Opex down 5.9%
                                                       •   Cash earnings up 25.8%

                                                                                    7
Supporting our customers through COVID-19
Value of loans on deferral continues to reduce

                                            COVID-19 support packages

             $6.9b
             $2.0b

            $397.3m                                                            1.6% of gross loans                     0.98% of gross loans
             $4.5b                                                       84.2% reduction since peak in           90.5% reduction since peak in
                                              $3.5b                                 June                                    June

                                              $1.8b                      Residential – 1.5%                     Residential – 0.9%
                                                                         Consumer – 2.2%                        Consumer – 1.1%
                                                                         Commercial – 2.1%                      Commercial – 1.5%

                                            $250.0m
                                                                                       $1.1b
                                             $1.5b
                                                                                       $307m                                 $659m
                                                                                                      $60.1m
                                                                                       $728m                                 $221m            $29.5m
                                                                                                                             $409m
            June 2020                     September 2020                           December 2020                           January 2021

                        Residential support packages       Consumer support packages     Commercial support packages

                                                                                                                                                       8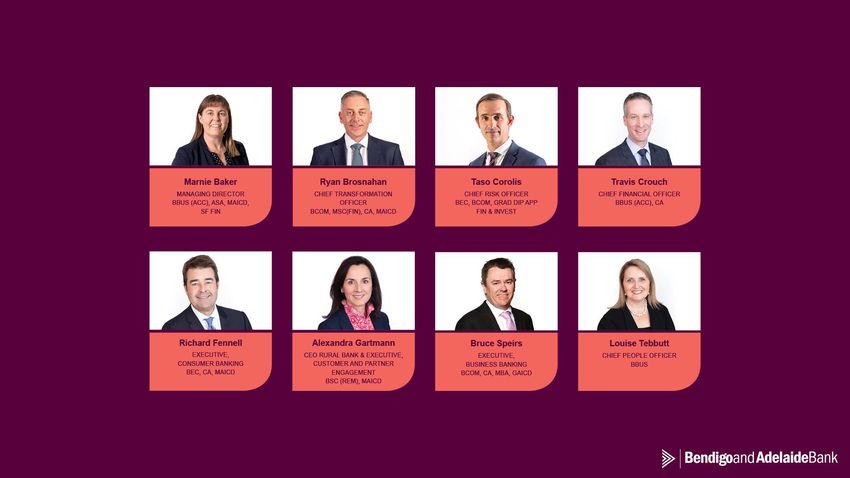
Balance sheet and dividends
Strength in balance sheet and earnings

 Well positioned balance sheet                                                FY20 final dividend declared
 •   Strong customer deposit funding at 77.3% of total                            4.5c (fully franked)
     deposits backed by wholesale funding programs
                                                                              •    Payout ratio of 49.5% of 2H20 statutory profit reflects APRA’s
 •   CET1 ratio of 9.36% is above APRA’s unquestionably                            industry guidance on dividend payments
     strong benchmark target for standardised banks                           •    Record date of 19 February, payment date of 31 March
 •   CET1 ratio includes impact of above system growth in                     •    DRP will operate with a 1.5% discount and will be fully underwritten
     residential mortgages and investment in transformation
 •   Liquidity profile remains strong with continued call
     deposit flows                                                            FY21 interim dividend declared
 •   Provision coverage ratio of 201% up from 178% at 30
     June 2020                                                                23.5c (fully franked)
                                                                     14.45%
          13.14%           13.21%                   13.61%                    •    Payout ratio of 56.8% of 1H21 cash earnings, reflecting period of
                                                                                   economic uncertainty and APRA industry guidance released in
  8.92%            9.00%              9.25%                  9.36%                 December
                                                                              •    Dividend target payout ratio of 60% - 80% of cash earnings on an
                                                                                   annual basis remains
                                                                              •    Record date of 19 February, payment date of 31 March
     Jun-19           Dec-19                Jun-20              Dec-20
                                                                              •    DRP will operate with a 1.5% discount and will be fully underwritten
                           CET1     Total capital

                                                                                                                                                          9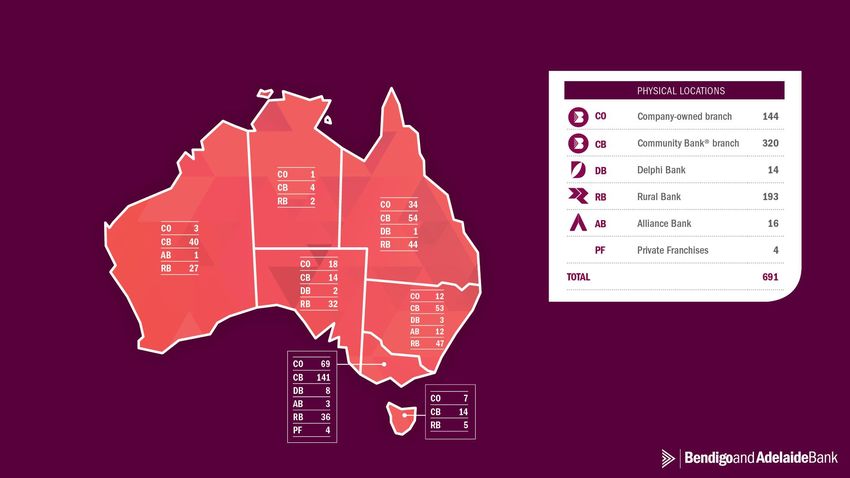
Growth and transformation strategy
Significant progress in 1H21
Objectives Outcomes
1
• Integration of Community Sector Banking , reducing
• Accelerated our cloud journey, successfully moving
1 brand complexity, and cost and process duplication
• Procurement services savings of $7.3m
32 applications in 30 days to AWS
• Net reduction of 12 branches through branch consolidation and
(FY21 savings of $19.4m)
closure
Reduce • Simplifying our merchant facility systems through the
complexity • Net FTE down by 247 (5.2%)
signing of the Tyro partnership agreement
• New Connect mobile banking App features introduced to
further enhance customer experience • Implementation of LinkedIn learning company-wide and new
2 • Increased Mobile Relationship Managers by 16% in retail
network
leadership program
• Broadened use of digital acceptance of documents to improve
• Launched authenticated web messaging for a more customer experience
Investing in personal and convenient customer experience • Upskilled more than 400 employees in cloud, machine learning,
capability • Open Banking build delivering early acceleration of the and information security
Bank’s technology modernisation strategy
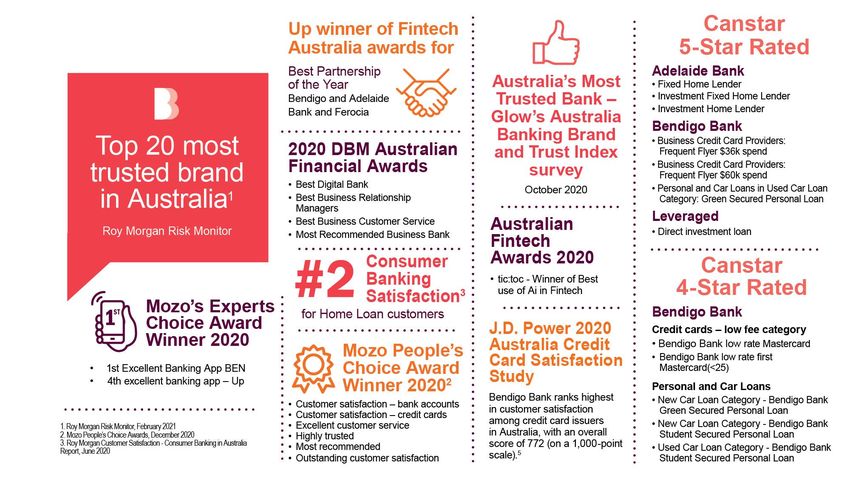
• Top 20 Most Trusted Brand in Australia (Roy Morgan • Business banking highest rated bank for supporting customers
3 Risk Monitor February 2021)
• Most Trusted Bank (Glow's Australia Banking Brand
through COVID-19 (DBS research)
• Gold David Ogilvy Award honouring extraordinary and/or creative
and Trust Index survey October 2020) uses of research in advertising, for the Better Big Bank campaign
Tell our story • Winner in 6 of 7 possible Mozo People’s Choice Awards • Enhanced sustainability reporting
1 Community Sector Banking is a specialist banking service for not-for-profit organisations and is not related to the Community Bank network
10Delivering on transformation for stakeholders
Structural and sustainable change
‘learning through programs, through people and through practice’
• Use of Cloud and API capability to increase scalability, security, agility and ability to adapt to changing customer needs
• Launch BEN U, our corporate university that supports the modern learner and our philosophy of
• Delivery of Open Banking enabling the leveraging of new capability into customer offerings
•
physical, emotional and mental health and safety of our people
Modernisation and optimisation of branch network to meet changing customer needs and increase productivity
Ahead • Enhanced delivery of staff training to support modern learning in an increasingly digital environment
• Deliver an enhanced Wellbeing solution with the tools, programs and services to support the
of plan
• Simplification and digitisation of key customer journeys to improve the customer experience
• Simplification of operating structures to drive economies of scale in repeatable processes and like functions
of ‘learning through programs, through people and through practice’
• Rationalisation and simplification of customer products to improve the customer experience and reduce costs
• Launch BEN U, our corporate university that supports the modern learner and our philosophy
• Reduction in number of technology applications to remove duplication, cost and risk
• Leveraging our partners’ capability to accelerate the build out of key digital channels and offers
physical, emotional and mental health and safety of our people
• Consolidation and optimisation of business models and banking platforms to reduce complexity for customers and staff
• Deliver an enhanced Wellbeing solution with the tools, programs and services to support the
Tracking
to plan • Reduction in the number of brands in market to remove cost and confusion
• Early progress made to sustainably reduce our cost base
11Balancing stakeholder needs •
People
7,062 employees
Our purpose is to feed into prosperity, not off it. Simply, this means what • 74% employee engagement2
• 60% women employed
matters to our stakeholders matters to us – their success supports ours.
• 44% women in management roles
We take a holistic view of the needs of our stakeholders, and we make • 35% women in senior leadership
informed and balanced decisions to proactively address relevant and • Continued upskill of staff in digital capability
material economic, social and environmental risks and opportunities. • Introduced dashboard to monitor BEN's cultural and
behavioural risk profile
How we Community Customers
3
• 29.0 Net Promoter Score
do business • Over $250 million in community
contributions since Community Bank • Top 20 most trusted brand in Australia
4
inception in 1998, including $21.7m in FY20 1 • 4.3% growth in customers since 30 June 2020
• We lend fairly and • Raised more than $46 million for bushfire affected • Continued access and tailored support to
responsibly communities in the past year customers through COVID-19
• Scholarship program, one of Australia’s largest • Highest rated bank for supporting business
• We’re committed to privately funded programs, has supported over 1,000 customers through COVID-195 reflecting value of
assisting vulnerable students with more than $9 million since 2007 our relationship model
customers
• We believe people should
be treated fairly and
Environment Shareholders
equally • 33.5% reduction in C02 emissions since 2016 • Strength in balance sheet and earnings
• We’re committed to • 113,000 trees planted to offset travel emissions • Unquestionably strong CET1 ratio of 9.36%
• No direct lending to coal and coal seam gas projects • Long-term sustainable returns – average dividend
diversity and inclusion yield of 6.26% over the last 10 years, pre-franking
• Climate change action plan commits to: 6
• We have a strong - Be carbon neutral by June 2021
credits
• Long-term payout ratio of 60-80%
partnering track record - Purchase 100% renewable energy by 2025 • Enhanced sustainability reporting
- Reduce absolute emissions by 50% by 2030
1 Includes total sponsorships, donations and grants
2 Internalmeasure of employee motivation, commitment, discretionary effort and pride. June 2020 (73%) included contractors now removed
3 Roy Morgan Net Promoter Score – Roy Morgan Research, 6 month rolling average. Net Promoter, Net Promoter System, Net Promoter Score, NPS and the NPS-related emoticons are registered trademarks of Bain & Company, Inc., Fred
Reichheld and Satmetrix Systems, Inc.
4 Roy Morgan Risk Monitor, February 2021
5 DBS research, November 2020
6 Data from Nasdaq IR Insight Platform from 11 February 2011 to 11 February 2021
12Economic environment
Improving domestic outlook amongst global uncertainty
Expected Uncertain
• Low interest rate • The economy post
environment to continue Government support
• Housing market • Global and local
continuing to improve impacts of the
• Improving jobs market pandemic
• Continued growth in • China – future
regional Australia impacts on trade
• Positive outlook for • Global cyber security
agribusiness landscape
• Resilience of SME • Natural disasters and
sector climate change
131H21
Financials
Travis Crouch
Chief Financial Officer
14Financial performance
1H21 2H20 1H20 1H21 1H21
($m) ($m) ($m) v 2H20 v 1H20
Net interest income $711.4 $670.0 $676.4 6.2% 5.2%
Other income $129.9 $129.5 $138.3 0.3% (6.1%)
1
Homesafe $7.7 $8.6 $7.1 (10.5%) 8.5%
Operating expenses $517.4 $534.1 $487.4 (3.1%) 6.2%
Credit $19.5 $145.3 $23.2 (86.6%) (15.9%)
Cash earnings (after tax) $219.7 $86.0 $215.7 155.5% 1.9%
Statutory net profit (after tax) $243.9 $47.0 $145.8 418.9% 67.3%
Cash EPS 41.4c 16.6c 43.8c 149.4% (5.5%)
Cash return on tangible equity 10.01% 4.10% 10.98% +591bps (97bps)
Cost to income 60.9% 66.1% 59.3% (520bps) +160bps
Note: Net interest income (NII), other income and operating expenses all cash basis before tax
1 Homesafe net realised income before tax
15Lending growth profile – 1H21 annualised1
Total lending Residential lending Business lending2
Reflects
seasonality
14.0%
-1.1%
9.2%
-3.4%
-4.3%
3.9%
-9.2%
0.1%
1 APRA Monthly Banking Statistics December 2020. Data is an annualised growth rate based on a 6-month period (30/06/20 – 31/12/20)
2 Business lending is lending to non-financial corporations as defined by APRA
16Residential lending activity
Retail - settlements breakdown Third Party Banking - settlements breakdown
1 1
($m) ($m)
$5,000m $5,000m
1H21 splits: 1H21 splits:
$4,000m Variable – 61% $4,000m Variable – 48%
Fixed – 39% Fixed – 52%
P&I – 85% P&I – 84%
$3,000m
IO – 15% $3,000m
IO – 16%
$2,000m $2,000m
$1,000m $1,000m
$m $m
OO INV Total OO INV Total
2H19 1H20 2H20 1H21 2H19 1H20 2H20 1H21
1 Loan portfolio constructed from internal data and includes line of credit products. Excludes Delphi, Alliance Bank and Portfolio Funding.
17Net interest margin
• 1H21 NIM increased 1bp to 2.30% Historical NIM (%)
• Funding mix and deposit repricing benefits of 11bps in total, primarily driven by 2.37 2.35 2.37 2.37
2.29 2.30
higher at-call deposit growth, repricing of term deposits and drawdown of the 0.39 0.40 0.40 0.38 0.33
0.36
term funding facility
• Lending portfolio rate continues to push lower due to mix of asset growth and
competitive new business rates 1.98 1.95 1.97 1.99 1.93 1.97
• Reduction in revenue share reflects lower rate environment, increased at-call
deposit flows and the change following the integration of Community Sector
Banking in 2H20 2H18 1H19 2H19 1H20 2H20 1H21
2
BEN Revenue share arrangements
• December 2020 exit NIM of 2.27%
NIM impacts 1H21 2H20 1H20
Front book/back book repricing (8bps) (7bps) (6bps)
NIM monthly movement
Variable loan repricing 5bps 10bps 10bps Monthly NIM 3 Month rolling NIM
Hedging (3bps) (3bps) 6bps 2.50
Treasury liquids (1bps) (1bps) (2bps)
2.40
Customer deposit repricing 3bps (8bps) (7bps)
Wholesale deposits repricing 2bps - 1bp 2.30
Funding mix 6bps 3bps 2bps
2.20
Equity contribution (3bps) (2bps) (3bps)
Impact on adoption of AASB 16 1 - - (1bp) 2.10
Total 1bp (8bps) - 2.00
Jun 17 Dec 17 Jun 18 Dec 18 Jun 19 Dec 19 Jun 20 Dec 20
1
On 1 July 2019 the Group applied AASB 16 Leases which has resulted in interest expense associated with the Group’s leases being recorded through NII
2 Revenue share arrangements includes Community Bank, Alliance Bank and Community Sector Banking. Following integration of Community Sector Banking, it is no longer included
in revenue share arrangements from March 2020
18Total income
• Net Interest Income up $41.4m or 6.2% on 2H20. Continued • Flat fee income reflects higher lending and merchant fees
strong loan growth has contributed $26.9m of this uplift largely offset by lower card and transactional fees.
through higher average interest earning assets since 2H20.
• COVID-19 pandemic reducing 1H21 income by $6.4m (vs
• Total other income was broadly consistent through 1H21, up $8.8m in 2H20)
0.3% since 2H20
+5.1%
$0.7m $0.9m
$41.4m $0.8m $0.5m
$849.0m
$821.8m 836.6 835.6
834.1 834.1
$808.1m 808.1
1
1H20 2H20 Net interest income Fees, commissions and Trading income Other income Homesafe 1H21
FX
Note: Other income breakdown is prepared on a cash basis and excludes Homesafe revaluation ($61.6m) and revaluation gains on economic hedges (-$8.1m).
1
Homesafe net realised income before tax
19Operating expenses
• HoH (1H21 v 2H20) reduction in operating expenses of 3.1% • Reduction in staff costs achieved after:
driven by strong focus on achieving sustainable cost reductions • Continued investment enabling revenue growth and
across the business. PCP (1H21 v 1H20) increased by 2.7% enhanced organisational capabilities, including in risk,
excluding accelerated investment technology, digital and cost transformation and culture.
• 1H21 includes accelerated investment in technology and • $7.7m in redundancies, with majority in 1H21 occurring in
transformation of $35.2m (2H20 $35.5m) November and December 2020 (2H20 $6.1m)
• Other expenses reduction reflects group-wide focus on • Savings generated through transformation program
sustainable reductions in the cost base, including $7.3m from resulting in 5.2% reduction in FTE over the half
procurement initiatives. Reduction also impacted by reset of • Early identification of remediation items in previous halves
discretionary spend and COVID-19 impacts resulted in lower payments required in 1H21
-3.1%
Underlying OPEX down $17.6m
$3.4m $3.0m
$534.1m $14.6m
$2.2m
$0.3m
517.7 $517.4m
2H20 CPI & Salary Increases Staff costs Other Remediation Investment 1H21
20Consumer division performance
• Net interest income driven by strong growth in both the • Reduction in operating expenses reflects benefits of
Retail and Third Party Banking channels transformation program in the corporate branch network
• $4.3b growth in call deposits, allowing active management of • Credit expenses in prior half benefited from the release of
more expensive term deposit funding non-COVID-19 collective provision associated with lower
risk profile on mortgage loans
• Other income increased slightly due to increased lending
activity partially offset by lower management fees and
COVID-19 impacts of changing customer behaviour
+12.0%
$2.9m
$1.0m $0.9m
$8.0m $215.2m
$5.9m
$17.9m 210.1 210.2 210.2
207.2 207.2
$192.2m 192.2
1
1
2H20 Net interest income Other income Homesafe Operating expenses Credit expenses Tax 1H21
1
Homesafe net realised income before tax
21Business division performance Agribusiness division performance
• Higher NII reflects an increase in the lending portfolio (versus • Stronger NII reflects higher average balances for the half
negative system growth), strong deposit growth and effective and effective margin management
margin management • Other income increase due to higher revenue from
• Other income reduction reflects lower loan fees and COVID-19 government services business
impacts associated with foreign exchange income • Lower operating expenses reflect active cost management
• Improvement in operating expenses reflects benefits from active • Credit expenses have normalised on 2H20 which benefited
cost management (including a reduction of 55 FTE), disposal of from a write-back of collective provision related to a single
assets under management and the consolidation of Community exposure. Underlying credit remains strong reflecting
1
Sector Banking business improved seasonal conditions across most of Australia
• Credit expenses in half benefited from reduction in specific
provisions and release of non-COVID-19 collective provision
associated with lower risk profile on business loans
+39.7% +25.8%
$13.2m $5.9m $1.6m $1.9m $3.1m $0.9m
89.3 $89.3m 46.0
$9.5m 44.4 44.8
$1.0m $6.3m 43.9 $43.9m
82.0
$12.8m 75.7 75.7
$63.9m 63.9
$34.9m 34.9
2H20 - cash Net interest Other income Operating Credit Tax 1H21 - cash 2H20 - cash Net interest Other income Operating Credit Tax 1H21 - cash
earnings income expenses expenses earnings earnings income expenses expenses earnings
1 Community Sector Banking is a specialist banking service for not-for-profit organisations and is separate to the Community Bank network
22Homesafe investment property portfolio
• Proceeds on contracts completed during 2H20 exceeded carrying
value by $1.7m Homesafe portfolio & funding balance ($m)
• Average annual return on completed contracts since inception is Dec-20 split:1 835.5
9.7% p.a, pre funding costs Melbourne – 62% 782.2
Sydney – 38%
• 1H21 property revaluations income includes increased valuations
472.3 490.6
during the half and an improved growth outlook
• Portfolio valuation reviewed and growth outlook changed to
+2% year 1, +3% year 2 and +4% year 3+
• Property values would need to fall by 41% before any impact on Jun-07 Dec-08 Jun-10 Dec-11 Jun-13 Dec-14 Jun-16 Dec-17 Jun-19 Dec-20
regulatory capital
Portfolio balance Funding balance
Realised - income vs funding costs ($m) 1H21 2H20 1H20
12.7 ($m) ($m) ($m)
11.5 11.9
10.6 10.8
Discount unwind $12.3 $11.7 $11.4
3.9 4.4 4.1 4.2 Profit/(loss) on sale $1.7 $1.9 $1.3
3.4
Property revaluations $47.6 ($16.4) $26.1
1H19 2H19 1H20 2H20 1H21
Total $61.6 ($2.8) $38.8
Realised income Realised funding costs
1 % split of portfolio calculated on total portfolio balance
23Bad and doubtful debts
1H21 2H20 1H20 2H19
($m) ($m) ($m) ($m)
• 1H21 BDD charge represents 6bps of total gross loans,
assisted by government stimulus during the half Consumer division $2.4 ($3.5) ($0.4) $13.0
• COVID-19 collective provision reviewed at Business division $3.5 $16.3 $17.8 $10.4
31 December 2020, resulting in a modest reduction in the
total COVID-19 provision Agribusiness division $5.9 $2.8 $3.3 $1.9
• Total impaired assets down 7.6% from June 2020 and 29.6% Great Southern $0.6 $1.0 ($0.1) $3.3
from December 2019
Corporate (includes COVID-19 overlay) $7.1 $128.7 $2.6 ($3.8)
• Increase in specific provisions primarily relate to existing
Total $19.5 $145.3 $23.2 $24.8
impaired assets and reflect limited recovery action and asset
sales due to COVID-19
Provisions for doubtful debts ($m) 1
BDD / Loans
445.8 1.20%
428.2
379.9 362.8 85.4 1.00%
352.6 78.4
307.7 0.80%
125.4 128.5 131.2
119.3 0.60%
263.2 266.1
48.2 181.5 157.0 0.40%
147.2
0.20%
140.2
73.0 77.3 74.2 86.6 94.3
0.00%
Jun-18 Dec-18 Jun-19 Dec-19 Jun-20 Dec-20 FY07 FY09 FY11 FY13 FY15 FY17 FY19 1H21
General Collective Specific BEN Major Banks Regional peers
1 External data supplied by Morgan Stanley
24Collective provision movements
Total collective provisions and GRCL ($m) Total collective provision movements ($m)
360.4
349.8
17.4 14.1 266.1
20.6 67.5 263.2 11.2
252.0 252.0
124.5
127.7
221.4
48.5 195.7
74.2 76.9
66.0
147.2 147.2
147.2 135.5 141.6
Dec-19 Jun-20 Dec-20 Dec-19 Economic Additional Jun-20 Economic Additional Dec-20
forecast and overlays1 forecast and overlays1
Collective GRCL Collective - COVID-19 overlay GRCL - COVID-19 overlay scenario scenario
weights weights
1 Additional overlays includes COVID-19 overlays and non-COVID-19 related overlays
25Arrears
Residential loan arrears Business loan arrears1
1.6% 6.0%
1.2%
4.0%
0.8%
2.0%
0.4%
0.0% 0.0%
Jun-18 Dec-18 Jun-19 Dec-19 Jun-20 Dec-20 Jun-18 Dec-18 Jun-19 Dec-19 Jun-20 Dec-20
Res 90d+ (inc. arrangements)
Bus 90d+ (inc. arrangements)
2
Consumer loan arrears Agribusiness loan arrears
2.0%
3.0%
1.6%
1.2% 2.0%
0.8%
1.0%
0.4%
0.0% 0.0%
Jun-18 Dec-18 Jun-19 Dec-19 Jun-20 Dec-20 Jun-18 Dec-18 Jun-19 Dec-19 Jun-20 Dec-20
CC 90d+ (inc. arrangements) PL 90d+ (inc. arrangements) Agri 90d+ (inc. arrangements)
Note: Arrears include impaired assets and all arrangements
1 October 19 includes correction in arrears reporting, includes Delphi Commercial
2 Consumer loan arrears reflects credit card portfolio and personal loan portfolio
26Funding mix
• Funding mix continues to be a strength, allowing flexibility Funding profile (%)
to fund above system asset growth and manage margin 5.9% 5.2% 4.2%
19.7% 19.6% 18.5%
• While RBA cash rate changes reduced deposit rates, call
deposit growth continued in 1H21, with call deposits 34.7% 31.6% 28.8%
increasing $5.6b, replacing higher cost term deposits in 77.3%
Customer
non-retail channels 39.7% 43.6% 48.5% Deposits
• Community Bank network deposits increased 21% on an
Dec-19 Jun-20 Dec-20
annualised basis in 1H21
Customer - call Customer - term deposits Wholesale Securitisation
• Retail term deposit average retention rate held at
~89% through 1H21
Total deposit growth1
• Wholesale domestic issuance continues to provide a
reliable source of funding and lengthens BEN’s maturity
16.9%
profile
• Average daily LCR through 1H21 of ~139%
7.6%
• Average end of month NSFR through 1H21 of ~124%
Total Deposits
BEN System
1 APRA Monthly Banking Statistics December 2020. Data is an annualised growth rate based on a 6-month period (30/06/20 – 31/12/20)
27Capital
• Balance Sheet Strength
• 36bps increase in CET1 since December 2019 to 9.36%, 11bps
Total capital & CET1 - historical (%)
increase since June 2020
14.45%
• Target CET1 range of 9.0% – 9.5% remains and will be reviewed after 13.14% 13.21% 13.61%
APRA finalises its review of the capital adequacy framework Not updated
9.25% 9.36%
• Internal stress testing completed sees capital ratios maintained above
8.92% Likely to change
9.00%
APRA's unquestionably strong minimums
• Interim dividend payout ratio of 56.8% reflects period of economic uncertainty
and APRA industry guidance released in December 2020
Jun-19 Dec-19 Jun-20 Dec-20
• Dividend Reinvestment Plan with a 1.5% discount to be fully underwritten
CET1 Total capital
• Dividend target payout ratio of 60% - 80% of cash earnings on an annual
basis remains
CET1 movement - 6 months (%)1
0.51 0.09
0.29
0.02
9.36
9.25
Jun-20 Earnings Capitalised expenses RWA Other Dec-20
1 Unrealised Homesafe revaluation revenue has been excluded from increases in retained earnings
282H21 financial outlook
• Continue to target above system residential lending growth
Lending • Positive growth in agribusiness and growth in line with system for target Business SME sectors
• December 2020 exit NIM of 2.27% (1H21 2.30%)
Net interest margin • 2H21 NIM headwinds from front book / back book lending rates and higher liquid assets, with some benefits
expected from deposit mix, lower cost of funds and full impact of November 2020 cash rate lending repricing
• Fee, Commission and FX income lower given customer behaviour, competitive environment and sale of
Other income merchant service business, partially offset by stronger lending fees with above system growth
• Trading book contribution expected to reduce in stable and low interest rate environment
• Target for FY21 cash operating expenses to be flat to slightly down on FY20 operating expenses of $1021.5m
Operating expenses • This target includes an uplift in 2H21 accelerated investment spend (1H21 $35.2m)
• Economic indicators are performing ahead of expectations however uncertainty remains around impact on
Asset quality economy when government support ceases
• Provision levels are prudent
Capital • Maintaining CET1 target range of 9% to 9.5%, whilst continuing to target above system lending growth
29Questions
Marnie Baker – Managing Director
Travis Crouch – Chief Financial Officer
Taso Corolis – Chief Risk Officer
30Appendix
31Executive team
32
32Physical locations
33The Community Bank model
Community banking is based on a Community Bank footings ($b)2
‘profit with purpose’ model
25.6
22.2 23.2
20.0 21.0
• Over $250m in community contributions1 since inception,
enabling tangible economic and social benefits for the
communities and our business 16.0 16.7 17.0 17.7 18.1
• Significant matched funding leveraged by community
partners for major local infrastructure initiatives Jun-17 Jun-18 Jun-19 Jun-20 Dec-20
• 320 Community Bank branches, of which over 20% are the Loans Deposits
only financial institution in the town or suburb
• Proven, reliable and cost effective distribution strategy Total investment by theme
• Community Bank branches are a significant source of stable
customer deposits for the broader Group 11.0%
• Compelling and significant engagement across communities Donations
47.0%
with 75,000+ Community Bank shareholders and 1,900+ Grants
directors 42.0%
Sponsorships
• One of the largest social enterprise movements globally
1 Includes total sponsorships, donations and grants
2 Community Bank footings include Private Franchises (4 branches in total)
34Australia’s first and largest mobile-only digital bank platform
designed and delivered in partnership with Ferocia
Through a design and technology-led banking approach, Up reconnects people with their finances, taking
them from a place where money is a cause of stress and anxiety to a happier place where they feel
empowered and in control of their money.
Leading the neobank movement Engaged customers driving growth Financial literacy for the next generation
1,200 50% of Upsiders aged 16 to 25
4.9 Highest rated banking app in Australia Accounts, '000s (LHS) 140
In the App Store and Google Play Dec-2020 1,000 120
Transactions, millions (RHS)
800 100 Over $700m in current deposits
#1 award-winning Neobank +155% year-on-year growth
600 80
+ Digital Disruptor of the Year (Finder)
+ Best app design (German Design Council) 60
+ Partnership of the Year (Fintech Australia)
400 130k+ upcoming bill payments
40
with 170k+ merchants identified within Up
200 20
Fast growing, now 325k+ customers
+100% year-on-year growth, over 90% new-to-bank
1m+ new accounts opened
Jun-18 Dec-18 Jun-19 Dec-19 Jun-20 Dec-20
including 700k+ Up Savers
Relentless pace of innovation
TransferWise integration • Up banking developer API Over 40% of active customers deposit $35m+ auto-saved via round-ups
UpYear customer insights • and so much more $1k+ per month over consecutive months with $20m+ saved from Up savings boosts
+$840m purchases, +$3.45b payments Active customers averaged 30+ $160m+ auto pay/salary splits
+13% CMGR for card/wallet purchases in 1H21 purchases per month during Dec-2020 from 650k+ completed splits
Avg. 2 mins support first response 60%+ of Upsiders have referred a friend “Pull-to-Save” used 1m+ times
40% growth from Up’s Hook-Up-A-Mate in-app
using Up’s custom-built in-app Talk-to-Us chat referrals
35“Australia’s only end-to-end digital home loan fulfillment platform”
Tic:Toc partnership delivering: Tic:Toc – portfolio balance
$1,200
Better customer experiences
Millions
• Tic:Toc has delivered a home loan contract in less than 60
$1,000
minutes of the customer beginning an application.
• Direct Digital mortgage enquiries had the highest growth last
year (33%)¹ with Tic:Toc reporting 128% YoY growth. $800
• Tic:Toc remains the only end-to-end digital home loan
fulfillment platform and maintains a 4.6/5 TrustPilot star $600
rating.
$400
Strong asset growth
• 1H21 Tic:Toc home loan approvals were up 61%, with a
$200
skew to the end of the half as market conditions improved.
This has positioned Tic:Toc for a strong 2H21 for settlement
$-
growth. Dec-18 Jun-19 Dec-19 Jun-20 Dec-20
• Second Tic:Toc white label funded by BEN scheduled to
launch Q3.
Shareholder growth (BEN holds a 28.8% stake in Tic:Toc)2
Cost out • New capital raised at 142% increase on prior round, reflecting diversity of revenue streams and
• Lower cost of acquisition to BEN via Tic:Toc Home Loans growth acceleration via Tic:Toc Home Loans and Tic:Toc Enterprise. Tic:Toc now has 2 PaaS
and Bendigo Express. Automation levels enable loan partners, and 4 SaaS clients.
fulfillment with as little as 10 mins of human effort.
Industry leading credit performance Proprietary end-to-end tech
• Improved arrears profile via growth of platform originated • PaaS, SaaS and API technologies provide sustainable competitive advantage to support scale,
home loan portfolio. Tic:Toc home loans 1-29 day arrears operational efficiency and revenue diversity. Tic:Toc is well placed for Open Banking and an environment
0.17%, 90+ day arrears 0%. where businesses must strip cost from process to remain competitive.
Note: Bendigo and Adelaide Bank have a 28.8% ownership stake in Tic:Toc
1 Equifax, August 2020
2 As at 31 December 2020
36
36Climate Change strategy in action
Strategy and three-year Climate Change Action Plan commenced June 2020
We recognise climate change has far-reaching risks for the environment, the economy, society, our customers and their communities.
We support the Paris Agreement objectives and the required transition to a low carbon economy.
We are committed to playing our part in this transition. We will work to build climate mitigation and adaption into our business and
work to assist our customers and their communities to build climate resilience into their futures.
Key Targets 1H21 Update
1 To be carbon neutral by June 2021 Reduce our • Expanded our successful branch rooftop solar panel trial to other
2 To purchase 100% renewable energy by 2025 footprint: locations
• Campaign to reduce paper usage resulted in 97% of shareholders
3 To reduce absolute emissions by 50% by 2030 viewing BEN reports electronically
Support our • Surveyed customers to understand how we can support them to
Focus Areas customers: mitigate, adapt and respond to climate change
• Introduced discounted solar panel and batteries for our staff,
Reduce our footprint:
1 We will reduce the carbon and
environmental footprint of our own operations
through our longstanding partner Tindo Solar
• Commenced participation in NSW Government home energy
rating opportunities
Support our customers: We will support our
2 customers and communities by working with them to help
mitigate, adapt and respond to climate change Understand • Established a multiskilled bank-wide team to inform and assist the
development and implementation of our climate change action plan
and manage
• Leveraged our externally appointed Agribusiness Advisory
Understand and manage the risks: We will the risks: Committee to understand how we can better support agricultural
3 optimise our climate change risk governance and risk
management framework
businesses with the impact of climate change
Be transparent: We will disclose our climate-related Be • Increased disclosures in the annual report/review
4 performance transparent: • Strengthened sustainability reporting for FY21
37Modern Slavery
Modern Slavery Our action:
Bendigo and Adelaide Bank understands • Modern slavery statement lodged December 2020
slavery and human trafficking can occur in a • Anti-slavery and Human Trafficking Policy developed to
number of direct and indirect ways such as address supply chain, and operational governance
forced labour, child labour, domestic servitude, responsibilities
or sex trafficking.
• Processes and procedures in place to enact policy
We take a responsible approach to conducting • Comprehensive communication and training program
our businesses and we understand the commenced
important role we play in our communities and • Modern slavery risk mitigation included in procurement
in meeting customer and community supplier engagement processes
expectations.
• Annual compliance surveys to manage potential modern
slavery risks
The Bank has always been fully committed to
upholding and exceeding these expectations, • Regular collaboration with ABA and member banks
and in line with our long-held purpose to feed • Updated Code of Conduct Policy reflecting zero tolerance
into prosperity, not off it, the Bank has finalised position
its Slavery and Human Trafficking Policy.We are well placed
39Meeting customers’ changing preferences
Customer preferred card usage1
100% E-banking platform usage
90%
Up 4.2% through 1H21
80% 2
with 11.6% more logons
70%
60%
50%
40% Historic transactions trends
250
Millions
30%
200
20%
150
10% 100
0% 50
2016 2017 2018 2019 2020
0
Magnetic Stripe Read Online - card-on-file Online - entered details 2016 2017 2018 2019 2020
EMV Chip Contactless Apple/Google Pay Credit Debit
1 Change in person card usage against 2020Q1 reflects partial impact of COVID-19 pandemic on methods of transactions
2 Percentage change against 2H20 metrics
401
Collective provision - economic outlook
Economic assumptions in the base scenario at December 2020 reflect improved conditions since June 2020
Unemployment (%) House prices (%)
16.00% 25.00%
15.00%
12.00% 5.00%
-5.00%
8.00% -15.00%
-25.00%
4.00% -35.00%
Sep-20 Jun-21 Mar-22 Dec-22 Sep-23 Sep-20 Jun-21 Mar-22 Dec-22 Sep-23
Mild improvement Base scenario Mild improvement Base scenario
Mild deterioration Severe deterioration Mild deterioration Severe deterioration
Gross Domestic Product (%) Commercial property prices (%)
10.00%
5.00%
5.00%
-5.00%
0.00%
-15.00%
-5.00% -25.00%
-10.00% -35.00%
-15.00% -45.00%
Sep-20 Jun-21 Mar-22 Dec-22 Sep-23 Sep-20 Jun-21 Mar-22 Dec-22 Sep-23
Mild improvement Base scenario Mild improvement Base scenario
Mild deterioration Severe deterioration Mild deterioration Severe deterioration
Note: House prices and commercial property prices are cumulative from Sep-20
1
Baseline to September 2020 to reflect published quarterly data
41COVID-19 scenario weightings & sector overlays
As at 31 December 2020
Minimal exposure to most impacted industries4
Scenario weightings reflect improved base case – COVID deferral % of GLA
0.01%
Jun-20 5% 30% 50% 15%
0.02%
Dec-20 15% 25% 50% 10%
0.04% Arts and recreation services
Significant deterioration Mild deterioration Base scenario Mild improvement
Construction
1 Financial and insurance
Collective provision - scenario outcomes ($m) services
Accomodation and food
services
329.0 266.1
84.9
0.09%
184.1 181.2
144.5
100% Base scenario 100% Mild deterioration 100% Significant Probability weighted -
deterioration collective provision
2 3
Scenario - ECL COVID-19 Overlays
1 Excludes GRCL
2 Scenario – ECL includes economic outlooks scenario weights and other non-COVID-19 related overlays
3 Includes business and consumer portfolio overlays
4 Informed by external industry data 42COVID-19 – Residential & Consumer portfolio
As at 31 December 2020
Residential and
Residential lending % of total deferrals - by state
Consumer packages
31 Dec 20
Number of accounts (May peak) 2,466 (17,249)
Balances (May peak) $788m ($4.95b) 11%
Residential loans / consumer loans 92% / 8% 6% 5%
Owner occupied / Investor 71% / 29%
Principal and interest / Interest-only 80% / 20% 21%
Vic split:
% of customer relationship greater than 3 years 72% - Metro: 75%
56%
Residential loans on deferral with dynamic LVRCOVID-19 – Residential portfolio
As at 31 December 2020
• Approximately 94% of customers on deferral had been contacted with customer contact program progressing in line with plan
(deferrals expire by 31 March 2021)
• Customers that were or had been on deferral (and not in arrears prior to deferral) that had arrears >90days totalled $51.55m
(192 accounts) and BAU credit management and provisioning approach was being followed
• Customers that were or had been on deferral (and not in hardship prior to deferral) that were on a BAU hardship arrangement
totalled 36 accounts with a total balance of $9.58m
% of exposures by payments in advance Composition of no buffer andCOVID-19 – Commercial portfolio
As at 31 December 2020
• Approximately 68.3% of customers on deferral had been
Commercial
packages
contacted with customer contact program progressing in
31 Dec 20 line with plan (deferrals expire by 31 March 2021)
• Customers that were or had been on deferral that had
Number of accounts (July peak) 621 (4,707)
arrears >90days totalled $6.4m (28 customer groups) and
Balances (June peak) $307m ($1.98b) BAU credit management and provisioning approach was
being followed
% of customer relationship greater than 3 years 87.4%
• Customers that were or had been on deferral that were
Commercial loans on deferral with LVRCOVID-19 – current portfolio (commercial)
As at 31 December 2020
Total commercial portfolio vs commercial support packages - by industry ($m)
6,076.3
3,528.7
No undue industry concentration of the COVID-19 repayment deferrals
1,858.7
Exposure to most impacted industries as a % of GLA is low
608.2
532.6
356.0 332.1 352.7
224.0 213.8 187.4 137.1 135.9
104.2 61.0
29.4 29.2 16.8 4.9 15.2 8.6 12.2 2.3 4.3 2.8 16.6
1
Agriculture, Rental, hiring Financial and Construction Health care Retail trade Accomodation Manufacturing Other services Professional, Wholesale Transport, Other
forestry and and real estate insurance and social and food scientific and trade postal and
fishing services services assistance services technical warehousing
services
Total portfolio Commerical support packages
1
Other includes seven categories: arts and recreation services; administrative and support services; electricity, gas, water and waste services; information, media and
telecommunications; mining; public administration and safety; other
46Residential lending activity
Residential lending applications – by month
$3000m
1H21 up 26.3% on 2H20
Q3 Q4 Q1 Q2
Channel spilt:
FY20 FY20 FY21 FY21
$2500m
Retail 47% 36% 47% 52%
Third Party Banking 53% 64% 53% 48%
$2000m
$1500m
$1000m
$500m
$m
Dec-18 Jun-19 Dec-19 Jun-20 Dec-20
1 Loan applications represent total Retail and Third Party Banking residential loans. Excludes Delphi Bank, Alliance Bank and line of credit products
47Residential lending portfolio
Retail - portfolio ($b)1 Residential balance by state
24.1
23.5
23.1
22.8
22.3 22.4
21.7
21.2
15%
Jun-17 Dec-17 Jun-18 Dec-18 Jun-19 Dec-19 Jun-20 Dec-20
9% 10%
1
Third Party Banking - portfolio ($b)
22.4
19.9
26%
18.0
16.1 16.3 16.8
15.6 15.8
38%
Jun-17 Dec-17 Jun-18 Dec-18 Jun-19 Dec-19 Jun-20 Dec-20 2%
1 Loan portfolio constructed from internal data and includes line of credit products. Excludes Delphi, Alliance Bank and Portfolio Funding
48Residential lending portfolio – total exposure
Retail lending - purpose (%) Retail lending - payment type (%)
18.4% 17.3% 15.9% 15.1% 14.6%
32.7% 32.8% 33.0% 32.8% 32.3%
69.8% 71.4% 73.1% 74.6% 76.1%
67.3% 67.2% 67.0% 67.2% 67.7%
11.8% 11.3% 11.0% 10.2% 9.3%
Dec-18 Jun-19 Dec-19 Jun-20 Dec-20 Dec-18 Jun-19 Dec-19 Jun-20 Dec-20
Owner Occupied Residential Investment Line of Credit Principal and Interest Interest Only
Third Party Banking lending - purpose (%) Third Party Banking lending - payment type (%)
25.6% 23.1% 20.0%
37.7% 32.4% 29.2%
42.7% 42.8% 41.6% 40.2%
67.9% 72.0% 75.0% 78.5%
62.3% 64.3%
57.3% 57.2% 58.4% 59.8%
3.2% 2.9% 2.4% 2.0% 1.5%
Dec-18 Jun-19 Dec-19 Jun-20 Dec-20 Dec-18 Jun-19 Dec-19 Jun-20 Dec-20
Owner Occupied Residential Investment Line of Credit Principal and Interest Interest Only
Note: Excludes Delphi, Alliance Bank and Portfolio Funding
49Residential lending portfolio – key metrics
1
Home Loans 90+ days past due - by state 3
Residential portfolio metrics Dec-20 Jun-20
3.0%
Retail loans 52% 54%
2.0% Third Party Banking loans 48% 46%
Lo Doc 1% 1%
1.0% Owner occupied 65% 64%
Owner occupied P&I 92% 90%
0.0%
VIC NSW/ACT QLD WA TAS SA/NT
Owner occupied I/O 8% 10%
Investment 35% 36%
Dec-18 Jun-19 Dec-19 Jun-20 Dec-20
Investment P&I 57% 54%
Investment I/O 43% 46%
2
Residential loan-to-value profile Mortgages with LMI 15% 19%
82% of portfolio with LVR ≤ 80%
Average LVR (at origination) 56% 57%
40.0% Average loan balance $257k $250k
90+ days past due 0.61% 0.77%
Impaired loans 0.09% 0.10%
20.0%
Specific provisions 0.03% 0.03%
Loss rate 0.005% 0.013%
0.0%
Variable 68% 74%
0% - 60% 60.01%-80% 80.01%-90% 90.01%+
Dec-18 Jun-19 Dec-19 Jun-20 Dec-20 Fixed 32% 26%
1 Keystart included from Jun-17, excludes Delphi Bank. Arrears includes impaired loans and all arrangements
2 Breakdown of LVRs by residential mortgages by origination
3 Loan data represented by purpose. Includes Business and Agribusiness divisions. Excludes Delphi Bank & Keystart data. Arrears includes impaired loans and all arrangements
50Business lending portfolio
Business lending portfolio ($b) Business balance by state
$8.5b
$8.0b
13%
$7.5b
6% 10%
$7.0b
13%
$6.5b
56%
$6.0b
Dec-19 Jun-20 Dec-20
2%
51Business lending and other specialist portfolios
Total Business Banking - deposits Commercial Real Estate - portfolio
$13.5b $4.5b
$13.0b
$12.5b $4.0b
$12.0b
$11.5b $3.5b
$11.0b
$10.5b $3.0b
Dec-19 Jun-20 Dec-20 Dec-18 Jun-19 Dec-19 Jun-20 Dec-20
1
Asset growth Portfolio (%)
$300m
$0m
56% 14% 21% 5% 4%
-$300m
-$600m
2H19 1H20 2H20 1H21 Business Customer Specialist Lending Portfolio Funding Keystart Other
1Reflects asset growth of Business division which includes a portion of the residential lending through its Portfolio Funding assets as well business lending portfolios. Asset growth as
per APRA growth statistics on slide 16 only includes lending to non-financial corporations as defined by APRA
52Agribusiness lending portfolio
Agribusiness balance by industry
Agribusiness balance by state
4.1%
4.4%
Grain/Sheep/Beef
7.7% Sheep/Beef
32.3% Beef
7.9%
Grain
Dairy
13.3%
Sheep
Other
16.7%
13.6% Hort./Vit. 10%
18% 16%
Agribusiness lending portfolio ($b)
6.0
6.1 20%
5.9
5.8 5.8
5.6
33%
5.4
Dec-17 Jun-18 Dec-18 Jun-19 Dec-19 Jun-20 Dec-20
3%
53Specific provision coverage
Specific provision Specific provisions breakdown ($m)
balance ($m)
50
85.4
Represented by 25
-
Jun-20 Dec-20 Jun-20 Dec-20 Jun-20 Dec-20 Jun-20 Dec-20 Jun-20 Dec-20 Jun-20 Dec-20
Consumer - Retail Consumer - Third Business Banking Agribusiness Great Southern Other
Party Banking
Provision as % of each portfolio’s gross Consumer – Third
Consumer – Retail Business Banking Agribusiness Great Southern BEN total
loans Party Banking
Dec 2020 0.01% 0.03% 0.35% 0.40% 24.78% 0.12%
June 2020 0.01% 0.04% 0.32% 0.30% 24.55% 0.12%
54Funding
Wholesale funding composition Term funding maturity profile ($m)
14%
4% 2,500
Dec-20
20%
62%
2,000
ST domestic LT domestic Sub-Debt TFF 1,500
Customer call deposit funding costs1
1,000
≤ 0.01%
8% 2% 5%
> 0.01% - ≤ 0.25% 500
41% 42%
Jun-20 Dec-20
> 0.25% - ≤ 1.50%
53%
49%
> 1.50% 0
2021 2022 2023 2024 2025 2026
2
Term senior debt Sub-debt TFF
Note: TFF refers to Term Funding Facility provided by the Reserve Bank of Australia and reflects the drawn amounts at 31 December 2020
1 Customer call deposit funding costs reflects accounts excluding balances held in offset accounts
2 Subordinated debt maturity refers to legal final maturity date.
55Liquidity
Liquidity Coverage Ratio – 3 month average1,2 Net Stable Funding Ratio (NSFR)
128.1% as at 31 December 2020
Dec-20 Sep-20 Jun-20 Mar-20
Wholesale
($b) ($b) ($b) ($b)
funding & other
High quality liquid assets 7.31 6.32 5.62 6.58
CLF / TFF 5.81 4.61 4.76 2.92
Other loans
Total LCR liquid assets 13.12 10.93 10.38 9.50
Customer deposits 4.89 5.19 4.85 4.66 Retail & SME deposits
Wholesale funding 1.33 1.79 1.63 1.68
Other flows 1.82 1.83 1.78 1.73 Residential mortgagesCapital
Credit risk weighted assets ($b)
1H21 2H20 1H20 2H19
(%) (%) (%) (%) 34.7
33.7
Common Equity Tier 1 9.36% 9.25% 9.00% 8.92%
33.1
33.0 32.9
Additional Tier 1 2.81% 2.34% 2.40% 2.39%
Dec-18 Jun-19 Dec-19 Jun-20 Dec-20
Total Tier 1 12.17% 11.59% 11.40% 11.31%
S&P RAC Ratio1
Tier 2 2.28% 2.02% 1.81% 1.83% 15.2%
12.5%
11.0%
10.3% 10.2%
Total capital 14.45% 13.61% 13.21% 13.14%
Total risk weighted
$39.4b $38.2b $37.3b $37.5b
assets
BEN Major 1 Major 2 Major 3 Major 4
1 Standard & Poors RAC Ratio, Major 1 as at 31 Dec 2019, Major 2, 3 & 4 as at 30 Sep 2019 & BEN as at 30 Jun 2020.
57Great Southern
Great Southern portfolio1
• Great Southern portfolio continues to contract and is $m
adequately provisioned 200 2,000
Millions
• Portfolio represents less than 0.1% of total gross loans 1,600
• As at 31 December 2020, portfolio comprised of 153 130.6 1,200
100
customers 105.0 800
86.1
71.0
60.3 22.5 20.2 400
19.7
28.0
0 -
Dec-16 Dec-17 Dec-18 Dec-19 Dec-20
Net Portfolio Borrowers (RHS)
Dec-20
Dec-20 Jun-20
v Jun-20
($m) ($m) Great Southern BDD ($m)
(%)
Collective provision $8.2 $8.2 - 9.8
Specific provision $6.5 $7.0 (7.1%) 5.3
3.3
2.7 1.0 0.6
Total $14.7 $15.2 (3.3%) -0.1
1H18 2H18 1H19 2H19 1H20 2H20 1H21
1 Balance of loans net of specific provisions
58Total income (cash)
1H21 2H20 1H20
1H21 vs 2H20 1H21 vs 1H20
($m) ($m) ($m)
Net interest income $711.4 $670.0 $676.4 6.2% 5.2%
Fee income $76.5 $76.2 $79.3 0.4% (3.5%)
Commissions $26.5 $27.4 $29.2 (3.3%) (9.2%)
FX income $10.0 $10.2 $12.4 (2.0%) (19.4%)
Trading book income $6.9 $6.4 $4.8 7.8% 43.8%
Other $10.0 $9.3 $12.6 7.5% (20.6%)
Other income $129.9 $129.5 $138.3 0.3% (6.1%)
Homesafe1 $7.7 $8.6 $7.1 (10.5%) 8.5%
Total Income
$849.0 $808.1 $821.8 5.1% 3.3%
(ex specific items)
1
Homesafe net realised income before tax
59Operating expenses (cash)
1H21 2H20 1H20
1H21 vs 2H20 1H21 vs 1H20
($m) ($m) ($m)
Staff costs $294.2 $293.6 $273.5 0.2% 7.6%
Occupancy, property, plant and equipment $49.7 $50.3 $50.4 (1.2%) (1.4%)
IT costs $38.9 $37.6 $33.3 3.5% 16.8%
Amortisation of software intangibles $14.4 $14.7 $16.4 (2.0%) (12.2%)
Fees and commissions $10.8 $10.0 $10.3 8.0% 4.9%
Communications, advertising and promotion $32.4 $34.3 $33.1 (5.5%) (2.1%)
Other $77.0 $93.6 $70.4 (17.7%) 9.4%
Total OPEX $517.4 $534.1 $487.4 (3.1%) 6.2%
60Reconciliation
1 Operating expenses include restructuring costs, legal costs and software accelerated amortisation costs
Cash earnings after tax (subtotal) is equal to cash earnings before Homesafe realised income
61Disclaimer
This document is a presentation of general background information about the Group’s activities current at the date of the presentation.
It is information in a summary form and no representation or warranty is made as to the accuracy, completeness or reliability of the
information. It is to be read in conjunction with the Bank’s half year results filed with the Australian Securities Exchange on 15
February 2021 and the Bank’s other periodic and continuous disclosure announcements. It is not intended to be relied upon as advice
to investors or potential investors and does not take into account the investment objectives, financial situation or needs of any
particular investor. These should be considered, with or without professional advice, when deciding if an investment is appropriate.
This presentation may contain certain “forward-looking statements”. The words “anticipate”, “believe”, “expect”, “project”, “forecast”,
“estimate”, “likely”, “intend”, “should”, “could”, “may”, “will”, “target”, “plan” and other similar expressions are intended to identify
forward-looking statements. Indications of, and guidance on, future earnings and financial position, distributions and performance are
also forward-looking statements. Such forward-looking statements are not guarantees of future performance and involve known and
unknown risks, uncertainties and other factors, many of which are beyond the control of the Group, its officers, employees, agents and
advisors, that may cause actual results to differ materially from those expressed or implied in such statements. There can be no
assurance that actual outcomes will not differ materially from these statements. You are cautioned not to place undue reliance on
forward-looking statements especially in relation to the current economic and market uncertainties and disruption arising as a result of
the outbreak of COVID-19. Such forward-looking statements only speak as of the date of this presentation and the Group assumes no
obligation to update such information.
To the maximum extent permitted by law, the Group shall have no liability whatsoever for any loss or liability of any kind arising in
respect of the information contained, or not being contained, in this document.
This presentation does not constitute an offer to sell, or the solicitation of an offer to buy, any securities in the United States.
Investors should note that certain financial measures included in this presentation are “non-IFRS financial information” under ASIC
Regulatory Guide 230: “Disclosing non-IFRS financial information” published by ASIC and/or “non-GAAP financial measures” under
Regulation G of the U.S. Securities Exchange Act of 1934, as amended. The discussion and analysis discloses the net profit after tax
on both a ‘statutory basis’ and a ‘cash basis’. The statutory basis is prepared in accordance with the Corporations Act 2001 and the
Australian Accounting Standards, which comply with International Financial Reporting Standards (IFRS). The cash basis is used by
management to present a clear view of the Group’s underlying operating results, excluding a number of items that are deemed to be
outside of our core activities and such items are not considered to be representative of the Group’s ongoing financial performance.
Refer to the Appendix 4E for reconciliation to statutory profit. Although the Group believes this non-IFRS/non-GAAP financial measure
provides useful information to users in measuring the financial performance and condition of its business, investors are cautioned not
to place undue reliance on any non-IFRS/non-GAAP financial measures included in the presentation.
Copyright protection exists in this presentation.
62Analysts
Karen McRae
Head of Investor Relations
T: +61 3 8414 7060
M: +61 417 186 500
E: karen.mcrae@bendigoadelaide.com.au
Alex Hartley
Manager Investor Relations
T: +61 8 8300 6290
M: +61 478 435 218
E: alex.hartley@bendigoadelaide.com.au
Media
Simon Fitzgerald
Head of Public Relations
T: +61 8 8300 6019
M: +61 427 460 046
E: simon.fitzgerald@bendigoadelaide.com.au
63You can also read