INVESTOR PRESENTATION - Q3FY19 Update
←
→
Page content transcription
If your browser does not render page correctly, please read the page content below
INVESTOR PRESENTATION
        Q3FY19 Update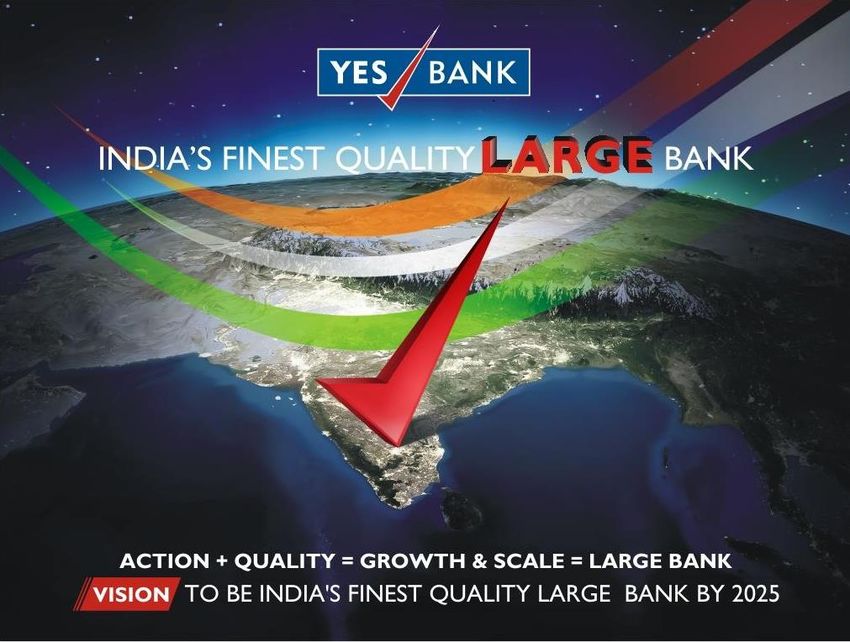
Recent Updates on YES Bank Board Matters

   ✓   The Bank has received RBI approval for its new MD & CEO, Mr. Ravneet Gill for him to join on or before
       March 1, 2019

   ✓   The Bank has received RBI approval to appoint Mr. Ajai Kumar as Interim MD & CEO from February 1,
       2019 for one month or till Mr. Ravneet Gill assumes office as MD&CEO, whichever is earlier

   ✓   Received RBI approval for appointment of Mr. Brahm Dutt as a Non-Executive Part-Time Chairman.
       Approval valid till July 4th, 2020 (till the age of 70)

   ✓   Two Promoter Groups have agreed to nominate one Representative Director each on the Bank's Board.
       The two new appointed Directors will be announced at the next scheduled Board meeting in April, 2019

   ✓   Board appoints Mr. Maheshwar Sahu (ex- Additional Chief Secretary, Govt. of Gujarat) and Mr. Anil Jaggia
       (ex- Chief Information Officer of HDFC Bank) as Additional Directors (Independent) with effect from January
       24, 2019 for a period of five years

   ✓   Mr. Maheshwar Sahu to be designated as Chairman of Corporate Social Responsibility Committee,
       while, Mr. Anil Jaggia to be designated as Chairman of Information Technology Strategy Committee

   ✓   Bank had appointed Mr. Uttam Prakash Agarwal (ex President ICAI ) and Mr. T S Vijayan (ex IRDAI &
       LIC Chairman) as an Additional Directors (Independent), with effect from November 14, 2018 and
       December 3, 2018, respectively for a period of five years

   ✓   Board has additionally recommended Mr. Ashish Agarwal, Sr. Group President & Chief Risk Officer as
       Executive Director and will seek necessary RBI approvals for this appointment.

                                                                                                                     2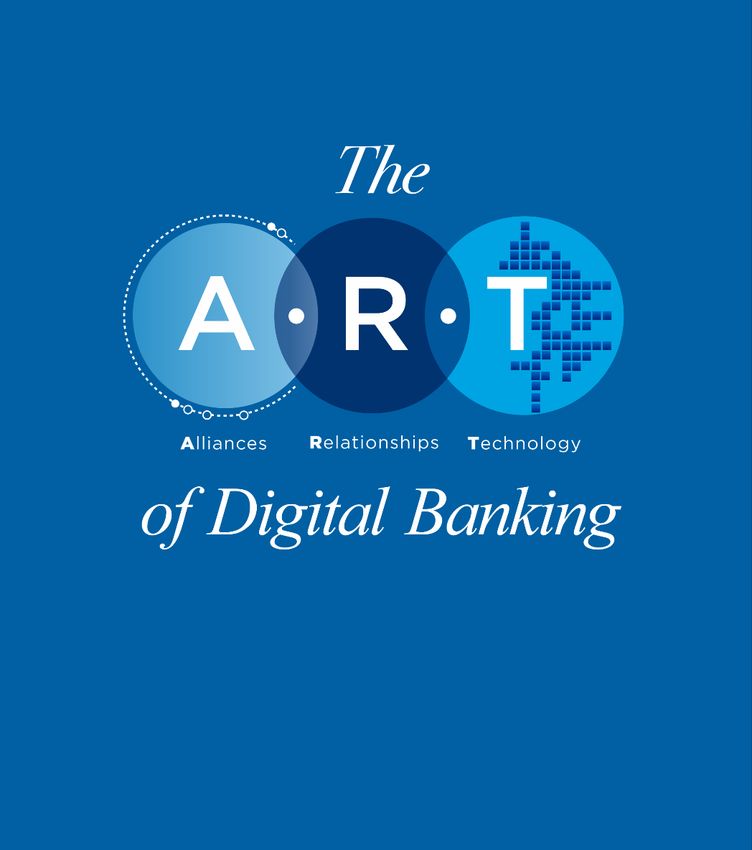
Table of Contents

    ✓ QUARTERLY HIGHLIGHTS     4 -14

    ✓ YES BANK PROFILE        15 - 26

    ✓ DIGITAL BANKING         27 - 31

    ✓ LEADERSHIP TEAM         32 - 34

    ✓ YES BANK SUBSIDIARIES   35 - 37

    ✓ ANNEXURES               38 - 40

                                        3
QUARTERLY HIGHLIGHTS

                       4
Q3FY19 Highlights

Resilience in Earnings

       NII: ` 26.66 Bn growth of                                                        Profit: ` 10.02 Bn growth
                                              NIMs stable at 3.3%
       10.3% q-o-q                                                                      of 3.9% q-o-q
       Y-o-Y growth of 41.2%                                                            Y-o-Y decline of 7.0%

Rebalanced Growth with improving Granularity resulting in increasing Capital ratios

       1.3% q-o-q Rebalanced Growth in       8.0% q-o-q growth in Retail                CRAR - 17.4% up 40bps
       Corporate Advances                    Advances, with overall composition
       Y-o-Y growth of 42.5%                 improving to 15.2% vs. 11.8% in
                                                                                        TIER 1 – 12.0% up 10bps
                                             Q3FY18                                     CET 1 – 9.1% up 10bps
                                             Y-o-Y growth of 82.9%

Resilient Asset Quality Delivery

       Credit Costs 29bps for                1.98% Total Stressed Book*                 SMA 2 accounts at only
                                             Lower compared to 2.41% in Q3FY18
       Q3FY19 & 64 bps for                   2.10% GNPA                                 0.19% of Gross Advances
       9MFY19
                                         *NNPA + Security Receipts + Std Restructured

Stable Funding and Improving Liquidity Profile

      CASA ratio at 33.3%                  Retail and Corporate TD’s                    LCR at 114.3% as of December
                                                                                        31, 2018
                                           sequential growth of 3.7% & 7.9%
      CASA + Retail TD’s at                                                             Daily Avg LCR improved
      57.5% sequentially improved from     Focused reduction in CD’s                    sequentially to 102.3% from
      57.2%                                by 54.8% sequentially                        99.4%
                                                                                                                       5
Income Growth Trends

 Robust Earnings Delivery                                                      ` Billion             Net Interest Income          Non Interest Income

✓ Strong growth in NII of 41.2% for Q3FY19, driven by                          30
                                                                                                                                                        27
  growth in Advances of 42.2% y-o-y                                            25
                                                                                                                                            24
                                                                                                         22                22
✓ NIMs continue to be stable at 3.3%                                           20
                                                                                           19
                                                                                                                                 17
✓ Non-Interest income de-growth of 37.4% yoy for                               15
                                                                                                14             14                                  15
  Q3FY19
                                                                                                                                                             9
     ▪      predominantly on account of treasury loss (corresponding offsets   10
            through Provision Write-backs) and lower Corporate fees due to
            rebalanced sequential growth in Corporate Advances                  5

✓ PAT improved by 3.9% sequentially despite the                                 0
  accelerated provisions on account of Stressed                                        Q3FY18           Q4FY18           Q1FY19            Q2FY19       Q3FY19

  Infrastructure Conglomerate

                                                                               ` Billion                      Operating Profit        Net Profit
             Yield on Advances           Cost of Funds     NIM
                                                                               30
                   9.9%          10.0%           10.1%       10.2%
    9.8%                                                                                                                   25
                                                                               25                                                           24
                                                                                                         21
                                                                                       20                                                               20
                                                                               20
                                  6.3%            6.4%        6.5%
    6.0%           6.0%
                                                                               15                                                13
                                                                                                               12
                                                                                                11                                                           10
    3.5%           3.4%           3.3%            3.3%        3.3%                                                                                 10
                                                                               10

                                                                               5

                                                                               0
   Q3FY18         Q4FY18         Q1FY19          Q2FY19     Q3FY19                     Q3FY18           Q4FY18           Q1FY19            Q2FY19       Q3FY19

                                               Resilient Earnings despite accelerated provisions
                                                                                                                                                                  6
Non Interest Income Trends
Contribution across Transactional, Corporate, Trade, CMS and Retail Fees
Of which a loss of ` 2.8 Billion
has been recognized with an
equivalent offset/ reversal in
4603
1781 2220 Investment Provisioning
2428
6441 6827 6677
4722
` million
7231
2398 2162 2116 2241
1536
2900 3472 3329 3613 3526
-1602
Q3FY18 Q4FY18 Q1FY19 Q2FY19 Q3FY19
Retail Banking Fees Corporate Trade & cash Management Corporate Banking Fees Forex, Debt Capital Markets & Securities
Retail Banking Fees - Granular Growth
434 512 605
561
372 550 742 513
470 693 241
538 244
272 232
` million
713 813
659 689
771
1291 1154 1402 1355
1015
Q3FY18 Q4FY18 Q1FY19 Q2FY19 Q3FY19
Trade & Remittance Facility/Processing Fee Third Party Sales Interchange/ Direct Banking Income General Banking Fees
Steady growth in Retail fees on the back of rapidly expanding retail franchise
7Key Balance Sheet Growth Trends
Well Segmented Growth As % of Total Advances,
Incremental as on 31st December, 2018
` Billion YoY Growth
Growth Contribution
371 67.8%
83% 23% Corporate Banking
413
203 18% 9%
195 Medium
351 7.8% Enterprises
86% 12%
105 Small and Micro
9.2% Enterprises
1460
1056 38% 56% 15.2% Retail Banking
31-Dec-17 31-Dec-18
Domestic Corporate IBU MSME Retail
Retail Asset Breakup
4% Mortgage Loan Group: HL,
Robust growth attributed to Strong Performance across Segments LAP, Affordable Housing
27% Business Equipment Loan
✓ Corporate growth well segmented across 8 Relationship Group: Construction Equipment,
groups and lending to Higher Rated corporates. Healthcare Finance
▪ IBU Advances grew 86% y-o-y to USD 2.8Bn as on Dec’18 Consumer Loan Group:
42% Personal Loan, Gold Loan, Loan
✓ Healthy growth in MSME driven by focused segmentation Against Shares, Business Loan
and Knowledge Banking approach 11% Vehicle Loan Group : Auto
Loan, Commercial Vehicle,
✓ Retail Disbursements increased by over 18% to ` 60.9 Bn in Inventory Funding
Q3FY19 v/s Q3FY18 16% Self Help Groups & Joint
Liability Group
MLG BELG CLG VLG SHG and JLG
8Well-diversified Liability Franchise
` Billion
YoY Growth CA: 30.7% and SA:4.4% YoY Growth of Retail TD's: 37.2% Corp TD's: 39.9%
38.0% 36.5% 35.1%
` Billion 24.3%
800
33.8% 33.3%
40.0% 1000
23.4%
26.0%
22.9%
21.5%
900
20.8%
700 35.0% 24.0%
800
600 30.0% 22.0%
700
500 444 466 493 446 25.0%
600
20.0%
400
427 20.0% 500 18.0%
826 821 886
300 15.0%
400
795 16.0%
633
540
300
200 10.0%
460 521 14.0%
288 283 259 295 200
394 417
100 226 5.0%
100
12.0%
0 0.0% 0 10.0%
Q3FY18 Q4FY18 Q1FY19 Q2FY19 Q3FY19 Q3FY18 Q4FY18 Q1FY19 Q2FY19 Q3FY19
CA SA CASA Ratio Corporate TD's Retail TD's Retail TD's (as % of Dep)
Improving Operating Leverage further contributing to robust growth in granular deposits
` Million
CASA /Branch 150 1115 1250
665 665 March 2010 December 2018 March 2020
519 Coverage across all 53 Metros, 29 States and 7 Union Territories.
334 364
13 Metro/Urban and 3 dedicated RIBB regions
Hub and Spoke model for faster maturity and greater efficiency
of branch network
Mar'15 Mar'16 Mar'17 Mar'18 Dec'18 Substantial focus on North & West Regions (DMIC/Make in
India/GIB corridor) with evolving network in South & East
Continued Momentum in Granular Deposits
9Strong Risk Management Framework
Knowledge Superior Joint Delegation
Portfolio
Banking Structuring & Approval
Analytics
Committee
One of the Early Warning
Resilient lowest NPA & Problem
Asset Quality Outcomes Ratios Solving
Asset Quality Trends
Robust Asset Quality Maintained
2.50% 95.0%
✓ Prudent Risk Management practices: Strong
72.0% 2.10% Selection process, Superior Structuring and
62.0% 46.9% 75.0%
50.0%
2.00%
44.2% 55.0%
regular portfolio monitoring resulting in healthy
1.50%
1.52% 1.28% Asset Quality
1.18%
35.0%
0.76% 0.81%
0.64%
1.00%
15.0%
0.41% 0.29% ✓ Well distributed portfolio with significant
0.12%
0.50%
-5.0%
0.00% -25.0%
deployment in focused knowledge sectors by
Mar'15 Mar'16 Mar'17 Mar'18 Dec'18 leveraging on sectoral expertise
GNPA NNPA PCR (RHS)
10Sectoral Exposure Mix
Technology/ITES Agri and Aviation (Airports)
Roadways Rubber & 0.9% Allied 0.7%
1.4% Plastic 1.2%
Products Travel, Tourism & Hospitality
0.6% 3.3% Vehicles, Parts &
Paper & Paper Products Beverages
0.4% Telecommunication Equipments 0.4%
Petroleum,
2.6% 2.5%
Coal and Social & Chemical Products (Dyes,
Other Financial Other Fuels Waterways Paints, etc.)
Other Real Estate ( Commercial
Services 2.4% 1.3% All Engg 1.3%
LRD/ Non CRE etc) Infrastructure Textiles
1.9% 3.1% Cement
1.3% 2.5% 1.4% Commercial &
1.3%
Residential
Other Metal & Metal Products Real Estate
2.1% 6.4%
Diversified
1.0% Drugs &
Other Industries Pharmaceuticals
12.2% 1.3%
NBFC Educational Services
3.0% 1.7%
Mining &
Quarrying
0.9%
Media &
Entertainment
Housing Electricity
2.1%
Finance Co. EPC 8.5%
Iron & Steel 3.4%
Food Processing 9.7%
2.7%
2.2%
Granular & Retail Glass & Glassware
9.4% 0.1%
Healthcare & Hospitals (Non Gas storage and pipeline
Infra) Gems and Jewellery 0.2%
1.3% 1.3%
As on 31st Dec, 2018
Well diversified portfolio with significant deployment in YES Bank focused knowledge sectors
11Stable Risk Profile
Rating Profile
22.0% 21.3% 21.0%
Overall Corporate portfolio
13.4% 15.1% 13.3% continues to be well rated with
>75% portfolio rated ‘A’ or better
42.8% 42.8% 43.0% (Based on Internal Corporate rating
models mapped to external ratings)
19.0% 2.8% 18.3% 2.4% 20.3% and well distributed across
2.5%
growth sectors.
Dec'17 Sep'18 Dec'18
BB and Below BBB A AA AAA
Sensitive Sector Disclosure
2.7% 2.6%
Electricity
2.4%
1.9%
1.3%
Non-Renewable Electricity 0.9%
Generation: 2.1% (All Operational)
NIL Exposures to SEBs
Iron & Steel Telecom Gems & Jewellery
Total A & Above
12Asset Quality remains Stable
Q3FY19
S. No Particulars (%) Ex- Infrastructure Q2FY19 Q3FY18
Total
Conglomerate
1 Credit Cost (bps) 29 5 18 18
2.10% 1.32%
2.1 GNPA 1.60% 1.72%
(` 5,159 Crores) (` 3,246 Crores)
1.18% 0.59%
2.2 NNPA 0.84% 0.93%
(` 2,876 Crores) (` 1,442 Crores)
2.3 PCR 44.2% 55.6% 47.8% 46.4%
0.71% 0.71%
3 Net Security Receipts 0.85% 1.06%
(` 1,752 Crores) (` 1,752 Crores)
0.09% 0.09%
4 Std. Restructured Exposure 0.09% 0.42%
(` 210 Crores) (` 210 Crores)
TOTAL (2.2 + 3 + 4) 1.98% 1.39% 1.79% 2.41%
Movement of GNPA
0.2% 0.4%
0.8% 0.03% 2.1%
1.6%
GNPA as on Sep 30, Infrastructure Others Recoveries / Write Offs GNPA as on Dec 31,
2018 Conglomerate Upgrades 2018
13Asset Quality remains Stable
Disclosure on Infrastructure and Financial Services Conglomerate exposure
` 1913 Crores Classified as ` 617 Crores continues to be
NPA with 25% Provisioning Standard with 15%
966 Provisioning
947 529
88
NIL NIL
Roads Energy Maritime Others Ultimate Parent Financial Services sub
The Bank believes that the aggregate provisions made on its operating and subsidiary company exposures are adequate with the expected realizations.
The Bank also has additional Non-Fund based exposure ` 88 Crores to the Stressed Infrastructure Conglomerate as noted above
Minimal impact to NCLT List 1 accounts (0.01% of Gross HFCs at 3.4% of which ~96% externally rated AA or better
Advances), NCLT List 2 accounts (0.26% of Gross Advances)
and RBI circular dated Feb 12, 2018 NBFC at 3.0% of which ~91% externally rated A or better
SMA 2 outstanding exposures (accounts > ` 50 Mn and as per More than 90% of the Top 20 individual borrower
RBI CRILC reporting) at 0.19% of Gross advances exposures are Externally rated A or better
Commercial & Residential Real Estate exposure at 6.4% of The Bank is yet to receive the FY18 Risk Based Supervision
which Nil in SMA 2 report from the RBI
Asset Quality continues to Demonstrate Resilience
14Stable Capital Position
supported by growth through Internal Accretion
Tier I Ratio 9.7% 10.7% 9.9% 9.2% 10.9% 13.3% 13.8% 13.2% 14.7% 13.2% 12.8% 11.9% 12.0%
` Billion ` Billion
4000 B AT1– INR 400
54 Bn.
3500 QIP – US$
350
750Mn.
3000 300
B AT1– INR
2500 250
30 Bn.
2000 200
1500 150
1000 100
500 50
0 0
RWA Tier 1
✓ Total Capital Funds at ` 532.7 Bn, up 22% Y-o-Y ✓ Demonstrated ability to raise capital across cycles; reflecting
excellent market appetite for YES Bank capital qualifying bonds
▪ Total CRAR at 17.4%*
▪ Raised ` 30.42 Bn of Basel III Tier II Bonds in Q2FY19
▪ Tier I ratio of 12.0%* ▪ Raised ` 70.00 Bn through private placement of Basel III Tier II Bonds in
two tranches
▪ CET I ratio at 9.1%*
▪ Raised ` 54.15 Bn in last one year through issue of Basel III complaint
AT I
* Including profits
Stable capital position to enable capturing Market Share
15YES BANK PROFILE
16YES Bank – Vision, Mission, Brand Ethos & Strategic Pillars
Vision: Building the Finest Quality Large Bank of the World in India
Mission: To establish a high quality, customer centric, service driven,
private Indian Bank catering to the ‘Future Businesses of India’
Brand Ethos: To be the Professionals’ Bank of India
Strategic Pillars
Broadening Customer MINDSHARE Building MARKETSHARE
17Large Bank Growth Phase (FY16-20):
Strong Growth with increasing Granularity
` Billion
2035 2007
✓ 4th Largest# Private Sector Bank with Total Assets in
excess of ` 3.7 Trillion
1429
1323
✓ One of the Fastest Growing Large Bank in India; 1117
982 912
▪ CAGR (FY15-18): Advances: 39%; Deposits: 30%
755
✓ Core Retail Advances grew by 122% CAGR (FY15-18);
constitutes 15.2% of Total Advances (as on Dec’18)
✓ CASA growing at 51% CAGR (FY15-18);
CASA Ratio of 33.3% of Total Deposits (as on Dec’18). Advances Deposits
FY15 FY16 FY17 FY18
YES Bank Advances CAGR (FY16-18) of 39% V/s Industry CAGR of 8% resulting in Increasing Market Share
Market Share
✓ Well segmented growth including lending to Higher 4.0%
2.3% 3.0%
Rated Customers resulting in consistently Improving 3.5%
1.7%
Rating Profile 3.0%
1.1% 1.3% 2.0%
2.5%
1.7%
1.0%
✓ Deposits Market Share increased by 70% in 3 years to
1.3%
2.0%
1.7% in FY18 (1.9% as on Sep 30, 2018) 1.5%
1.0% 1.2% 0.0%
▪ Capturing Incremental Market Share at 6.9% in FY18 1.0%
-1.0%
0.5%
✓ Advances Market Share more than doubled in 3 years to 0.0% -2.0%
2.3% in FY18 (2.6% as on Sep 30, 2018) FY15 FY16 FY17 FY18
▪ Capturing Incremental Market Share at 9.2% in FY18 Deposits Advances
18Large Bank Growth Phase (FY16-20):
Sustained Profit Delivery with Best in Class Return Ratios
` Billion Steady Growth in Income Streams
✓ Amongst the most Profitable Banks
✓ One of the lowest C/I ratios in the Industry; 52
• 40.5% as on Dec’18 (post adjusting for provisions write
42
back from investments)
27
20
✓ CAGR (FY15-18): 77
46 58
✓ Net Interest Income: 30% 35
✓ Non Interest Income: 37%
✓ Net Profit: 28% FY15 FY16 FY17 FY18
Net Interest Income Non Interest Income
` Billion Consistent Profit Delivery Healthy Return Ratios
42 2.0%
1.8%
1.6% 1.7% 1.6% 24.0%
33 1.5%
22.0%
21.5% 20.0%
25 19.9% 18.0%
1.0%
19.0%
20 17.7% 16.0%
0.5% QIP – US$ 14.0%
750Mn.
12.0%
0.0% 10.0%
FY15 FY16 FY17 FY18
FY15 FY16 FY17 FY18 RoA RoE
19Seasoned Corporate Banker:
Capturing market share with lending to Better Rated Corporates
` Billion CAGR of 41% (FY15 to FY18)
195 Healthy Growth Delivery continued:
144
✓ Strong growth across all Corporate Segments including
IBU book
60
1460 ✓ Lending to better Rated Corporates resulting in
1237
improving Risk profile: A & Above rated exposure > 75%
836
639
499
✓ RWA/Total Assets improved to 81.9% from 84.3% y-o-y
indicating incremental lending at lower Risk Weights
Mar'15 Mar'16 Mar'17 Mar'18 Dec'18
Domestic Corporate IBU
Opportunities Inherent Enablers for Quality Corporate Growth
✓ Financing ▪ 8 Focused Corporate Relationship Groups including IBU– Expertise across Product
& Relationships & Risk – Further supported by Complete Product Suite
Seasoned Assets:
Eg. NCLT ▪ Knowledge Banking Driven Solutions through Sectoral Expertise
▪ Size, Scale and Expertise: Ability to underwrite large commitments basis increasing
✓ Refinancing SBL/GBL limits coupled with Strong Syndication Capabilities
Opportunities
▪ Technology & Services Leadership: Superior Customer Experience driven by cutting
✓ New Economy Edge Technology such as API Bank/Blockchain driving
Capex (Part of ▪ Favorable Competitive Dynamics
Knowledge
▪ Prudent Risk Management Practice: CRM Based Origination reducing Adverse
Banking Sectors) Selection Bias coupled with Superior Structuring Capabilities
20MSME Financing:
Banking MSME since Inception
` Billion MSME CAGR of 27% (FY15-18) Healthy Growth in MSME Advances with best in class Portfolio:
✓ 3 focused Relationship Groups:
▪ MEB (` 1,000- 5,000 Mn): CRM based acquisition through 250+ Sector
209 223 Specialists Relationship Managers. Avg. Ticket Size - ~` 120 Mn+
▪ SEB (` 150-1,000 Mn): Sourcing through penetrating Supply chain of
163 Anchor Corporate Relationships. Avg. Ticket Size - ~` 25 Mn+
128
92 ▪ MIB (` 0-150 Mn): Small Ticket granular lending leveraging on branch
distribution network. Avg. Ticket Size - ~` 5 Mn+
197 190
109 139 ✓ Healthy Portfolio Quality:
106
▪ Mix of Manufactures, Traders and Vendors/Dealers of Marquee
Anchor Corporates
Mar'15 Mar'16 Mar'17 Mar'18 Dec'18
▪ Cash Flow based lending with focus on obtaining preferential
Medium Enterprises Small and Micro Enterprises property of Promoter as collateral
▪ Stringent Valuation Methodology for Collaterals, including
Valuation Report by dual Independent Agencies and an Internal
Audit team to maintain range bound LTV
Road going Forward
▪ Continued focus on Sole Banking Relationships (SEB & MIB) and Primary
Opportunity: Banking Relationships (MEB)
✓ Acceleration in ‘New To ▪ Deepening entrenchment in MSME Ecosystem: Focus on Cross Sell of
Credit’ Customers into Formal Trade/CMS/Forex & Investment Banking products to create hooks
Credit Sector due GST and ▪ Technology & Services Differentiators: Initiatives such as GST Invoice
Demonetization Financing (First Bank to Launch), API Banking etc to drive acquisition.
Industry First SME App for customer self-servicing
✓ Policy Support for MSMEs
such as Tax Incentive ▪ Using Analytics basis GST filling/ Cash Flows for automated continuous
Portfolio Monitoring
21Retail Assets:
Rolling Momentum to drive growth
Strong Growth Momentum in Retail Assets:
400
` Billion CAGR of 54% (FY15-18) 16.0%
350 15.2%
14.0% ▪ Retail Assets improved to 15.2% of Total Advances with a target to
10.8% reach 1,250 branches by 2020
12.2%
300 12.0%
9.1% 9.4%
250 10.0% ▪ Contributed 23% qoq incremental growth in Q3FY19
200 8.0% ▪ Diversified book across all 13 Products
371
150 6.0% ▪ Focus on building quality Customer Franchise through offering of
248
100 4.0% entire gamut of product & services
50 106 125 2.0% ▪ 1st Issuer in India on MasterCard most prestigious ‘World Elite
69
0 0.0%
platform’ through YES Private
Mar'15 Mar'16 Mar'17 Mar'18 Dec'18 ▪ Fastest to achieve 400k Cards-in-force & ~ ` 7 Bn. of outstanding
Retail Advances book with immaculate quality
Retail Advances (as % of Total Advances) ▪ World Class Technology and Risk Management Systems to
provided round the clock service – Vision Plus & Falcon (First Data)
Opportunities Key Enablers for Strong Momentum in Retail Assets
✓ Limited Players offering ▪ Established credible Long term alternate for full scale Banking Offerings in Retail
entire gamut of Assets in Indian Banking Industry
Products across Assets, ▪ Experienced Leadership: Having witnessed multiple Retail cycles
Liabilities & Wealth ▪ Relationship Based Sourcing: Strong Industry Associations and Tie up with
Ecosystem Manufacturers and Dealers as preferred Financiers
▪ Leveraging Expansive Reach through 1,100+ branches further augmented by
✓ Evolving consumer Digital channels
landscape through ▪ Harnessing Technology to improve efficiency & enhance experience: 1st Bank
quality service on the to launch Bots for faster acquisition and 24x7 superior experience
back of Digitization, &
▪ Quality Sourcing through Stringent Risk Controls. Further, Continuous
Technology monitoring though analytics
22Building Relationships & Credibility as
- Long Term Consistent Player
Acquisition Strategy Underwriting Portfolio Mix
✓ B2B2C Strategy – Alliances ✓ Cash Flow ✓ Healthy Traction in
with Key Manufacturers to based Credit CV & CE book
drive sales across the entire Underwriting given visible
Value Chain improvement in
Commercial ✓ Business
Infrastructure
✓ Consistent seamless execution analytics for
Retail Sector
capabilities: establishing YES Early Warning
Signals and ✓ Focus primarily on
Bank as Key Player in
bounce trends large fleet
Commercial Assets Business
operators
✓ Tie Ups with Manufacturers ✓ Lending with ✓ ~70% of the
(Auto) & Builders strong risk Consumer Retail
(Affordable Housing) & mitigation book is secured
Associations Eg: Partnering controls loans
Consumer with FADA (Federation of
✓ Scorecard ✓ PL contributes
Retail Automobile Dealers ~10% of the total
Based
Associations) to train 15K Retail book,
underwriting
Auto Retailers where focus is on
✓ Focus on Internal Customers internal
& Corporate Salaried customers only
Leveraging Alliances, Relationships & Technology for Enhanced Customer Acquisition
23Debt Ratings Journey
Rating Upgrade Rating Upgrade: Rating Upgrade: CARE
ICRA & CARE ICRA & CARE Upgraded to highest AAA rating for Basel III Tier
LT II:AA, Basel III Tier II: AA+, II & Infra Bonds
UT II:AA- INFRA BONDS:AA+ Upgraded to AA+ for ATI perpetual bonds, highest
across all Banks
Re-iteration of Rating by Moody’s at Baa3 and
FY11 FY17 ICRA at AA+
FY19
FY10 FY14
Basel III AT1 rating of AA from CARE,
Received maiden International India Ratings and ICRA Rating Downgrade: Moody’s, CARE & ICRA
Investment Grade Baa3 long
term rating from MOODY’S Rating upgrade of maiden AT1 issuance
Investor Services under Basel regime by ICRA
International Rating Long-term Outlook Short-term
Moody's Investors Service Ba1 Negative Not Prime
Domestic Rating Long-term Outlook Short-term
Basel III AT1 Tier II Infra Bonds
Credit watch with
CARE AA AA+ AA+
developing implications
Rating watch with
ICRA AA- AA AA A1+
negative implications
India Ratings AA AA+ AA+ Negative
Ratings reflect a sustainable growth oriented financial model with robust Risk Management Policies
24Commitment from Leading Global Financial Institutions
USD 415 Mn for 12 yrs USD 50 Mn for 7 yrs
To increase lending to MSME and Women Green infra Bonds- FMO’s 1st investment in a
owned business Green Bond by a bank in India
USD 325 Mn for 9 yrs (avg) USD 200 Mn for 7 yrs
Upper Tier II, Long Term Senior Loan, Green Lending to Women SHGs & Small Farmers and
Bond issue & to lend to women-owned business Technical Assistance Grant for Capacity Building
USD 200 Mn for 15 yrs USD 30 Mn for 8 yrs
Financing agreement for Renewable Green Loan by Development Bank of
Energy Projects in India Australia
USD 84 Mn (granted in 2009, 2014 & 2017) EUR 13.25 Mn for 10 yrs
Long term Senior Loan by KfW Bankengruppe Upper Tier II loan by An AfD Group
Development Financial Institution Development Financial Institution
Successful Long Term Loan Syndications
3 year Syndicated Loan of USD 400 Mio 5 year loan from Taiwan : USD 250 Mio
Maiden Samurai loan of JPY 16.5 Bln
Participation from 17 banks in Taiwan, Nov ‘17
Participation from 12 banks, July 2018 Syndication led by
Participation from 8 banks, Sept 2017
3 year syndicated loan of USD 300 Mio led by
5 year loan from Taiwan : USD 130 Mio
Participation from 8 banks Participation from 10 Taiwanese banks, Sept ‘16
Progressively broader markets, higher number of participants with longer tenor and improved pricing
25Sustainable & Responsible Banking Leadership
VISION: Be the Benchmark Financial Institution for Inclusivity and Sustainability
Environmental Social Governance
Committed to mobilizing USD 5 billion Launched India’s 1st Green Retail First & only Indian Bank to be listed on DJSI
towards climate action by 2020 in Liability Product in 2018, Green Future Emerging Markets for 4 years consecutively
December 2015 Deposits (2015-2018)
Committed to mobilize USD 1 billion by Sole arranger & subscriber to India’s Selected in prestigious FTSE4Good
2023 towards solar projects, and USD 5 First Social Bond, with proceeds Emerging Index for two consecutive years
billion till 2030 in January 2018 allocated to Affordable Housing (2017,2018)
First Indian Bank to launch Green Bonds in Reached 2.1 million families at the Selected in MSCI ACWI ESG Leaders & SRI
2015 bottom-of-the-pyramid through Indexes in 2017
Private placement by IFC for Green Masala Inclusive & Social Banking Included in Vigeo Eiris Best Emerging
Bonds in 2015 Provided access to 40 million+ lives Markets Performers Ranking (2018)
Issued Green Infra Bonds with FMO in with safe & clean drinking water in Only Indian Bank to be awarded ‘Prime’
2016 2017-18 Status by OEKOM Research Ag
First Bank Globally to migrate to ISO Provided OHS & Energy Efficiency First Indian Banking Signatory to UNEP
14001:2015; 744 locations certified training to 28, 454 workers, and helped Finance Initiative
18,544 MSMEs eliminate an estimated
First & only Indian Banking signatory to First Indian Bank to launch Green Bond
13, 500 tons of CO2e in 2017-18
Natural Capital Finance Alliance (NCFA) Impact Report
& Chair of Steering Committee First Indian Bank to Support Task Force on
Climate Related Financial Disclosure
26Progress Widely Recognized By Leading
Agencies
The Asset
Global SME Triple A Country FORBES
Finance Awards Awards GLOBAL 2000
Product Innovation of Best New Bond Global winner Ranked #1,013 Bank of the Best Bank in
Institutional the Year Award India Payments Global 2000 Year India, India for SMEs
Excellence International Finance The Asset Triple A Technology Project
Ranked #155 Growth 2017, 2015 Asiamoney
Corporation’s (IFC’s) Country Awards Champions
Awards Forbes Global 2000 The Banker Country Awards
Global SME Finance 2018
Awards London, 2018 World’s Largest London Hong Kong, 2018
Public Companies
2018
June 2018
Asian Banking
& Finance
Wholesale Banking
Awards 2018
Technology, Transaction Bank Best Trade Finance Bank in India - 2018, 2017, 2016, 2015 ▪ SME Bank of the APAC Leader in Instant Payment
Best Financial Supply Chain, 2018, 2017 Year - India Digital Transformation Products
Innovation & of the Year - APAC
Best Corporate Payments Project in India, 2018, 2016 (UPI+IMPS+BHIM+
Supply Chain Finance ▪ India Domestic IDC Financial Insights
Service - Global Winner
Best Corporate Trade Finance Deal in India, 2018, 2015
Trade Finance Innovation Awards USSD)
Best API Initiative, Application or Platform (Bank), 2018
Bank of the Year (FIIA) National Payments
The Banker- Best Blockchain Initiative, Application or Programme, 2018
Transaction Banking Best Productivity, Efficiency & Automation Initiative, Bali, 2018 Singapore Excellence Awards
Awards 2017 Application or Programme, 2018 2018 (NPCI) 2017
Asian Banker Transaction Banking Awards 2018
Sibos, Toronto Beijing
Dow Jones Natural Capital Coalition
Sustainability Indices MSCI ESG
Sustainability First & only Indian bank 1st Indian Bank to join Included in India’s Best Bank Best Innovation &
to be selected for the ‘Natural Capital Coalition’ For Corporate Sustainable
& CSR - a global multi-
MSCI ACWI ESG
Financial Products
fourth consecutive year Leaders Index and Social
Excellence stakeholder collaboration MSCI ACWI SRI & Services
DJSI Emerging Markets uniting global natural Responsibility
Index Karlsruhe Sustainable
Index capital community Asiamoney
2017 Finance Awards,
New York, 2018 Excellence Awards Germany, 2017
Hong Kong - 2017
27DIGITAL BANKING
28YES Bank adopts A.R.T of Digital Banking
Customer Service
Increase Operational Efficiency
Be omnipresent
Deepen Existing Relationships
Identify new customers
Explore new business lines
Innovate with Frugal Technology
Experiment with Future Technology
A.R.T makes the bank SMART by giving bank the agility to ally with like minded technological partners
29Leader of New Age Payments
UPI
IMPS Highest market share of 30% in
UPI Merchant payments as
1st rank (as a Remitter Bank) in evaluated by NPCI
peer banking group by NPCI
100 Mn+ UPI ID
72% YoY increase in
transaction vol.
NEFT & RTGS AePS
Market share of 2.92% by vol. One of the leading Acquirer
& 2.38% by val. has been Bank
consistently higher than peers
45 Mn.+ transactions in
(as on Nov. 2018).
Q3FY19
Consistently ranked 1st by Market share in UPI Merchant payment space by NPCI in CY2018
30Industry First Solution for Customers
▪ 1st Indian bank to ▪ India’s first app to ▪ Industry first ▪ 1st Bank to offer
offer API Banking offer single platform initiative to apply for paperless import &
suite for CMS and for multiple banking a credit facility export online
Supply Chain Finance needs across Asset, anytime, anywhere
▪ 800+ Corporates on
service Trade and Liabilities
▪ MSME can avail OD the trade on net
▪ Winner across 4 ▪ Industry first (over draft) up to ` 1 platform.
award categories features: crore based on
▪ Transaction volume
including ‘Best uploading GST
✓ Bulk Payment on on SMART TRADE
Blockchain Initiative returns and
Mobile App platform has
Application or commercial/residenti
increased by over
Platform’ & ‘Best ✓ Dedicated Salary al property papers
2.5x YoY
API Initiative, management module
▪ No Physical
Application or ▪ Adjudged ‘Best
✓ Digital submission of documentation,
Platform (Bank) for Trade Finance Bank
Stock Statement
API Receivables and ▪ In-principle offer in India’ at the Asian
/Insurance
Payment Solution for within 24 Hours Banker Transaction
Sub-Member Banks’ ▪ One in every 3 app Banking Awards 2018
at the Asian Banker registration has
Transaction Banking resulted in successful
Awards 2018R disbursement
31Mobility driven Solutions for Anywhere Banking
Mobile app registrations have increased ~1.75x YoY
Transactions increased ~1.75x by vol. and ~2.3x by val. YoY
Financial trx. volume crossed ~35 lakh in Q3FY19
YES
Mobile
First chatbot enabled wallet
BHIM YES PAY app is
powered with India Stack
1 in 3 NRI customers Tab YES API’s and NPCI products,
sourced digitally
Banking Banking Money enabling services like BBPS,
Bharat QR, RuPay card, IMPS,
as a UPI and Aadhaar KYC
Transaction volume increased
Service over 30% QoQ
First & one of the largest BHIM Yes YES ROBOT leads the way with
domestic remittance platform
SimSePay
Pay multiple industry first offerings
Over 2.75 lakh BC agents - Instant opening of FD/RD
employed - Credit Card Management
Services
- Supports over 65 retail
liabilities and asset products
Over 10 lakh interactions processed in
Q3FY19
32LEADERSHIP TEAM
33Distinguished Board
Mr. Brahm Dutt Lt Gen (Dr.) Mukesh Dr. Pratima Sheorey
Non Executive Part-Time Sabharwal (Retd.) Independent Director
Chairman Independent Director
Former Secretary, Ministry of Former Lt General in Indian Army Director of Symbiosis Centre
Road Transport and Highways, for Management and Human
GOI Resource Development
(SCMHRD)
Mr. Ajai Kumar Mr. Subhash Kalia Mr. Uttam Prakash Agarwal
Interim MD & CEO Non – Executive Additional (Independent)
Non- Independent Director Director
Ex-CMD of Corporation Bank and Former Executive Director of Ex-President of ICAI 30 years of
a veteran Banker Union Bank of India and Vijaya experience in taxation, finance and
Bank restructuring
Mr. T.S Vijayan Mr. Maheswar Sahu Mr. Anil Jaggia
Additional (Independent) Additional (Independent) Additional (Independent)
Director Director Director
Former IRDAI Chief Former Additional Chief Former Chief Information Officer
Secretary, Govt. of Gujarat (CIO) HDFC Bank
9 eminent personalities as Directors with varied backgrounds, pioneers in respective fields
Well structured performance evaluation process for its Directors including MD & CEO
12 Board level Committees with specialized functions including Risk Monitoring Committee,
Corporate Social Responsibility Committee, Audit Committee and Nomination & Remuneration
Committee
Best Corporate Governance and Transparency
Majority of Board constituted by Independent Directors
Pedigree Board ensuring transparency and highest standards of Corporate Governance
34Human Capital Management
Making YES BANK a Great Place to Work Flat Organization Structure (5 levels)
✓ `First and only Bank to partner with “Kaizala Full Digital Average Age
ONLY – Customer & Colleagues self-service channel”, 119 46
Top
powered by Microsoft.
Leadership Training Initiatives by YES School of 345 42
Senior
Banking
Middle 3,931 37
Junior 11,485 32
University & Schools Relationship Management
‘Preferred Employer of Choice’
General 5,302 28
*As of Dec 31, 2018 and as per revised segmentation
✓ YES League of Excellence – an online Recognition,
Appreciation & Engagement platform ✓ Total Headcount of 21,182
✓ Structured engagement with over 2000 B-Schools ✓ Average Age – 32 years
HCM Strategy ✓ Average vintage in YES BANK: 8.3 yrs for Top Management &
6.4 years for Sr. Management
✓ Competitive C&B to attract, motivate and retain talent
✓ ‘Professional Entrepreneurship’ Culture based on values ✓ Wealth creation through ESOPs
to sustain competence, collaboration and compliance. ✓ Talent acquisition from Peer Private Sector & MNC Banks
✓ Robust & Diversified Talent Acquisition
✓ Building a ‘Leadership Supply Chain’
✓ World class HCM Service Delivery & Process
✓ Ranked no 2. in Dream Companies to Work For by Times Ascent
✓ Initiatives to continuously enhance organizational and
individual productivity/effectiveness/cost management. ✓ Golden Peacock National Training Award’ 2018
35YES BANK’S SUBSIDIARIES
36YES Securities
✓ Incorporated in March 2013 as a wholly-owned subsidiary of YES Bank Limited
✓ Member Broker (NSE & BSE) ✓ Category 1 – Merchant Banker ✓ Investment Advisor
✓ Research Analyst ✓ AMFI-registered Distributor ✓ Commodities Broker (in process)
Wealth Broking & Investment Advisory
Financial Multi-Asset Robust Review & Estate & Tax
Planning Advisory Execution Rebalance Planning
✓ Wealth Focused Proposition with end-to-end advisory and execution capabilities
✓ Digital-first Investor Experience across investment platforms
Investment & Merchant Banking
✓ Highly-experienced team has successfully completed 200+ deals in the last 10 years
✓ Dedicated “Sustainable Investment Banking” team focused on renewables, waste management, education
✓ 2018 Global Finance – Best Investment Bank in the Country (India)
✓ Top 10 – PRIME Database ECM India league tables for FY2018 (Ranked 6th by Deal Count and 7th by Deal
Value of Public Equity Issuances)
37YES Asset Management
Operating Model Customer Segments and Funds Category
Customer Segment Solution
Lean Operating Model with Simple Mix of Schemes and
optimizing of the Distribution network Liquid and Treasury
Institutional
Management
Outsourced/ Right Source Model: To partner with Retail Debt /Equity, SIP/ETF
Industry Best service providers: Operations, Data-Centre
services are outsourced Debt/ Equity/Structured
HNI
Product
Digital First Approach for superior Customer Service for Scheme Categories
both Investors and Distributors
Liquid/ Ultra Short Term Short Term Debt
Building a Robust Framework with Best in Industry
Long Term Debt Equity and ETF’s
Processes and Partners
Key Highlights
• Received SEBI Approval to Launch 2 Funds- YES Liquid Fund & YES Ultra Short Term Fund
• Successfully closed the 1st NFO, Yes Liquid Fund, with participation from over 100 cities from both
Corporate and Retail Investors
• Active in over 200 Locations in India via key alliances and available on Digital platform
YES Asset Management will build on its Key Pillars to provide an Investor driven culture to all its stakeholders
38ANNEXURES
390
Diversified Shareholding Base
✓ Well Diversified holding with
healthy mix of Marquee FIIs &
Shareholding Pattern as on December 31, 2018
DIIs such as
▪ LIC
▪ Reliance MF
Others, 6%
▪ Kotak MF
Resident ▪ Templeton MF
Individuals, 17% FII's, 36%
▪ SBI MF
▪ UTI MF
Insurance ▪ T. Rowe Price
Companies, 11%
▪ Vanguard
▪ Vontobel
Mutual Funds, ▪ Jasmine Capital
Promoter &
10% Promoter Group,
▪ Govt. Pension Fund
20% ▪ Ward Ferry
✓ Constituent of Nifty 50, Sensex
30, MSCI EM, MSCI India
indices
✓ Leadership in ESG - Only
Indian Bank to be included in
MSCI ESG, DJSI, FTSE4Good
Emerging Indices and awarded
‘Prime Status’ by OEKOM
40Key Financial Parameters
Profit & Loss
Growth % Growth %
` Million Q3FY19 Q3FY18 Q2FY19
(y-o-y) (q-o-q)
Net Interest Income 26,664 18,888 41.2% 24,176 10.3%
Non Interest Income 8,909 14,223 -37.4% 14,735 -39.5%
Total Net Income 35,573 33,111 7.4% 38,910 -8.6%
Operating Expense 15,669 13,093 19.7% 15,246 2.8%
Operating Profit 19,904 20,018 -0.6% 23,664 -15.9%
Provisions & Contingencies 5,502 4,213 30.6% 9,400 -41.5%
Profit After Tax 10,018 10,769 -7.0% 9,647 3.9%
Balance Sheet
Growth Growth
` Million 31-Dec-18 31-Dec-17 30-Sep-18
Y-o-Y Q-o-Q
Assets 3,739,812 2,654,320 40.9% 3,716,472 0.6%
Advances 2,438,852 1,715,149 42.2% 2,396,275 1.8%
Investments 830,178 654,187 26.9% 903,202 -8.1%
Liabilities 3,739,812 2,654,320 40.9% 3,716,472 0.6%
Shareholders’ Funds 284,027 245,543 15.7% 273,310 3.9%
Total Capital Funds* 532,730 435,963 22.2% 512,923 3.9%
Borrowings 1,076,913 563,016 91.3% 1,016,595 5.9%
Deposits 2,227,584 1,717,314 29.7% 2,228,379 0.0%
CASA 741,167 652,890 13.5% 752,791 -1.5%
* Including profits 41No representation or warranty, express or implied is made as to, and no reliance should be placed on, the fairness, accuracy, completeness or correctness of such information or opinions
contained herein. The information contained in this presentation is only current as of its date. Certain statements made in this presentation may not be based on historical information
or facts and may be “forward looking statements”, including those relating to the Company’s general business plans and strategy, its future financial condition and growth prospects,
and future developments in its industry and its competitive and regulatory environment. Actual results may differ materially from these forward-looking statements due to a number of
factors, including future changes or developments in the Company’s business, its competitive environment and political, economic, legal and social conditions in India. This
communication is for general information purpose only, without regard to specific objectives, financial situations and needs of any particular person. This presentation does not
constitute an offer or invitation to purchase or subscribe for any shares in the Company and neither any part of it shall form the basis of or be relied upon in connection with any
contract or commitment whatsoever. The Company may alter, modify or otherwise change in any manner the content of this presentation, without obligation to notify any person of
such revision or changes. This presentation can not be copied and/or disseminated in any manner.
Thank youYou can also read