Fixed Income Presentation Q1 2020 results - May 12, 2020 - Aareal Bank

Page created by Reginald Hogan
 
CONTINUE READING
Fixed Income Presentation Q1 2020 results - May 12, 2020 - Aareal Bank
Fixed Income Presentation
Q1 2020 results

May 12, 2020
Fixed Income Presentation Q1 2020 results - May 12, 2020 - Aareal Bank
Agenda

         ▪ Business development in times of Covid-19 and
           Highlights Q1/2020
         ▪ Introduction of Aareal Bank
         ▪ Asset Quality
         ▪ Segments
         ▪ Group results Q1 2020
         ▪ Capital, B/S, Funding/Liquidity
         ▪ Outlook 2020
         ▪ Take aways

         ▪ Appendix

2
Fixed Income Presentation Q1 2020 results - May 12, 2020 - Aareal Bank
Business development in times of Covid-19 and
Highlights Q1/2020

3
Fixed Income Presentation Q1 2020 results - May 12, 2020 - Aareal Bank
Business development in times of Covid-19
The Covid-19 crisis is shaking the world

    What we see: The perfect storm

    Covid-19 caused the sharpest global recession in post-war history - with dramatic effects on all sectors of the economy

    How Aareal Group entered into this crisis: Robust and resilient

    ▪ Conservative risk profile:    High quality credit book with historically low LTVs

    ▪ Strong capital base:          Ratios offering substantial leeway to absorb potential crisis effects

    ▪ Solid liquidity position:     Business activities comfortably funded on the basis of our stable and unique funding mix

    ▪ Well-diversified business: Aareon remains on track due to well positioned digital business model
                                 and a high level of recurring revenue

    What we expect: gradual recovery

    We assume a continuous normalisation of the global economy from mid 2020 onwards,
    followed by a significant recovery (“Swoosh” shaped) in 2021

4
Fixed Income Presentation Q1 2020 results - May 12, 2020 - Aareal Bank
Highlights Q1/2020
Robust underlying performance while managing Covid-19 challenges

                  Solid Group
                  Financials
                                ▪ Positive Q1 results (operating profit € 11 mn),
                                  despite Covid-19 impacts and FY-banking levy
                                ▪ Strong capital and liquidity position

                  Resilient
                  Segment       ▪ SPF:      Strong new business with margins above plan
    Aareal Bank
                  Performance               Sound asset quality with comfortable LTVs
    Group
                                ▪ C/S Bank: Significantly better results due to new modelling of deposits.
                                            Additionally improved earnings statement via adjusted transfer
                                            pricing
                                ▪ Aareon: Further growth, marginal Covid-19 effects in Q1/2020

                  Outlook
                                Based on our assumptions and from today’s point of view, we consider
                                a substantially positive operating profit to be within reach. (see slide 36)

5
Fixed Income Presentation Q1 2020 results - May 12, 2020 - Aareal Bank
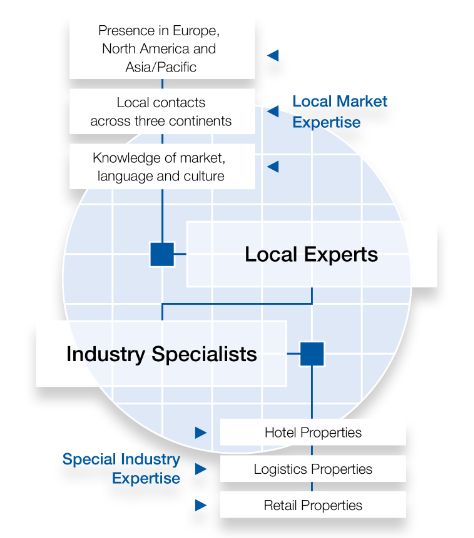
Introduction of Aareal Bank

6
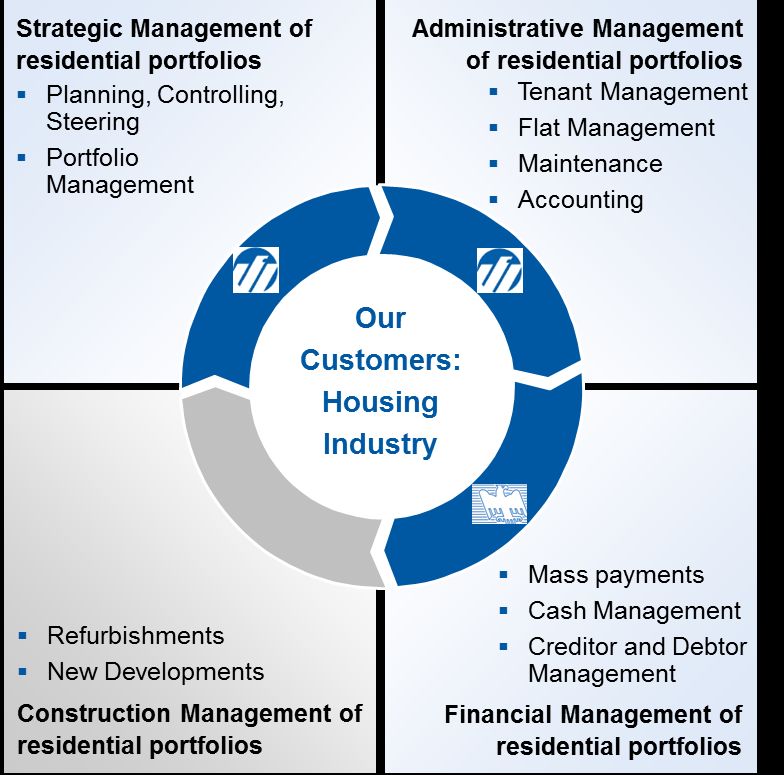
Aareal Bank Group
The new lineup - THREE segments

Structure Property Financing (SPF)                Consulting / Services (C/S) Bank                        Aareon

Commercial Real Estate Financing                 Integrated payment transaction            European leader for real estate
solutions on three continents:                   system for the housing industry           software, 60+ years in the market
Europe, North America, Asia/Pacific              (market-leading) and the utility sector   serving c.3.000 customers and 10m+
                                                                                           units with 40 locations in GAS,
Diverse property types
                                                 Financial Solutions:                      Netherlands, France, Nordics and UK
(hotel, logistic, office, retail, residential,
student housing);                                ▪ Payment processing provider             Mission-critical ERP and a broad set of
additional industry experts in hotels,           ▪ Deposit Bank                            modular Digital Solutions built on a
logistics and retail properties                                                            cloud-enabled PaaS platform
Investment finance                               Software Solutions:                       Sustainable and resilient business
(Single asset, Portfolio, Value add)             ▪ Intelligent solutions to improve        model with strong downside protection
                                                   connectivity and efficiency for bank    delivers decades of consistent
Portfolio size: ~€ 26 bn; Ø LTV: 57%               and non-bank customers                  profitable growth
                                                 ▪ Ø deposit volume of € 10.5 bn
                                                                                           Experienced leadership team
                                                   in Q1 2020                              combining deep software expertise and
                                                                                           longstanding real estate experience
                                                                                           with a strong M&A roll-up track record
                                                                                           (with 675+ Software engineers)

7
Aareal Bank Group
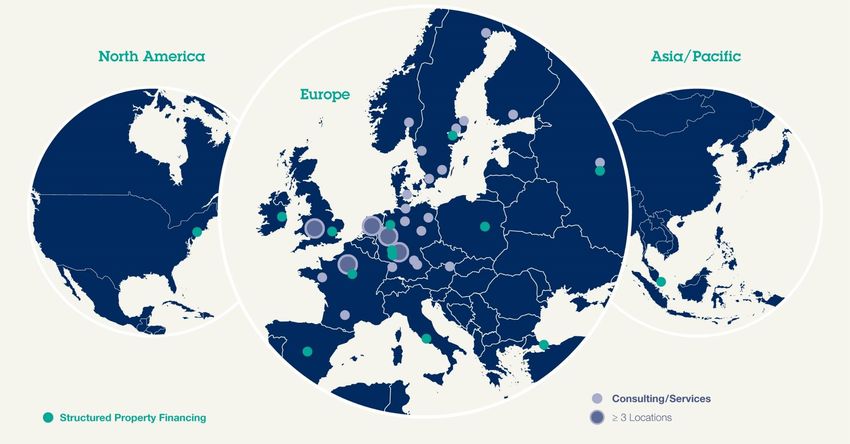
One Bank – three segments – three continents

                                     International property financing in more than 20 countries –
                                               Europe, North America and Asia / Pacific

8
    Note: All 2019 figures preliminary and unaudited
Aareal’s ownership structure
100% Free Float

    Aareal Bank AG
    ▪ Listed in the German MDAX
    ▪ 59,857,221 outstanding shares
    ▪ 100% free float
    ▪ 2,827 employees
                        100%
    ▪ Balance Sheet: 41.1 bn €
    ▪ Flat hierarchies

    Stock performance since 01. Jan 2003

    45 €
    40 €
    35 €
    30 €
    25 €
    20 €
    15 €
    10 €
     5€
     0€

9
Aareal Bank Ratings

 Issuer Default Rating 1)                        BBB+                          Issuer Rating          A3

                                                                               Short-term Issuer
 Short-term                                      F2                                                   P-2
                                                                               Rating

                      1)                                                       Bank Deposit Rating    A3
 Deposit Rating                                 A-

                                                                               Baseline Credit
 Senior Preferred 1)                            A-                                                    baa3
                                                                               Assessment

 Senior non Preferred 1)                         BBB+                          Mortgage Pfandbriefe   Aaa

 Viability Rating     1)
                                                 bbb+

 Subordinated Debt 1)                            BBB-

 Additional Tier 1 1)                            BB

       1)   Rating changes as of 27.03.2020
            Fitch has downgraded Aareal Bank AG's Long-Term IDR to 'BBB+ and
 10         placed Aareal's VR, Long-Term IDR, DCR and debt ratings on RWN
Asset Quality

11
Commercial real estate finance portfolio (CREF)
€ 25.3 bn highly diversified and sound

                                Portfolio by region                                                            Portfolio by property type
                                                                                                            Residential:   1
(vs. 12/2019)                                       Asia / Pacific:                    (vs. 12/2019)                                Others: 2% (1%)
                                                         3% (3%)                                            5% (5%)
                                                                                                   Logistic: 7%
       North America:                                                                                (8%)
       31% (30%)
                                                              Europe West:                                                                  Hotel: 34%
                                                              34% (35%)                                                                       (33%)

                                                                                                 Retail: 24%
         Europe East:                                                                              (24%)
                                                            Europe South:
         4% (3%)                                            12% (12%)

                Europe North:                      Germany:                                                                        Office: 28% (29%)
                5% (5%)                            11% (12%)

                         Portfolio by product type                                                             Portfolio by LTV ranges2)
(vs. 12/2019)         Develop-                                                         (vs. 12/2019)   60-80%: 4% (4%)             > 80%: > 0% (0%)
                                                     Other: > 0% (>0%)
                     ments: 1%
                      (1%)

                                                           Investment
                                                         finance: 99%                                                                   < 60%: 96% (96%)
                                                              (99%)

      1) Incl. Student housing (UK & Australia only)
      2) Performing CREF-portfolio only, LTV / YoD pre Covid-19, exposure as at 31.03.2020

12
Commercial real estate finance portfolio (CREF)
LTV levelling out due to active portfolio management and succ. de-risking

                                             Total commercial real estate finance portfolio (€ mn)
7.000     6.646
6.000
5.000
                     3.946
4.000
                               2.910
3.000                                    2.374
                                                   1.908
2.000                                                        1.265     1.250     1.117                                                   856
1.000                                                                                       677   576   512   372   328   306    303
      0
            US        UK        DE        FR         IT        CA        ES        NL       SE    PL    FI    BE    AT    CH      MV    others

                                                                                 LTV1)
120%
                                                                                                                      Ø LTV: 57% (12/2019: 57%)
100%

 80%                                                                                              68%   68%
           61%        59%      53%        55%       57%       56%       55%        56%      55%               55%   55%                  56%
 60%
                                                                                                                          44%    47%
 40%

 20%

     0%
            US        UK        DE         FR        IT        CA        ES        NL       SE    PL    FI    BE    AT    CH      MV    others
     1) Performing CREF-portfolio only, LTV / YoD pre Covid-19, exposure as at 31.03.2020

13
Commercial real estate finance portfolio1) (CREF)
Conservative risk parameters

                  Total CREF exposure by LTV1)                                                                               Portfolio risk matrix
                                                                                                                                                       LTV
7.000 €
                                                                                       Exposure                 70% bis 75% 75% bis 80% 80% bis 85% 85% bis 90% 90% bis 95% 95% bis 100% über 100%
6.000 €                                                      Portfolio                                   100%          250                     132                       71

                                                            distribution                                  95%

                                                                                           Probability
5.000 €
                                                              with low                                    90%
4.000 €
                                                             variance                                     85%

3.000 €                                                                                                   80%
                                                                                                          75%
2.000 €
                                                                                                          70%
1.000 €                                                                                                   60%
                                                                                                          40%
     0€
              5%

            100%
            105%
            110%
          > 110%
             10%
             15%
             20%
             25%
             30%
             35%
             40%
             45%
             50%
             55%
             60%
             65%
             70%
             75%
             80%
             85%
             90%
             95%
                                                                                                          20%

                           Current Ø LTV               2007 / 2008
                               of 57%                  Ø LTV WFC

                               Density
 Current average LTV of 57%
 Layered LTVs:
                                                                                                         ▪ High portfolio concentration at 57% LTV
 ▪ > 70% LTV exposure: € 250 mn
                                                                                                         ▪ Fairly small tail risk
 ▪ > 80% LTV exposure: € 132 mn

 ▪ > 90% LTV exposure: € 71 mn

     1) Performing CREF-portfolio only, LTV / YoD pre Covid-19, exposure (excl. commitments) as at 31.03.2020

14
Defaulted exposure
Slightly increased NPL ratio driven by lower portfolio / one new NPL

             Development of defaulted exposure                                                  Defaulted exposure by country (€ mn)
€ mn                                                            % defaulted     (vs. 12/2019)
                                                                                                                    Others: 45 (45)
                                                                                                   Spain: 41 (41)
                                                               exposure ratio
                                                                                                USA: 59 (0)
2.500                                                                 9,0%
                                                                                     Poland: 64 (64)
                                              7,3%
                    6,9%       6,9%                                               France: 112 (111)
2.000
           5,9%
                                   6,3%
                  1.929                                                                                                               Italy: 631
         1.825                             1.873                         6,0%                                                            (642)
1.500                      1.721
                                   1.664                                                  UK: 176 (182)
                                                                  4,5%
                                                        4,2%

1.000                                                                             Slightly increased NPL ratio due to
                                                     1.085     1.128
                                                                         3,0%
                                                                                  ▪ Lower portfolio size

 500
                                                                                  ▪ A single new NPL in the US: The already finally
                                                                                    negotiated restructuring of a loan felt through
                                                                                    due the outbreak of Covid-19
     0                                                                   0,0%
         2015     2016     2017    2018     Q2       2019       Q1
                                           2019                2020

         Defaulted exposure / Total CREF portfolio
         Defaulted exposure

15
Accelerated de-risking
40% NPL reduction achieved in H2

                    Italian exposure, FY2018-2019                                         Accelerated de-risking
     € bn                                                                                 ▪ Program with focus on Italian portfolio, continued in Q4
 5                                                              Thereof
                                                                € 1.1 bn                    with Italian credit risk further down by approx. € 0.6 bn
              4.0         approx. -30%                                                      (thereof € 0.3 bn NPL, € 0.3 bn single borrower risk)
 4                                                           acc. de-risking

 3                                                  2.7                                   ▪ Total effect from accelerated de-risking of approx.
                                                                                            € 1.2 bn1) Italian credit risk in 2019
                                                               Public sector
 2
                                                               CREF non perf.             ▪ P&L burden 2019 of approx. € 50 mn
 1                                                             CREF performing              (€ ~15 mn in Q4)
 0                                                              Other assets
             31.12.2018                    31.12.2019

            Non performing loans, H1 2019 – H2 2019                                        NPL reduction
     € bn                                                    Thereof                       ▪ In H2 2019 total NPL volume down by approx. 40%
2            1.9        approx. -40%
                                                             € 0.3 bn
                                                          acc. de-risking
                                                                                           ▪ Italian NPL also down by approx. 40% in 2019
                                                                                             (incl. a foreclosed Italian asset of approx. € 90 mn
                                                1.1                                          taken on own book for future development,
1                                                                                            not part of acc. de-risking)

                                                               Italy
                                                                Other countries
0
            30.06.2019                  31.12.2019

     1) thereof € 350 mn NPL (in FY 2019, of which € 310 mn in H2 2019), € 350 mn single borrower risk,
        € 410 mn BTPs, € 80 mn NPL provisioned for future reduction

16
     Note: All 2019 figures preliminary and unaudited
Spotlight: Italian CREF portfolio (€ 1.9 bn)
Successful de-risking led to substantial improvements

                    Italian Portfolio by property type                                                 Italian Portfolio by LTV ranges1)
(vs. 12/2019)                                                  Volume: € 1.9 bn        (vs. 12/2019)   60-80%: 3%              > 80%: > 0%   Ø LTV: 57%
                                                                                                           (3%)                   (>0%)
                Others: 17%
                   (16%)
                                                             Retail: 34%
                                                                (35%)
           Hotel: 3%
             (3%)

          Logistics: 19%
              (19%)
                                                                                                                                   < 60%: 97%
                                                   Office: 27%                                                                        (97%)
                                                      (27%)

                 Average LTV / YoD by property type 1)                                                              Comments
100% Ø LTV: 57%                                                Ø YoD: 8.2%16%
                                                                                         ▪ Stable portfolio size after successful de-risking in 2019
                                                    13,7%
                                                                   78%                   ▪ LTV: € 45 mn > 70% / € 9 mn > 80% / € 4 mn > 90%
 75%                                                                           12%
                               59%      59%                                              ▪ Defaulted exposure: € 631 mn
                53%
                                                     48%
 50%                                                              9,3%         8%
                9,2%
                                        6,7%
 25%                       6,3%                                                4%

   0%                                                                          0%
            Retail            Office   Logistics     Hotel       Others
      1) Performing CREF-portfolio only, LTV / YoD pre Covid-19, exposure as at 31.03.2020

17
Spotlight: CREF-Hotel Portfolio (€ 8.5 bn)

                       Hotel Portfolio by region                                                        Hotel Portfolio by LTV ranges1)
(vs. 12/2019)                                       Asia / Pacific:                    (vs. 12/2019)   60-80%: 3%              > 80%: > 0%
                                                    3% (3%)                                                (2%)                   ( 70% / € 18 mn > 80% / € 9 mn > 90%
                                                                                         ▪ Defaulted exposure: € 178 mn
      1) Performing CREF-portfolio only, LTV / YoD pre Covid-19, exposure as at 31.03.2020

18
Spotlight: CREF-Retail Portfolio (€ 6.0 bn)

                       Retail Portfolio by region                                                        Retail Portfolio by LTV ranges1)
(vs. 12/2019)                                        Asia / Pacific:                    (vs. 12/2019)   60-80%: 5%              > 80%: 1%
            North America:                           2% (2%)                                                (5%)                   (1%)     Ø LTV: 59%
            18% (17%)

     Europe East:                                             Europe West:
     5% (5%)                                                  29% (30%)

     Europe North:
     9% (9%)

                Germany:                                  Europe South:                                                             < 60%: 94%
                13% (13%)                                 24% (24%)                                                                    (94%)

                               Yield on debt1)                                                                       Comments
15% Ø YoD: 9.5%                                                                           ▪ Retail portfolio represents 24% of total CREF-portfolio
          9,9%                                                   10,4%     10,5%          ▪ ~80% of retail portfolio located in Europe
10%                  9,6%       8,2%       8,7%       8,8%
                                                                                          ▪ Largest portfolio share in UK (~€ 1.3 bn), US (~€ 1.1 bn),
                                                                                            DE and ES (~€ 0.8 bn each) and IT (~€ 0.7 bn), with
  5%
                                                                                            substantial state support programs for tenants in place
  0%                                                                                      ▪ Ø YoD (9.5%) above Ø YoD of total portfolio (8.9%)
                                                                                          ▪ Investment finance only, no developments
                                                                                          ▪ LTV: € 188 mn > 70% / € 106 mn > 80% / € 62 mn > 90%
                                                                                          ▪ Defaulted exposure: € 387 mn

       1) Performing CREF-portfolio only, LTV / YoD pre Covid-19, exposure as at 31.03.2020

19
Segments

20
Structure Property Financing
Strong new business origination with margins above plan

                New business origination by quarter1)                                      ▪ New business origination significantly above Q1 2019
         € mn                                                                              ▪ Newly acquired business margins of ~200 bp
2.000
                                                                                             (~185 bp after FX)
                                                             1,333
1.500                                                                                      ▪ Portfolio at lower end of target size of € 26-28 bn due to
                                                               243                           ▫ Significant parts of Q1 new business origination
                             812
1.000                                                                                           paid out in April
                             323                                                             ▫ Syndication activities (€ 0.3 bn)
  500                                                         1.090
                                                                                           ▪ Confirming portfolio within target range by year-end
                             489
     0                                                                                1)
                       Q1 2019                              Q1 2020
                     Newly acquired business                  Renewals

         Q1-new business by region1)                       Q1-new business by property type 1)                         REF portfolio development
(vs. 12/2019)      Asia /                                 (vs. 12/2019)                                             € bn
                 Pacific: 6% (5%)    Germany:                             Residential: 7% (3%)                 35
                                     18% (11%)
                                                              Retail: 8%                                       30
                                                                                                 Office: 37%
                                                                (13%)                               (50%)      25
      North                                     Europe    Logistic: 15%                                        20
     America:                                   North:       (10%)
       33%                                      16%(2%)                                                        15      29,6
      (39%)                                                                                                                    26,4     27,4     26,7     26,1
                                                                                                               10
              Europe                      Europe East:                                                         5
             South: 4%                    15% (7%)
               (8%)      Europe                                                  Hotel: 33%                    0
                         West: 8% (32%)                                            (24%)
                                                                                                                      12/'16   12/'17   12/'18   12/'19   03/'20
         1) Incl. renewals

21
Consulting/Services Bank
Significantly better results due to new modelling of deposits
Additionally improved earnings statement via adjusted transfer pricing
                        Split of deposits by type                          ▪ Stable deposit volume (vs. YE), quality further improved
              2015                                Q1 2020                  ▪ Net interest income increased to € 10 mn in Q1 ‘20
             7% 13%                                1%                        (Q1 ’19: € -3 mn)
                                                          18%
                                                                             ▫ Adjusted modelling:
                                                                               Increase modelled volumes and maturities
                          20%                    € 10.5 bn
             € 9.0 bn                                                          of optimised deposit base structure
                                                                19%
                                                                               (bottom line NII improvement)
                                          62%
       60%                                                                   ▫ Transfer price:
                                                                               Adjustment of liquidity prices from secured to
        Rental deposits                     Maintenance reserve                unsecured spreads acc. to nature of deposits
        Sight deposits                      Other term deposits                reflecting Aareal’s current funding mix
                                                                               (allocation of NII)
                                                                           ▪ Net commission income improved yoy
                                 Q1 ‘19 Q2 ’19 Q3 ’19 Q4 ’19 Q1 ‘20
€ mn                                                                       ▪ Confirming NCI guidance: +15% yoy

Net interest income                  -3     -3       -4       -5      10

Net commission income                4      6         7         6     5

Admin expenses                      18      19       20      16       18

Net other operating income           0      -1        0         1     0

Operating profit                    -17    -17      -17      -14      -3

22
Aareon
Increased sales revenue and EBITDA

€ mn                                   Q1 ‘19 Q2 ’19 Q3 ’19 Q4 ’19 Q1 ‘20       ▪ Aareon sales revenue increased by € 5 mn to € 64 mn
                                                                                  in Q1 ’20 (Q1 ’19: € 59 mn) translating to 8% qoq
Sales revenues                             59           63    60    70    64
 ▪ Thereof ERP revenue                      47          51    48    55    49
                                                                                  increase in Adj. EBITDA (excl. one-offs and strategic
 ▪ Thereof Digital revenue                  12          12    12    16    15      investments)
Costs 1                                   -45       -48       -47   -50   -50   ▪ Costs in Q1 ‘20 increased to € 50 mn (Q1 ’19: € 45 mn)
 ▪ Thereof material costs                  -10          -11   -11   -12   -11
                                                                                  as expected, mainly driven by higher number of FTEs
EBITDA                                     14           15    13    20    14
                                                                                ▪ Strategic investments supporting Aareon’s growth
One-offs                                     0           0     0     0     0      strategy rose by € 1 mn qoq on the backdrop of
                                                                                  ramp-up of Strategic Initiatives
Strategic investments                        0           0     -1    -2    -1
                                                                                ▪ Strong Consulting revenue in Q1 ’20: € 17.4 mn
Adj. EBITDA                                14           15    14    22    15      (+10% qoq), but some projects expected to either
                                                                                  be delayed or be cancelled over the course of the year
EBITDA                                     14           15    13    20    14
                                                                                ▪ Under current circumstances, Aareon sees this crisis
D&A / Financial result                      -6          -6     -6    -6    -7     from a business point of view as a singular event
                                                                                  and expects an adjusted EBITDA effect in FY 2020
EBT / Operating profit                       8           9     7    13     7
                                                                                  of ~ € -10 mn
                                                                                ▪ Crisis as a catalyst for digitization potentially leading
                                                                                  to additional future business opportunities for Aareon
                                                                                ▪ Mid term 2025 targets and commitments remain in
                                                                                  place. Hence it is rather a shift down the road than
                                                                                  a losing revenue for good

       1) Incl. capitalised software and other income

23
Group results Q1 2020

24
Q1 results 2020
Positive despite Covid-19 impact and FY-banking levy

€ mn                             Q1 ‘19   Q2 ’19   Q3 ’19   Q4 ’19   Q1 ‘20   Q1 2020-Comments
                                                                              Reflecting lower portfolio size in Q1 due to
Net interest income                135      134      134      130      123
                                                                              successful de-risking in 2019
                                                                              Normalised multi-year average after adjustments
Derecognition result                16       11       15       22        7
                                                                              of TR-portfolio
                                                                              Covid-19 triggered a single new NPL as well as
Loss allowance                        5      23       27       35       58    model parameter adjustments due to increased
                                                                              economic uncertainties
Net commission income               53       57       54       65       57    Continuously significant above previous year’s levels
                                                                              e.g. effects from syndication and valuation of
FV- / hedge-result                    6       -7        2       -4      11
                                                                              derivatives
Admin expenses                     144      112      114      118      129    Lower costs, Q1 incl. FY banking levy

Others                                0       1         0       2        0
                                                                              Positive despite Covid-19 impact and
Operating profit (EBT)               61      61        64      62       11
                                                                              FY-banking levy
Income taxes                         21      20        24      20        4
Minorities / AT1                      5       4         5       4        5
Consolidated net income                                                       Positive despite Covid-19 impact and
                                     35      37        35      38        2
allocated to ord. shareholders                                                FY-banking levy
Earnings per share (€)             0.59    0.61      0.60    0.62     0.04

25
Net interest income (NII)
Reflecting lower portfolio size in Q1 due to successful de-risking in 2019

         € mn
150                                                           ▪ Successful de-risking in 2019 led to a lower
                                                                CREF- and TR portfolio
                                                              ▪ Syndication activities in Q1 continued
125
                                                              ▪ Confirming portfolio within target range of € 26-28 bn
                                                                by year end
100
                                                              ▪ NII expected to stabilise slightly above current level
                                                                throughout 2020

 75
                135    134       134        130      123

 50

 25

     0
           Q1 2019    Q2 2019   Q3 2019   Q4 2019   Q1 2020

26
Loss allowance (LLP)
Covid-19 triggered a single new NPL as well as model parameter
adjustments due to increased economic uncertainties

     € mn
75                                                           LLP as a combination of
                                                             ▪ € 8 mn normalised provisioning

                                                     58      ▪ € 50 mn Covid-19 related impact
                                                               ▫ € 17 mn model parameter adjustments
                                                                 (due to increased economic uncertainties)
50
                                                               ▫ € 33 mn new US-NPL:
                                                                 The already final negotiated restructuring of a
                                                                 loan fell through due the outbreak of Covid-19

                                                     50

25

                                           35
                                 27
                    23

        5                                            8
 0
      Q1 2019     Q2 2019      Q3 2019   Q4 2019   Q1 2020

     Covid-19 related impact
     Normalised provisioning

27
Net commission income
Continuously significant above previous year’s levels

80
     NCI (€ mn)                                           ▪ Further increase by 8% yoy driven by Aareon
                                                            ▫ Aareon’s positive development is driven by planned
70                                                            organic growth and contribution of CalCon
                                                            ▫ Digital +30% qoq
60                                                        ▪ C/S Bank increased contribution of € 5 mn
                                                            in line with planned increase of 15% yoy
50                                      65                ▪ CREF-contribution of € 2 mn

40
                    57                            57
         53                   54
30

20

10

 0
      Q1 2019     Q2 2019   Q3 2019   Q4 2019   Q1 2020

28
Admin expenses
Lower costs, Q1 incl. FY banking levy

175 € mn                                                   ▪ Q1 admin expenses incl.
                                                             ▫ € 18 mn for FY-European bank levy and ESF
150                                                          ▫ € 3 mn transformation costs
                                                             ▫ € 10 mn Covid-19 related underspend cost savings
125
                                                           ▪ Additional € 5 mn (vs. Q1 2019) from Aareon growth
                                                             (organic and M&A activities)
100

 75
           144
                                                  129
                    112       114       118
 50

 25

     0
         Q1 2019   Q2 2019   Q3 2019   Q4 2019   Q1 2020

29
Capital, B/S, Funding/Liquidity

30
Capital
Solid capital ratios

                                                                                          ▪ Solid capital ratios further increased
                                 B3 / B41) RWA
      € bn                                                                                ▪ Capital2): + Dividend3)
 20
                      Basel 3                               Basel 4                                    - Covid-19 related dilution of OCI-bonds
                                                                                                       - Prudential provisioning
 15                                                  16,4               16,3              ▪ RWA:           - Lower portfolio volume
                                                                                                           + Covid-related default
 10                                                                                                        + Revaluation effects
               11,2              11,5                                                                      + Incorporation of collaterals from new loans
                                                                                                             after reporting date (only B3)
 5
                                                                                          ▪ T1-Leverage ratio: 6.6%
 0                                                                                        ▪ Remaining regulatory uncertainties (models, ICAAP,
             31.12.2019       31.03.2020         31.12.2019          31.03.2020             ILAAP, B4 etc.): modelled RWA’s may further inflate

                                 B3 capital ratio                                                                       B4 CET 1 ratio1)
35%                                                                                     15%
                       29.9%                                 30.3%
30%
25%                       7,6%                                7,5%
                                                              2,6%                      10%
20%                       2,7%
15%                                                                                                            13,5%                         14,2%
10%                    19,6%                                 20,2%                        5%
 5%
 0%                                                                                       0%
                   31.12.2019                             31.03.2020                                        31.12.2019                     31.03.2020
                CET 1       AT1             T2
       1) Underlying RWA estimate, given a 72.5 % output floor based on the final Basel Committee framework dated 7 December 2017,
          calculation subject to outstanding EU implementation as well as the implementation of further regulatory requirements
       2) When calculating own funds as at 31.03.2020, interim profits were taken into account, deducting the pro -rata dividend
31        in line with the dividend policy, and incorporating the pro -rata accrual of net interest payable on the AT1 bond.
       3) Dividend 2019: subject to AGM decision
SREP (CET 1) requirements
Demonstrating conservative and sustainable business model

      B3 CET1 ratio vs. SREP (CET1) requirements         ▪ B3 CET1 buffer translates into > € 1.3 bn
25%                                                      ▪ P2R relief by using possibility of partially fulfilling
                                                           requirements with AT1 and T2 capital
          20.2%                                          ▪ Total capital requirement 2020 (Overall Capital
                                                           Requirement (OCR) amounts to 12.8%
20%
                                                         ▪ Corresponding total capital ratio amounts to 30.3%
                                                           (31.3.2020)
                                          >> x2          ▪ All ratios already include TRIM effects as well as
15%                                                        prudential provisioning

                         9.26%
10%                      0.01%
                                          8.28%
                                          0.01%
                         2,50%
                                          2,50%
                         2,25%
 5%                                       1,27%
                                                            Countercyclical Buffer
                         4,50%            4,50%             Capital Conservation Buffer
                                                            Pillar 2 Requirement
 0%                                                         Pillar 1 Requirement
        31.3.2020       SREP 2020       SREP 2020
       B3 CET1 ratio                  incl. P2R relief

32
B/S structure according to IFRS
As at 31.03.2020: € 41.0 bn (31.12.2019: € 41.1 bn)

     € bn                                                                                     ▪ Well balanced B/S structure
45
                                                                                              ▪ Comfortable money market liquidity buffer
40        2.6 (2.8) Money Market                                                                after successful de-risking in 2019
                                                  3.8 (3.6) Money Market
          9.0 (8.8)                               9.5 (9.7)
35        Treasury portfolio                      Deposits from housing
                                                  industry clients
30          of which cover pools
          25.3 (25.9)
          Commercial real estate                  24.4 (24.8)
25        finance portfolio1)                     Long-term funds
                                                  and equity
                                                  of w hich
20                                                ▪ 20.5 (20.9)
                                                    Long-term funds
                                                    − 13.1 (13.4) PB
15                                                  − 7.4 ( 7.5) SU
                                                  ▪ 1.3 (1.3)
                                                    Subordinated capital
10                                                ▪ 2.6 (2.6)
                                                    Shareholders’ equity

 5
          4.1 (3.6) Other assets2)                3.0 (2.7) Other liabilities
 0
                    Assets                            Liabilities & equity

     1) CREF-portfolio only, private client business (€ 0.4 bn) and WIB’s public sector loans (€ 0.3 bn) not included
     2) Other assets includes € 0.4 bn private client portfolio and WIB’s € 0.3 bn public sector loans

33
Funding / Liquidity
Diversified funding sources and distribution channels

     €
                                                                          ▪ Sustainable and strong housing industry deposit base:
                                                                            ▫ Stays at a high level and counts for more than 30%
                                                                               of well diversified funding mix
                                                                            ▫ Demonstrates the expected high resistance at the
                                                                               top of the Covid-19 crisis and low volatility of the
                                                                               volume
                                                                            ▫ Becomes an even more attractive funding instrument
                                                                               due to overall wider credit spreads for capital
                                                                               markets instruments
                                                                          ▪ 04/’20: Successful issuance of EUR 100 Mio. senior
                                                                            preferred notes at attractive funding spreads
                                                                            (3Y, MS +95) even in a very volatile and challenging
                                                                            market environment
                                                                          ▪ High Liquidity position additionally supported by
                                                                            successful de-risking in 2019
                                                                          ▪ Liquidity ratios significantly over fulfilled:
                                                                            ▫ NSFR > 100%
 Deposits:
 Housing industry customers
                              Deposits:
                              Inst. customers
                                                Senior
                                                unsecured
                                                            Pfandbriefe     ▫ LCR >> 100%
                                     2)
           3.4 (4.1) Other assets

34
Mortgage Cover Pool
Well diversified regarding Geography and Property Type
– Cover pool of € 11.9 bn including € 1.3 bn substitute assets diversified over 18 countries
– High quality of assets: first-class mortgage loans (mortgage-lending-value 55.9%)
– Mortgage-lending-value with high discount from market-value
– Ø LTV of the mortgage cover pool 33.5%
– Moody´s has calculated a 'Aaa' supporting over-collateralisation ratio of 10.5% 1) on a PV basis
– Over-collateralisation on a PV basis as of 31.03.2020: 13.6%
– High diversification within property types

                           Cover Pool by Geography                                                  Cover Pool by Property Typ
                                   Asia/ Pacific
                                       0%          Germany                                           Residential    Other
                                                     17%                                               property      1%
           North America
                                                                                                          9%
                27%                                                                            Logistic
                                                                                                 6%
                                                                                                                                 Office properties
                                                                                                                                        32%

     Eastern Europe                                                                        Hotel
           2%                                                                              21%

       Southern Europe                                  Western Europe
            12%                                           (excluding
                                                          Germany)                                                          Retail properties
                Northern Europe                              36%                                                                   31%
                      6%
35
                                                                  As of March 31st, 2020
Funding
Favourable market environment used for strong funding activities

                                                Capital markets refinancing activities 2019

                                     0.125% EUR 250.000.000
      0.125% EUR 750.000.000         Auf stockung auf € 750 Mio.   2.625% USD 600.000.000      0.375% EUR 500.000.000      0.01% EUR 500.000.000
         Hy pothekenpfandbrief          Hy pothekenpfandbrief         Hy pothekenpfandbrief         Senior Pref erred        Hy pothekenpfandbrief

               5 Y ears                        4 Y ears                     2 Y ears                   5 Y ears                    8 Y ears
         Maturity 01.02.2024             Maturity 01.02.2023          Maturity 15.07.2021         Maturity 10.04.2024        Maturity 08.07.2027
        ISIN: DE000AAR0249              ISIN: DE000AAR0231           ISIN: XS1983343838         ISIN: DE000A2E4CQ2          ISIN: DE000AAR0256

           Lead Manager                     Lead Manager                  Lead Manager             Lead Manager                 Lead Manager
      Commerzbank, Deka Bank,       Bay ernLB, Commerzbank, Deka   Citigroup, Goldman Sachs,   Commerzbank, Deka Bank,    Deka Bank, DZ Bank, HSBC,
      DZ Bank, Natixis, UniCredit    Bank, DZ Bank, HSBC, LBBW      HSBC, NatWest Markets         DZ Bank, Nomura             NordLB, UniCredit

            January 2019                    March 2019h                   April 2019                  April 2019                  June 2019

                                                Capital markets refinancing activities 2018

               0.125%                         1.500%                        0.125%                     0.375%                      0.375%
         EUR 500.000.000                 GBP 250.000.000              EUR 500.000.000             EUR 500.000.000             EUR 500.000.000
        Hy pothekenpfandbrief           Hy pothekenpfandbrief        Hy pothekenpfandbrief       Hy pothekenpfandbrief       Hy pothekenpfandbrief

               4 Y ears                        4 Y ears                     5 Y ears                    7 Y ears                   6 Y ears
         Maturity 01.02.2023             Maturity 16.06.2022          Maturity 31.07.2023         Maturity 15.07.2025        Maturity 30.07.2024
        ISIN: DE000AAR0231              ISIN: XS1883300292           ISIN: DE000AAR0223          ISIN: DE000AAR0215         ISIN: DE000AAR0207

            Lead Manager                   Lead Manager                 Lead Manager                Lead Manager                Lead Manager
     Bay ernLB, Commerzbank, DZ        Goldman Sachs, HSBC,        DekaBank, Deutsche Bank,    DZ Bank, LBBW, Natixis,    Bay ernLB, BNP, DekaBank,
       Bank, HSBC, UniCredit                 Nomura                  GS, HSBC, UniCredit       NordLB, Societe Generale    Commerzbank, UniCredit

           Nov ember 2018                 September 2018                September 2018               August 2018                 March 2018

36
Treasury portfolio
€ 7.5 bn (2019: € 7.3 bn) of high quality and highly liquid assets

                                by asset class                                                              by rating1)

(vs. 12/2019)                                                                (vs. 12/2019)                                 < BBB / no
                                                                                                 BBB: 13%
                                                           Covered Bonds /                                                rating: > 0%
                                                                                                  (14%)
                                                            Financials: 2%                                                     (>0%)
                                                                 (3%)
                                                                                             A: 8%
                                                                                             (8%)
                                                                                                                                    AAA: 38%
                                                                                                                                     (38%)

        Public Sector
        Debtors: 98%
           (97%)                                                                                 AA: 41%
                                                                                                  (40%)

                                                                                             Rating mix again slightly improved:
                                                                                             Share of BBB at only 13%

      As at 31.03.2020 – all figures are nominal amounts
      1) Composite Rating

37
Outlook 2020

38
Outlook 2020

 We had qualified our annual forecast published in the 2019 Annual Report, noting that the impact of the COVID-19
 pandemic cannot be reliably estimated and that it is thus impossible to anticipate the consequences for business and
 earnings development.

 In the remaining course of the year and in addition to our strategic initiatives as part of “Aareal Next Level” we focus to
 overcome the challenges and impacts from the Covid-19 pandemic together with our clients.

 Crucial Question:                           When will the economic recovery kick-in? With what momentum?

 Our assumption:                             We assume a continuous normalisation of the global economy from mid 2020
                                             onwards followed by a significant recovery (“Swoosh” shaped) in 2021.

 Our Outlook:                                Based on this assumption and from today’s point of view, we consider
                                             a substantially positive operating profit to be within reach.

 In the current environment this outlook is naturally characterized by a high degree of uncertainty – especially regarding the duration and the
 intensity of the crisis, the speed of the recovery and their subsequent consequences for our clients as well as regulatory and accounting
 uncertainties and the possibility of not reliably foreseeable defaults of single loans.

39
Key Takeaways

40
Key takeaways

                A good
                starting point   Facing the Covid-19 crisis from a position of strength, with extremely
                                 solid capital ratios, sound portfolio and comfortable liquidity position

                Solid
                performance      Positive Q1 results despite Covid-19 impacts and FY-banking levy

                Manageable       From today‘s point of view Covid-19 risks manageable – even under
 Key Takeaway   risks            adverse assumptions

                Realistic        From today’s point of view, we consider a substantially positive operating
                guidance         profit to be within reach (see page 36)

                Compelling       Pursuing the strategic priorities of "Aareal Next Level",
                strategy         with a focus on further growth acceleration at Aareon

41
Group Results

42
Aareal Bank Group
Results Q1 2020

                                                                                                                          01.01.-                  01.01.-
                                                                                                                                                             Change
                                                                                                                      31.03.2020               31.03.2019
                                                                                                                       € mn                    € mn
Profit and loss account
Net interes t incom e                                                                                                           123                   135             -9%
Los s allowance                                                                                                                  58                     5
Net com m is s ion incom e                                                                                                       57                    53             8%
Net derecognition gain or los s                                                                                                    7                   16         -56%
Net gain or los s from financial ins trum ents (fvpl)                                                                            10                     6             67%
Net gain or los s on hedge accounting                                                                                              1                    0
Net gain or los s from inves tm ents accounted for us ing the equity m ethod                                                       0                    0
Adm inis trative expens es                                                                                                      129                   144         -10%
Net other operating incom e / expens es                                                                                            0                    0
Operating Profit                                                                                                                 11                    61         -82%
Incom e taxes                                                                                                                      4                   21         -81%
Consolidated net income                                                                                                            7                   40         -83%
Cons olidated net incom e attributable to non-controlling interes ts                                                               1                    1
Cons olidated net incom e attributable to s hareholders of Aareal Bank AG                                                          6                   39         -85%

Earnings per share (EpS)
                                                                                        1)
Cons olidated net incom e attributable to s hareholders of Aareal Bank AG                                                          6                   39         -85%
 of which: allocated to ordinary s hareholders                                                                                     2                   35         -94%
 of which: allocated to AT1 inves tors                                                                                             4                    4
                                        2)
Earnings per ordinary s hare (in €)                                                                                            0.04                  0.59         -93%
                                             3)
Earnings per ordinary AT1 unit (in €)                                                                                          0.04                  0.04

     1) The allocation of earnings is based on the assumption that net interest payable on the AT1 bond is recognised on an accrual b asis.
     2) Earnings per ordinary share are determined by dividing the earnings allocated to ordinary shareholders of Aareal Bank AG by t he
        weighted average of ordinary shares outstanding during the financial year (59,857,221 shares). Basic earnings per ordinary sh are
        correspond to diluted earnings per ordinary share.
     3) Earnings per AT1 unit (based on 100,000,000 AT1 units with a notional amount of 3 € each) are determined by dividing the earn ings
        allocated to AT1 investors by the weighted average of AT1 units outstanding during the financial year. Earnings per AT1 unit (basic)
        correspond to (diluted) earnings per AT1 unit.
43
Aareal Bank Group
Results Q1 2020 by segments

                                                                                       A
                                                       Structured
                                                                          Consulting / a                 Consolidation/    Aareal Bank
                                                        Property                            Aareon
                                                                        Services Bank r                  Reconciliation       Group
                                                       Financing
                                                                                       e
                                                     01.01.- 01.01-     01.01.- 01.01- 01.01.- 01.01-    01.01.- 01.01-   01.01.- 01.01-
                                                     31.03. 31.03.      31.03. 31.03.    31.03. 31.03.   31.03. 31.03.    31.03. 31.03.
                                                      2020    2019       2020    2019    2020   2019      2020    2019     2020    2019
€ mn
Net interest income                                     113    138          10      -3       0       0        0       0      123    135
Loss allowance                                           58      5                           0       0                        58      5
Net commission income                                     2      2           5       4      53      49       -3      -2       57     53
Net derecognition gain or loss                            7     16                                                             7     16
Net gain or loss from financial instruments (fvpl)       10      6                           0                                10      6
Net gain or loss on hedge accounting                      1      0                                                             1      0
Net gain or loss from investments
                                                                                             0       0                         0         0
accounted for using the equity method
Administrative expenses                                  68      87         18      18      46      41       -3      -2      129    144
Net other operating income / expenses                     0       0          0       0       0       0        0       0        0      0
Operating profit                                          7      70         -3     -17       7       8        0       0       11     61
Income taxes                                              3      24         -1      -5       2       2                         4     21
Consolidated net income                                   4      46         -2     -12       5       6        0       0        7     40
Allocation of results
Cons. net income attributable to non-controlling
                                                          0         0        0       0       1       1                         1         1
interests
Cons. net income attributable to shareholders of
                                                          4      46         -2     -12       4       5        0       0        6      39
Aareal Bank AG

44
Aareal Bank Group
Results – quarter by quarter

                              Structured Property          Consulting / Services                                             Consolidation /
                                                                                                   Aareon                                                  Aareal Bank Group
                                   Financing                       Bank                                                      Reconciliation
                            Q1    Q4    Q3 Q2       Q1    Q1    Q4    Q3 Q2       Q1    Q1    Q4    Q3 Q2        Q1    Q1    Q4     Q3 Q2      Q1    Q1     Q4     Q3      Q2    Q1
                            '20          2019             '20          2019             '20          2019              '20           2019            '20                2019
€ mn
Net interest income         113   135   138   138   138    10    -5    -4    -3    -3     0    0       0    -1    0      0      0    0     0    0    123     130   134    134    135
Loss allow ance              58    35   27    23     5           0                        0    0       0    0     0                                   58      35    27     23         5
Net commission income         2    4     2     2     2      5    6     7     6     4     53    58     49    52    49    -3     -3    -4   -3    -2    57      65    54     57     53
Net derecognition
                              7    22   15    11     16                                                                                                7      22    15     11     16
gain or loss
Net gain / loss from fin.
                             10    -4    5     -6    6                                    0    0                                                      10      -4    5       -6        6
instruments (fvpl)
Net gain or loss on
                              1    0     -3    -1    0                                                                                                 1       0    -3      -1        0
hedge accounting
Net gain / loss from
investments acc. for               1                                                      0    0       0          0                                    0       1    0                 0
using the equity method
Administrative
                             68    59   55    53     87    18    16   20    19     18    46    46     43    43    41    -3     -3    -4   -3    -2   129     118   114    112    144
expenses
Net other operating
                              0    -1    -1    1     0      0    1     0     -1    0      0    1       1    1     0      0      0    0     0    0      0       1    0       1         0
income / expenses
Operating profit              7    63   74    69     70    -3   -14   -17   -17   -17     7    13      7    9     8      0      0    0     0    0     11      62    64     61     61
Income taxes                  3    21   27    23     24    -1    -4    -6    -6    -5     2    3       3    3     2                                    4      20    24     20     21
Consolidated net
                              4    42   47    46     46    -2   -10   -11   -11   -12     5    10      4    6     6      0      0    0     0    0      7      42    40     41     40
incom e
Cons. net income
attributable to non-          0    0     0     0     0      0    0     0     0     0      1    0       1    0     1                                    1       0    1       0         1
controlling interests
Cons. net income
attributable to ARL           4    42   47    46     46    -2   -10   -11   -11   -12     4    10      3    6     5      0      0    0     0    0      6      42    39     41     39
shareholders

45
Commercial Real Estate Finance Portfolio

46
Development commercial real estate finance portfolio
By region

          € mn
100%              492                      246     420      648      Asia / Pacific
                          1.528    1.073
                  277
                           579             3.779
 90%                               2.789
                 2.951    2.532                                      North
                                                   7.429
                                                            7.911    America
 80%                      1.791    2.939   2.790

 70%
                          4.671            2.354   1.286
                                   2.872                     949     Europe East
                                                   1.566
 60%                                                        1.248    Europe North
                                           4.180                     Europe
 50%                                               3.945    3.158    South
                                   4.070

 40%             15.783

 30%                               4.913   7.453                     Europe
                          15.193                   8.599    8.524    West
 20%

 10%                               4.804
                                           3.905
                                                   3.152    2.910    Germany
     0%
                 1998     2003     2008    2013    2018    Q1 2020

47
Development commercial real estate finance portfolio
By property type

          € mn
100%                                       528      630      549     others
                          2.249    1.592
                 2.068                             1.956    1.868    Logistic
                                           2.584
 90%                      1.032    2.147
                  892
 80%             1.764    2.987
                                   3.671   5.327   8.032             Hotel
                                                            8.548
 70%                      2.562
                 4.103
 60%
                                   4.796
                          6.212            6.385
 50%
                                                   6.612
                                                            6.041    Retail
 40%

 30%                               7.718
                 10.681
                                           7.762
 20%                      11.252                   7.374
                                                            7.205    Office

 10%
                                   3.538
                                           2.121   1.792             Residential
                                                            1.137
     0%
                 1998     2003     2008    2013    2018    Q1 2020

48
Western Europe (ex Germany) CREF portfolio
Total volume outstanding as at 31.03.2020: € 8.5 bn

                             by product type                                                                         by property type
               Others: >1%                                                                         Residential: 1)                  Others:   1%
                                                                                                      3%

                                                                                              Logistic: 6%

                                                                                            Retail: 21%                                       Hotel: 45%

                                                            Investment
                                                          finance: 99%
                                                                                                   Office: 24%

                             by performance                                                                          by LTV ranges2
                     NPLs                                                                        60-80%: 2%                           >80%: 1%
                      3%

                                                         Performing                                                                      < 60%: 97%
                                                            97%

     1) Incl. Student housing (UK & Australia only)
     2) Performing CREF-portfolio only, LTV / YoD pre Covid-19, exposure as at 31.03.2020

49
Spotlight: UK CREF portfolio
€ 3.9 bn (~16% of total CREF-portfolio)

                   Total portfolio by property type                                                   Average LTV by property type 1)
(vs. 12/2019)                                        Student housing: 6%                                                                  Ø LTV: 59%
        Office: 8% (8%)
                                                                                        100%
                                                              (4%)
                                                                                         80%                68%
                                                                                                  54%                  55%       57%         59%
        Logistic: 8%                                                                     60%
            (8%)
                                                                Hotel: 46%
                                                                  (47%)                  40%

                                                                                         20%

                                                                                             0%
                Retail: 32%                                                                       Hotel     Retail    Logistic   Office     Student
                  (33%)
                                                                                                                                            housing

                                Yield on debt1)                                                            Comments (vs. 2019)
11,0%                                                                                    ▪ Performing:
10,5%                                                                                      ▫ Investment finance only, no developments
         10,0%                                9,9%
10,0%                            9,6%                      9,7%                            ▫ ~ 60% of total portfolio in Greater London area,
                                                                             9,5%            emphasising on hotels
 9,5%                    9,9%           9,9%
                9,7%                                                  9,6%
                                                                                           ▫ € 177 mn with LTV > 60%
 9,0%                                                      9,3%                          ▪ Defaulted exposure: € 176 mn (€ 182 mn)
 8,5%
 8,0%
           2011 2012 2013 2014 2015 2016 2017 2018 2019 Q1
                                                        '20
      1) Performing CREF-portfolio only, LTV / YoD pre Covid-19, exposure as at 31.03.2020

50
Southern Europe CREF portfolio
Total volume outstanding as at 31.03.2020: € 3.2 bn

                             by product type                                                                    by property type
                 Develop-                        Others: >1%                                                                Others: 8%
                                                                                              Residential: 2%
                ments: 7%

                                                                                             Hotel: 7%

                                                                                            Logistic: 16%
                                                                                                                                           Retail: 46%
                                                          Investment
                                                        finance: 92%
                                                                                                Office: 21%

                             by performance                                                                     by LTV ranges1
                                                                                                     60-80%: 3%                  > 80%: 1%
                NPLs
                21%

                                                           Performing
                                                              79%                                                                  < 60%: 96%

     1) Performing CREF-portfolio only, LTV / YoD pre Covid-19, exposure as at 31.03.2020

51
German CREF portfolio
Total volume outstanding as at 31.03.2020: € 2.9 bn

                             by product type                                                                    by property type
                Others: 1%                                                                                   Others: 2%
                                                                                                 Logistic: 13%
                                                                                                                                        Retail: 28%

                                                                                            Residential:
                                                                                               17%

                                                            Investment
                                                          finance: 99%                                                                 Hotel: 23%
                                                                                            Office: 17%

                             by performance                                                                     by LTV ranges1
                     NPLs                                                                                  60-80%: 2%              > 80%: > 0%
                      1%

                                                       Performing                                                                     < 60%: 98%
                                                          99%

     1) Performing CREF-portfolio only, LTV / YoD pre Covid-19, exposure as at 31.03.2020

52
Northern Europe CREF portfolio
Total volume outstanding as at 31.03.2020: € 1.2 bn

                             by product type                                                                  by property type
               Others: 2%                                                                                                           Hotel: 7%

                                                                                            Office: 22%

                                                                                                                                           Retail: 45%

                                                            Investment
                                                          finance: 98%
                                                                                                  Logistic: 26%

                             by performance                                                                       by LTV ranges1
                     NPLs                                                                           60-80%: 4%
                                                                                                                                   > 80%: 2%
                      1%

                                                       Performing
                                                          99%                                                                      < 60%: 94%

     1) Performing CREF-portfolio only, LTV / YoD pre Covid-19, exposure as at 31.03.2020

53
Eastern Europe CREF portfolio
Total volume outstanding as at 31.03.2020: € 0.9 bn

                             by product type                                                                      by property type
                                                                                                              Others: 7%

                                                                                                  Hotel: 9%

                                                                                            Logistic: 12%

                                                                                                                                      Office: 40%
                                                            Investment
                                                         finance: 100%
                                                                                                    Retail: 32%

                             by performance                                                                       by LTV ranges1
                     NPLs                                                                              60-80%: 7%              > 80%: 2%
                      8%

                                                          Performing                                                                  < 60%: 91%
                                                             92%

     1) Performing CREF-portfolio only, LTV / YoD pre Covid-19, exposure as at 31.03.2020

54
North America CREF portfolio
Total volume outstanding as at 31.03.2020: € 7.9 bn

                             by product type                                                                 by property type
                                                                                                    Residential: 3%

                                                                                               Retail: 14%

                                                                                                                                       Hotel: 42%

                                                              Investment                    Office: 41%
                                                           finance: 100%

                             by performance                                                                  by LTV ranges1
                     NPLs                                                                                                       > 80%: >0%
                                                                                                   60-80%: 5%
                      1%

                                                       Performing                                                                   < 60%: 95%
                                                          99%

     1) Performing CREF-portfolio only, LTV / YoD pre Covid-19, exposure as at 31.03.2020

55
Asia / Pacific CREF portfolio
Total volume outstanding as at 31.03.2020: € 0.6 bn

                             by product type                                                                     by property type
                                                                                                          Logistics 9%

                                                                                             Residentail: 1
                                                                                                14%

                                                                                                                                        Hotel: 47%
                                                                                            Office: 14%
                                                            Investment
                                                          finance 100%
                                                                                                    Retail: 16%

                             by performance                                                                       by LTV ranges2
                                                                                                          60-80%: 2%

                                                      Performing                                                                    < 60%: 98%
                                                        100%

     1) Incl. Student housing (UK & Australia only)
     2) Performing CREF-portfolio only, LTV / YoD pre Covid-19, exposure as at 31.03.2020

56
Commercial real estate finance portfolio (CREF)
Dimension of (theoretical) Stage migration effects have benefit from
successful de-risking executed in 2019 and Covid-19 related provisions
already considered in Q1/20 LLP

                                                    What:        IFRS 9 Stage 2 maximum shift, LLP dimension
                                                                 depending on rating development
        Stage 1 (1Y EL)
        Stage 2 (LEL)
        Stage 3a (model-based)                      How:      A Modelling an (unrealistic) theoretical case
                                                                of 100% loan volume migrating from
                                                                Stage 1 to Stage 2
                                                              B Additional shift of 1-2 rating classes

                                                    Impact:      Recognition in P/L

                                          B         Dimension: Q1 2020: ~ € 100 mn additional Stage 2 LLPs
                                                               YE 2018: ~ € 150 mn additional Stage 2/3a LLPs
                             A
                                                    ➔ Dimension of (theoretical) Stage migration effects
                                                      have benefit from successful de-risking executed
                                                      in 2019 and Covid-19 related provisions already
                                                      considered in Q1/2020 LLP
     YE 18 Q1 20        YE 18 Q1 20   YE 18 Q1 20

57
CREF Portfolio/
Consulting/ Dienstleistungen Bank
Aareon

58
Structured Property Finance
Specialist for specialists

                                                             Aareal Bank Group
                                                         Structured Property Finance

     ▪ Cash-flow driven collateralised business
        ▫ Focus on senior lending
        ▫ Based on first-ranking mortgage loans
     ▪ Typical products, e.g.:

         Single asset investment finance
         Portfolio finance (local or cross-border /-currency)
         Value add-finance
     ▪ In-depth know-how in local markets
       and special properties
         Local expertise at our locations
         Additional industry expertise (head offices)
     ▪ International experience with employees from
       more than 30 nations

59
      Note: All 2019 figures preliminary and unaudited
Consulting / Services
High customer overlap with substantial cross-selling effects

                                                         Aareal Bank Group
                                                         Consulting / Services

                        Aareon Group: IT Services

     ▪ Market-leading European IT-system house
       for the (ERP based) management of residential and
       commercial property portfolios
     ▪ ~ 60% market share in German key market
       with ~6 mn units under management
     ▪ Comprehensive range of integrated services
       and consulting

                   Aareal Bank: Transaction Banking

     ▪ Market-leading integrated payment transaction
       systems for the housing industry
     ▪ Key clients: large size property owners / managers
       and utility companies
     ▪ ~100 mn transactions p.a. (volume: ~€ 50 bn)
     ▪ Ø deposit volume of € 10.7 bn in 2019

60
      Note: All 2019 figures preliminary and unaudited
Aareon
Positive sales revenue (+9% yoy); exceptional growth in digital (+30% yoy)

                      Sales revenue development                                          ▪ Aareon continued to deliver in Q1 as expected
ERP revenue in € mn                                            Digital revenue in € mn     after strong FY 2019 results
                          Total sales revenue1) : +9%                                    ▪ Aareon’s positive sales revenue development is driven
                                                                                           by organic growth and by contribution of CalCon
             ERP revenue1) : +4%             Digital revenue1) : +30%
 80

                                                         70                              ▪ ERP has grown by 4% qoq. New customer wins
                        63                                                  64             generated a growth of SaaS revenues and additional
        59                             60
                                                          16
                        12                                                  15
 60

        12                              12                                                 licenses
 40

                                                                                         ▪ Digital has grown by 30% qoq. Based on higher
        47              51              48                55                49             penetration with existing digital products and CalCon,
 20

                                                                                           Aareon managed to increase the share of digital
 -

                                                                                           revenue (% of total sales revenue) to 23% in Q1 ’20
      Q1 2019         Q2 2019       Q3 2019          Q4 2019            Q1 2020            (Q1 ’19: 20%)
          Q1 ‘20 Share of recurring revenue (LTM) 2)                                     ▪ Recurring revenues share (LTM) of 65% (Q1 2019: 63%)
                                                                                           at high level and has steadily been growing throughout
                                                                                           the quarters
                                                                                         ▪ High share of recurring revenue helps smoothing
                                                                                           quarterly volatility and bridges adverse effects of
                35%                                                                        business cycles and tail events, e.g. Corona pandemic
                                                                                         ▪ Trend in the customer base to buy into SaaS based ERP
                                                                                           and digital solution is ongoing, additionally the demand
                                                               Recurring:
                                                                 65%                       for outsourcing services remains high as well

      1) Represents growth rate from Q1 2019 to Q1 2020
      2) LTM: Last twelve month

61
Aareon
Aareon on track with improving margins and high R&D spend

     Adj. EBITDA / Adj. EBITDA margin development - ytd                             ▪ Solid operational performance underpins the
Adj. EBITDA (€ mn)1)
65
                                                      25%      Adj. EBITDA margin
                                                                              30
                                                                               %      robust and sustainable growth of Aareon and
55
        23%            23%            23%
                                                                     23%      25
                                                                               %      its resilient business model
                                                                                    ▪ Adj. EBITDA increased in Q1 ‘20 to € 15 mn
45                                                                            20
                                                                               %

                                                       64                             (Q1 ’19: € 14 mn)
35                                                                            15
                                                                               %

25                                                                            10
                                                                               %

                                       42
15
                       29                                                     5%    ▪ Adj. EBITDA margin in Q1 ‘20 remains on the level of
        14                                                           15
 5                                                                            0%      Q1 ’19 with 23% and aligned with Aareon seasonality
    Q1 2019          Q2 2019        Q3 2019          Q4 2019       Q1 2020
Impact from one-offs on EBITDA (€ mn)
         0              0               0              0              0
Impact from strategic investments on EBITDA (€ mn)
         0              0               -1             -2             -1

                         RPU and R&D spend                                          ▪ Over the last 12 months, Aareon’s RPU amounted
                                                                                      to ~ € 25
                                                                                    ▪ Aareon has spent ~20% of total software revenues for
             Revenue per unit (RPU) – LTM                            € 25             research and development (R&D) purposes YtD
                                                                                    ▪ Aareon aims to increase its R&D spend to ~25% short
                                                                                      term on the backdrop of its digital growth strategy

     R&D spend as % of software revenue – YtD                        20%
              - thereof capitalised                                  19%

62
Aareon segment
Strategic initiatives

                                        ▪ Aareon Smart Platform:
                                          Further roll-out
                       Organic
                                        ▪ Virtual Assistant:
                       initiatives
                                          Preparation of market launch
                       ▫ (new)
                          products      ▪ New growth cases:
                       ▫ (new)            Checking potential development partners for two cases
                          markets)      ▪ First venture OFI Group with platform Ophigo:
      Progress
    on strategic                          First end-to-end-transaction successfully realized;
   initiatives and                        pipeline targets achieved
 the development
    of products,
    markets and                         ▪ CalCon Group:
         M&A                              Acquisition was effective as of 1 January 2020 (contract was signed in
                                          November 2019). Project to integrate the CalCon Group’s solutions –
                                          epiqr for property condition assessment and the new AiBATROS®
                         Inorganic        product generation – in Aareon Smart World has been pressed ahead.
                     initiatives, M&A   ▪ M&A:
                                          Aareon Management has conducted extensive market screening for
                                          potential targets and numerous opportunities have been identified which
                                          are systematically pursued. Overall, we are confident of announcing
                                          further acquisitions this year.

63
Aareal Next Level

64
Aareal Next Level
Three strategic pillars, as presented in January 2020

65
Aareal Next Level
Aareon: Our value creation levers

 Value creation levers…                                                                           …and their potential impact

                                                                                                                I

                                                                              Recurring
                                                                               revenue

                                                                                                                    # of Units
                                                                      Units
                                                            RPU
                                                                                                                                          M&A Growth
                                                                                                                                          Dimensions
Strengthen our leading European position                    ✓        ✓         ✓
                                                                                                                                 Status     New
                                                                                                                                          Growth
Grow digital product business on installed                                                                                        Quo      Cases

customer base significantly                                 ✓                  ✓                                                                                           II
                                                                                                                                               Revenue per Unit (RPU)
Drive RPU based on installed customer
base and new markets                                        ✓        ✓                            I    # of Units (mn)                             II      RPU1) (€)
                                                                                                                                 ~50                                ~100
Leverage Aareon products along vertical
industry expansion                                          ✓        ✓
                                                                                                        ~10                                             ~25
Develop software as a service business and
manage cloud strategy beyond Germany
                                                            ✓                  ✓
                                                                                                      Aareon                     TAM1                   Aareon      TAM1
                                                                                                       2019                                              2019

           ▪ Aareon organic growth plan as presented in May 2019 well on track
           ▪ New classification of Aareon as industrial holding allows additional M&A activities – on our own and /
             or including partner(s)

     1) TAM and RPU figures rough company estimations, describing the expected entire future market potential

66
Aareal Next Level
Our KPIs and targets

                                                                                                Stabilisation and                             Reaping the
                                                           2019                                investment phase                              rewards phase
                                                                                                  (2020 - 2022)                                (Mid-term)
                                                                                          Low single digit growth
 Revenues Group1)                                      € 762 mn
                                                                                                 (CAGR)

 ▪ o/w Aareon                                                  7 - 9% CAGR revenues // 22 - 25% CAGR digital revenues

                                                                                                                                                € >110 mn
 Adj.   EBITDA Aareon2)                                 € 64 mn
                                                                                                                EBITDA from M&A on top

 Capitalisation                                                                             ~12.5% B4 CET1 ratio

                                                                                                    Stable                                         12%
 Pre tax RoE                                               8.7%
                                                                                         (through investment phase)                    (more supportive environment)

 Dividend policy                                                 50% base dividend plus 20-30% supplementary dividend

           ▪ Further development and investments into three strong business propositions
           ▪ Shift in earnings and value contribution towards capital light and digital business

     1) Revenues Group = NII + NCI
     2) 2019 + stabilisation and investment phase excl. strategic investments; Reaping the rewards phase incl. strategic investments

67
Aareal Next Level
Three main contributors to achieve a 12% pre tax RoE (mid-term)

                                                                     Reaping the                External
                   Strategic initiatives
                                                                      rewards               3 environment

                           ▪   Increase syndication                                               ?
                           ▪   Further expand asset light
            „Activate“
                           ▪   Enhance product offering                                      Interest rate
                           ▪
 Bank

                               Optimise cost base                                            environment

                           ▪ Grow commission income
 1

                           ▪ Enter new markets
            „Elevate“
                           ▪ Optimise funding and cost                                      CRE (lending)

                                                            Impact
                             base                                                             markets

                                                                                   Impact
                                                                     12%
 Aareon

                           ▪ Self-funded organic growth
          „Accelerate“
                           ▪ M&A opportunities                                                Regulation
 2

                           ▪ Growing balance sheet, if
                             and when opportunities arise
      Further options
                           ▪ Adjust deposit beta
                                                                                             Technology
                           ▪ …

68
Summary Aareal Next Level

 Highlights

       We have clear visions of how to develop further our individual business activities in order to strengthen
       their respective independent profiles

       Regardless of the continuous adverse environment and due to our confidence in the consistency of our
       strategic measures, we feel comfortable with confirming our highly attractive dividend policy with a payout
       ratio of 50% base plus 20-30% supplementary dividend

       By investing in our businesses, we will significantly increase profitability and further enhance strategic
       optionalities. In a more supportive environment we aim a 12% pre tax RoE

69
Dividend Policy

70
Aareal Next Level
Our Dividend Policy – Confirmed despite significant regulatory burdens

 Payout ratio of up to 80% confirmed                          Significant book value per share growth incl. dividend
                                                                   €
                                                              60
                 ▪ We intend to distribute approx. 50%                                                           53
       Base                                                                                               52
                   of the earnings per ordinary share                                              49
     Dividend                                                 50                            47
                   (EpS) as base dividend
                                                                                     44

       +                                                      40              37

                 ▪ In addition, we plan to distribute                  32
                                                              30
                   supplementary dividends of up to
                   20-30% of the EpS under the
                   following prerequisites:                   20
Supplementary
  Dividend        ▫ No material deterioration of the
                    environment (with longer-term and         10
                    sustainably negative effects)
                  ▫ Nor attractive investment opportunities   0
                    neither positive growth environment                2013   2014   2015   2016   2017   2018   2019

         ▪ Attractive dividend policy and significant book value growth creating sustainable value
           for Aareal and hence our shareholders

71
Regulation

72
Economic ICAAP the next focus on the regulatory agenda –
our reading and take away

                          House of ICAAP                                               1    Economic ICAAP on SSM priority list 2020
                according to ECB ICAAP Guidelines                                           ▪ Ongoing discussions regarding interpretation of requirements
                                                                                            ▪ Different methods currently used throughout Europe to
                            Maintaining capital                                               estimate future volatility (scenario based vs. VAR models)
                      adequacy on an ongoing basis
               over the medium term from 2 complementary
                                                                                            ▪ ICAAP Guidelines published end of 2018 are very
                          internal perspectives                                               conservative regarding holding period and confidential
                                                                                              interval
     Regulatory capital ratios                       Economic ICAAP
                                                                                            ▪ ECB aims for future harmonization (equal to TRIM?)
Normativ e internal perspective                                                               and potential tightening
                                            Economic internal perspectiv e
▪ Ongoing fulfilment of all relevant        ▪ Risks that may cause economic
  regulatory requirements and                 losses are covered by internal
  external constraints                                                                  2   AT1 with normative triggers will no longer be eligible under
                                              capital 1)
▪ Medium-term projections for at            ▪ Capital adequacy concept based                Economic ICAAP:
  least three years:                          on economic value considerations
  ▫ Ensure the ongoing fulfillment of
                                                                                            Regulatory capital ratios: Future treatment appears to be
                                              (e.g. net present value approach)
    OCR plus P2G in the baseline,           ▪ Internal definition of capital
                                                                                            more generous, although decisions will be taken on a case
    and TSCR in adverse scenarios                                                           by case basis
                                            ▪ Point-in-time risk qualification of
  ▫ Takes into account all material           the current situation feeding into
    risks (not limited to Pillar 1 risks)     medium-term assessment
                                                                                            ▪ P2R could be partly covered by AT1 (and/or T2)
  ▫ Considers upcoming changes in             covering future developments                  Economic ICAAP: Future requirements will be tightened
    the legal / regulatory /                ▪ Adequate and consistent internal
    accounting framework                      risk quantification methods                   ▪ AT1 with normative triggers not accountable any more
▪ Adequate and consistent internal          ▪ Internal indicators, thresholds and              (see ECB feedback statement; question 208)
  methods to quantifying impacts on           management buffers.
  Pillar 1 ratios                                                                           ▪ Interim grandfathering of existing AT1 (issued, cut off date?)
▪ Additional management buffers                                                                not decided yet, but unlikely from our point of view
  determined by the institutions

       ▪ AT1 in the economic ICAAP, currently and presumably in future no alternative instruments (beside CET1)
         available to fulfil ECB requirements (economic triggers instead of normative)
       ▪ Economic ICAAP to become the new capital constraint for European banks?
      1) Different risk categories regarding regulatory capital ratios and economic ICAAP

73
Sustainability Performance

74
Aareal Bank Group
Stands for solidity, reliability and predictability

      Doing business sustainably

  Development of Return                         20.2% Common Equity                                  € 26.1 bn                   Digital solutions
 on Equity1) demonstrates                      Tier 1 ratio2), significantly                    Valuable Real Estate            boost our client's
     financial strength                         exceeding the statutory                          Finance Portfolio 3)         sustainability records
                                                     requirements

  Above average results                       Covered Bonds4) with best                        Aareal Bank awarded            Preparations for future
  in sustainability ratings                    possible ratings – also                        as top employer for the        disclosure requirements
                                               attractive from an ESG                         12th time in succession            (EU Action Plan)
                                                    point of view5)

     1)   Pre-tax RoE of 8.7% as at 31.12.2019
     2)   Basel 3, as at 31.03.2020
     3)   REF-portfolio includes private client business (€ 0.4 bn) and WIB’s public sector loans (€ 0.3 bn)
     4)   Mortgage Pfandbriefe rated Aaa by Moody’s
75   5)   imug classified mortgage Pfandbriefe as recommendable investments with regard to ESG aspects (BBB), ​without DHB
Doing business sustainably
Above average ESG-Ratings confirm the company’s performance

                            Environment                                        Social                                       Governance
                            ▪ Environmental financing criteria                 ▪ Strong economic performance                ▪ Transparent reporting on
                              within property valuation (e.g.                    (e.g. contribution to the stability of       remuneration model/details
     Within core business

                              asbestos, energy efficiency, etc.)                 the property banking sector/financial      ▪ High quality ESG-disclosure (e.g.
                            ▪ Transparency initiatives on portfolio              markets and to restoring trust in the        based on Global Reporting Initiative2
                              level (e.g. Climate VaR for new busi-              banking industry)                            (GRI), assured by PwC, anticipating
                              ness 2018 looking at extreme weather             ▪ Contribution to affordable housing           regulatory developments (ICAAP), ESG-
                              events, future policy risk costs and 2°C-          (e.g. with our software solution clients     facts incorporated in analyst presentation)
                              compatibility; additional CMS-fields for           benefit from time, cost and efficiency     ▪ Structure, composition and diversity
                              energy efficiency, green building labels)          savings)                                     of governing bodies (Supervisory
                            ▪ Set-up of ESG-opportunity & risk                 ▪ Failsafe information security                Board established five committees
                              management (e.g. we currently work                 (e.g. we undergo voluntary external          in order to perform its supervisory
                              on an Aareal-Green Building Definition             audits and certification processes)          duties in an efficient manner)
                              (by Q2 2020) and climate reporting                                                            ▪ Governance Roadshow
                              (TCFD1)

                            ▪ Environmental disclosure                         ▪ Fair, performance-oriented                 ▪ CEO-responsibility for ESG matters
     On corporate level

                              (e.g. Aareal’s ecological footprint,               remuneration schemes                         (“tone from the top”)
                              environmental KPIs (datasheet on                 ▪ Employee surveys                           ▪ ESG-targets for Management Board
                              website), CDP reporting, etc.)                   ▪ Management of social matters               ▪ Sustainability matters regularly
                            ▪ Expansion of green electricity                     (e.g. Code of Conduct for employees,         discussed in Board Meetings
                              (88% of total electricity consumption              Code of Conduct for business               ▪ Groupwide Sustainability Committee
                              as of 12/2018)                                     partners, Human Rights policy,               established in 2012
                            ▪ CO2 compensation (parts of business                Diversity Charta, etc.)
                              travel, print materials)

                   1) Downgrade due to average consideration of ESG aspects in governance and corporate processes.

76
Sustainability data
Extends the financial depiction of the Group

      Key takeaways at a glance
 Transparent                          ▪ “Separate Combined Non-financial Report 2019 for Aareal Bank AG” has been published
 Reporting –                             on March 26, 2020
 facilitating informed                ▪ PwC issued an unqualified limited assurance opinion
 investment decisions
                                     MSCI                       Aareal Bank Group with “AA Rating” in highest scoring range for all companies
                                                                assessed relative to global peers reg. Corporate Governance practices
                                                                (as per 06/2019)

                                     ISS-ESG                    Aareal Bank Group holds “prime status” and ranks with a C+ rating among
                                                                the top 15% within the ‘Financials/Mortgage & Public Sector Finance’ category
 Sustainability                                                 (since 2012, re-confirmed 08/2019)
 Ratings – confirming                                           Aareal Bank AG is with a score of 22.9 at medium risk of experiencing
                                     Sustainalytics
 the company’s                                                  material financial impacts from ESG factors, rank 116 out of 934 rated banks
 sustainability                                                 (13th Percentile). (as per 12/2019)
 performance
                                     CDP                        Aareal Bank AG received a C which is in the Awareness band1. This is same
                                                                as the Europe-regional average of C, and same as the Financial services sector
                                                                average of C. (Report 2019)

                                     imug                       Aareal Bank was rated “positive B” in the category “Issuer Performance”;
                                                                rank 6 out of 43 rated banks (as per 07/2019)

     1) Downgrade due to average consideration of ESG aspects in governance and corporate processes.

77
Contacts

Tobias Engel
Director - Head of Markets
T 0611 348 3851
M 0171 866 7073
E tobias.engel@aareal-bank.com

Alexander Kirsch
Director - Markets
T 0611 348 3858
M 0171 866 7081
E alexander.kirsch@aareal-bank.com

Funding requests: funding@aareal-bank.com
Disclaimer

© 2020 Aareal Bank AG. All rights reserved.
This document has been prepared by Aareal Bank AG, exclusively for the purposes of a corporate
presentation by Aareal Bank AG. The presentation is intended for professional and institutional customers only.

It must not be modified or disclosed to third parties without the explicit permission of Aareal Bank AG. Any persons
who may come into possession of this information and these documents must inform themselves of the relevant
legal provisions applicable to the receipt and disclosure of such information, and must comply with such provisions.
This presentation may not be distributed in or into any jurisdiction where such distribution would be restricted by law.

This presentation is provided for general information purposes only. It does not constitute an offer to enter into a contract on the provision of advisory
services or an offer to purchase securities. Aareal Bank AG has merely compiled the information on which this document is bas ed from sources
considered to be reliable – without, however, having verified it. The securities of Aareal Bank AG are not registered in the United States of America
and may not be offered or sold except under an exemption from, or pursuant to, registration under the United States Securities Act of 1933, as
amended. Therefore, Aareal Bank AG does not give any warranty, and makes no representation as to the completeness or correctness of any
information or opinion contained herein. Aareal Bank AG accepts no responsibility or liability whatsoever for any expense, loss or damages arising
out of, or in any way connected with, the use of all or any part of this presentation. The securities of Aareal Bank AG are not registered in the United
States of America and may not be offered or sold except under an exemption from, or pursuant to, registration under the United States Securities Act
of 1933, as amended.

This presentation may contain forward-looking statements of future expectations and other forward-looking statements or trend information that are
based on current plans, views and/or assumptions and subject to known and unknown risks and uncertainties, most of them being difficult to predict
and generally beyond Aareal Bank AG’s control. This could lead to material differences between the actual future results, performance and/or events
and those expressed or implied by such statements.

Aareal Bank AG assumes no obligation to update any forward-looking statement or any other information contained herein.

79
You can also read