Flywheel Models + iQiyi (NASDAQ: IQ) - An Investment Case Study By Hayden Capital ValueX Vail | June 27-29, 2018
←
→
Page content transcription
If your browser does not render page correctly, please read the page content below

Flywheel Models + iQiyi (NASDAQ: IQ)
   An Investment Case Study By Hayden Capital
         ValueX Vail | June 27-29, 2018

                                                                  Hayden Capital
                                                        79 Madison Ave, 3rd Floor
                                                           New York, NY. 10016

                                                             Office: (646) 883-8805
                                                            Mobile: (513) 304-3313
                                                Email: fred.liu@haydencapital.com
Disclaimer
These materials shall not constitute an offer to sell or the solicitation of an offer to buy any interests in any fund or account managed
by Hayden Capital LLC (“Hayden Capital”) or any of its affiliates. Such an offer to sell or solicitation of an offer to buy will only be
made pursuant to definitive subscription documents between a fund and an investor.

The fees and expenses charged in connection with the investment may be higher than the fees and expenses of other investment
alternatives and may offset profits. No assurance can be given that the investment objective will be achieved or that an investor will
receive a return of all or part of his or her investment. Investment results may vary substantially over any given time period.

Reference and comparisons are made to the performance of other indices (together the “Comparative Indexes”) for informational
purposes only. Hayden Capital’s investment program does not mirror any of the Comparative Indexes and the volatility of Hayden
Capital’s investment strategy may be materially different than that of the Comparative Indexes. The securities or other instruments
included in the Comparative Indexes are not necessarily included in Hayden Capital’s investment program and criteria for inclusion in
the Comparative Indexes are different than those for investment by Hayden Capital. The performance of the Comparative Indexes
was obtained from published sources believed to be reliable, but which are not warranted as to accuracy or completeness. Unless
noted otherwise, the returns of the Comparative Indexes presented do not reflect fees or transaction costs, but those returns do
reflect net dividends, if any.

                                            Fred Liu, CFA | 646-883-8805 | fred.liu@haydencapital.com                                 2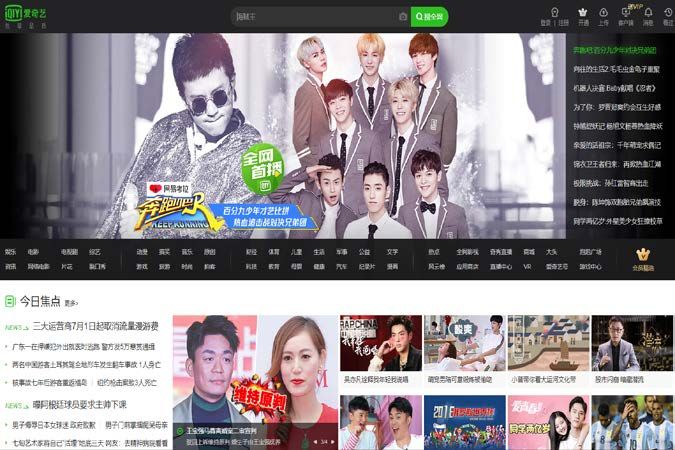
Who Is Hayden Capital?
Investment Strategy: We invest primarily via a long-biased, low-turnover, global equity strategy. Investments are under-written with
a 10+ year view. The goal is to compound our capital in-line with these businesses’ growth in earnings power.
•    We focus on underlying business unit economics, as opposed to market factors like sentiment or multiple expansion, as the
     source of our returns.
•    Our typical portfolio comprises of 6 – 15 high-quality companies, that we have studied for an extensive period.
•    We don’t aim to “beta-hedge” our positions, as this typically results in sacrificing long-term gains for reducing short-term
     volatility. As long-term investors, we would rather have a superior (although lumpy) annual return, than a steady (but mediocre)
     return.
•    In fact, we embrace volatility in most cases as it allows us to purchase companies we like for cheaper.

Investment Objective: Achieve returns exceeding the broader Global Equity Markets (measured by the S&P 500 and MSCI World),
over a full market cycle. Hayden Capital seeks to achieve these returns primarily through publicly traded, marketable securities of U.S.
and non-U.S. companies.
•    No complex derivatives, “pair-trades”, or significant use of leverage.
•    All accounts are Separately Managed Accounts (“SMAs”), as opposed to a pooled structure. We think this is in the best interests
     of our clients, as it provides clients full ownership of their investments, daily liquidity, and transparency.

                                            Fred Liu, CFA | 646-883-8805 | fred.liu@haydencapital.com                                3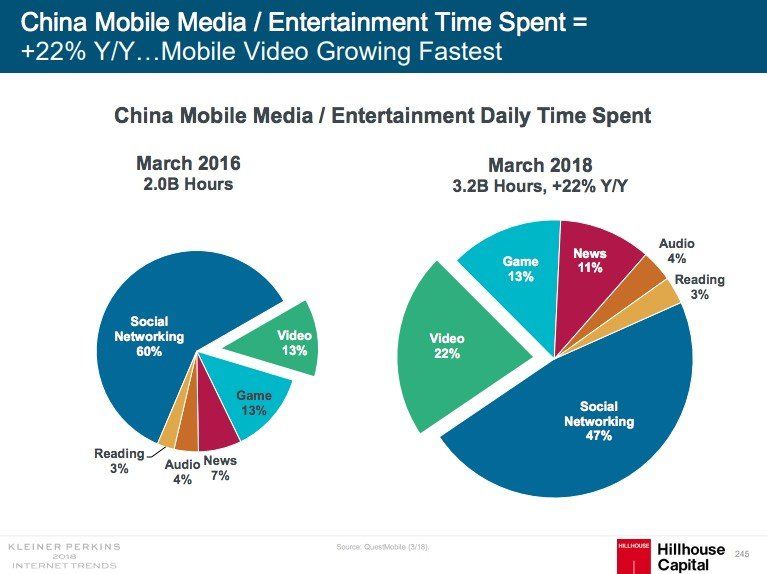
About Me

Fred Liu, CFA
Managing Partner

Fred Liu is Hayden Capital’s founder and portfolio manager. He
holds a B.S. in finance and international business from the Leonard
N. Stern School of Business at New York University. He also holds
the Chartered Financial Analyst (CFA) designation.

Prior to founding Hayden Capital, Fred was a research analyst at
New Street Research responsible for covering the cable and satellite
industries. Before this, he was the industrials analyst on J.P.
Morgan’s Small Cap Equity fund, a five-star Morningstar ranked
strategy that invested in securities under $2 Billion in market cap.

Fred purchased his first stock at the age of 11, and has been an avid
value investor ever since. He currently resides in New York City.

                                           Fred Liu, CFA | 646-883-8805 | fred.liu@haydencapital.com   4
Here’s How We’ve Done So Far…
It’s still extremely early, especially given our decade-long horizon.
Our thesis isn’t proven yet, and if we were a VC/PE fund, we’d still be in the “investment period” of the strategy. But I’m glad
to be adding value to my partners thus far…
Performance Table Cumulative Return Since Inception
Return percentage during period Compared to S&P 500 Total Return Index & MSCI All-Country World Index
1 Hayden Capital returns are net of actual fees. Individual client performance may differ based on fee schedule and date of funding.
2 Includes Cash and previously an Inverse S&P 500 ETF, which allowed us to decrease our long exposure without paying taxes on profitable positions.
3 Hayden Capital launched on November 13, 2014. Performance for both Hayden Capital and indexes reflects performance beginning on this date.
4 Quarter-to-date performance as of June 13, 2018
Fred Liu, CFA | 646-883-8805 | fred.liu@haydencapital.com 5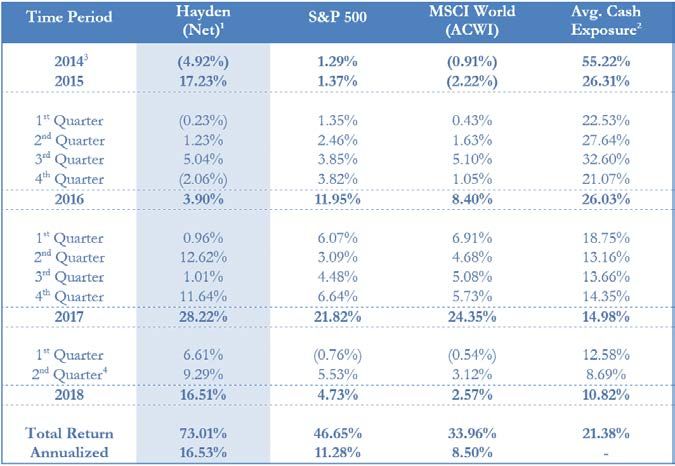
Flywheel Business Models
                 It’s our specialty…

    Fred Liu, CFA | 646-883-8805 | fred.liu@haydencapital.com   6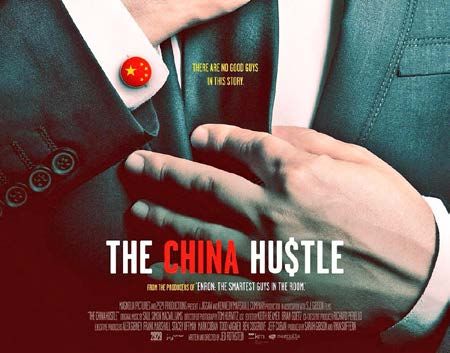
What is a Flywheel?
Traditionally, a flywheel is a spinning rotor used for storing kinetic energy. It takes a relatively large amount of energy to get
started, but very little to keep it moving once it gets going.
In business, the “flywheel effect” concept is used to explain the notion of positive-feedback loops.
The idea is once the business model gets momentum, output of the business (ex. such as increased volume) directly leads
to positive inputs (ex. lower costs per unit), which leads to better outputs (lower costs = lower prices = more volume).
This creates a “virtuous cycle”, with very little energy wasted and is very hard to stop once it gets going.
Most of Hayden’s investments feature this concept in some capacity.
Old-School Flywheel New-School “Flywheel”
A flywheel used for smoothing energy output Amazon’s Famous Flywheel Sketch
Fred Liu, CFA | 646-883-8805 | fred.liu@haydencapital.com 7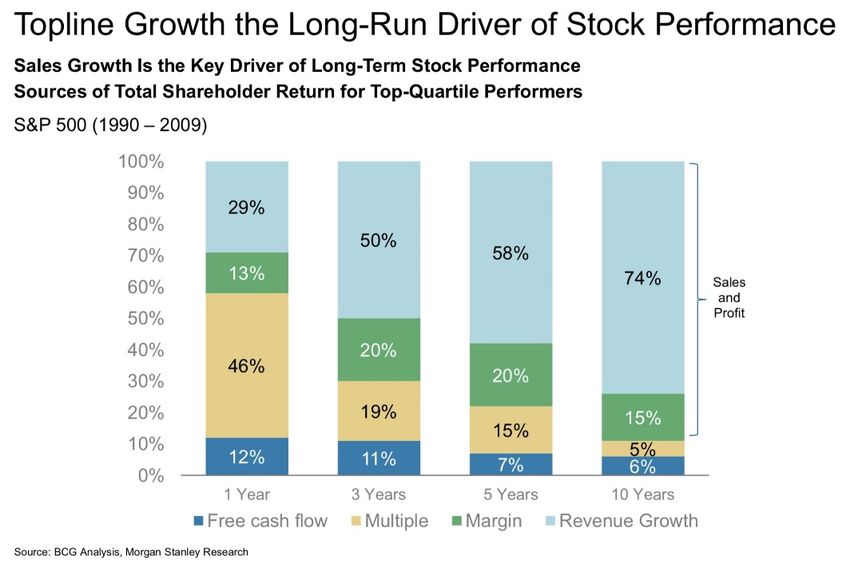
Margin Reinvestment Profiles
Reinvestment Scenario: A company is taking profits from highly profitable lines of business, and investing them into newer lines
of business. This makes the overall margins seem very low, or even negative.
Pricing Power Scenario: A company prices its product far below the value-add to the customer. But as customers start to
depend upon a company’s products or services, the company has the ability to ask for more over time.
We believe the best companies are those that have both elements.
What if by raising the price, you can actually widen / increase the value for the customer (i.e. the Customer Value to Price
ratio)? Such a price increase would actually accelerate the company’s growth.
You can get “double benefits”, as price increases give the company more cash flow to reinvest into increasing the
customer value, which attracts more customers / speeds up the growth rate, and thus generates even more cash.
Our thesis is: growth through volume (because you provide the best product) is more sustainable than growth through pricing.
And consistently reinvesting pricing increases into generating more customer value is the most sustainable “moat” of them all.
Margin Profile #1 – Reinvestment Margin Profile #2 – Pricing Power
Excess profits from mature projects are invested into new projects Company is pricing its product far below the value offered
Fred Liu, CFA | 646-883-8805 | fred.liu@haydencapital.com 8
Why Does This Matter?
In investing, there are broadly three types of investors.
Each strategy has its own factors to focus on to be successful (i.e. catalysts for multiple re-rating for event-driven/traders,
asset values & path to monetization for deep-value / distressed investors, and earnings power growth for “quality-value” /
“compounder” type investors.
Hayden’s strategy specializes on the earnings growth category.
Earnings growth is a function of ROICs x Reinvestment Rate.
If we can find the [incremental return on those investment projects] x [how much is being reinvested], we can tell how
quickly a company will grow its earnings power.
Hayden Capital /
Distressed / Deep-value / “Compounders” / Event-Driven Funds / Market Neutral /
Sum of Parts Investors Long-Term Investors “Traders”
Stock Return = [Dividend / Stock Buyback] + [Earnings Growth] + [Multiple Expansion / Contraction]
Earnings Growth = Return on Invested Capital x Reinvestment Rate
Fred Liu, CFA | 646-883-8805 | fred.liu@haydencapital.com 9
Sales and Earnings Growth Drive Long-Term Performance
At Hayden, we aim to invest with a decade-long investment view.
Over this time period, sales and earnings power growth drive ~90% of equity returns (i.e. fundamental business
performance).
It’s not worth our time looking for “catalysts” to get multiple expansion, or understand why other investors will pay a
higher multiple for the company in the future.
We get a higher return on time by understanding the underlying returns / unit economics of projects the companies are
investing in, and buying these businesses at a good-to-fair price.
If we can understand the drivers of the high incremental ROICs, this is what will drive higher earnings power, and
therefore intrinsic value growth in the future.
Incremental ROICs Approximate Intrinsic Value Growth Sales & Earnings Power Drive Returns Over the Long-term
Focus on fundamentals, and the stock price will follow From Morgan Stanley Research
Hayden Capital / “Compounders” /
Long-Term Investors
Growth accelerates
because:
Future ROIC > Over a long time
Historical ROIC horizon, the slope
of the Intrinsic
Value curve
drives the
Value
majority of
returns.
Better to focus
your time here.
Time
Fred Liu, CFA | 646-883-8805 | fred.liu@haydencapital.com 10iQiyi
How does iQiyi fit this model?
Fred Liu, CFA | 646-883-8805 | fred.liu@haydencapital.com 11iQiyi Overview
iQiyi is China’s leading online video streaming platform, with ~440M monthly users today. The company generates revenues
from a combination of subscription fees (started gaining traction in 2015, with the increased simplicity of online payment via
WeChat Pay / Alipay), and advertising revenues.
Paid Subscribers total ~65M today (~15% of total users), and pay ~20RMB ($3 USD) per month. This gets them early
access to shows, exclusive content produced by iQiyi, additional votes for talent competition shows, reduced ads, etc.
Free Users number ~375M users, who are monetized primarily through advertisements and product sponsorships.
The company spun off of Baidu, and IPO’d on NASDAQ at $18/share on March 29, 2018.
Shares are currently trading ~$36/share, or a $25BN market cap.
The business is still unprofitable, and we estimate will generate RMB 25 Billion of sales (~$4BN USD) in 2018.
We predict the business will grow revenues at a 34% CAGR from 2018-22, and reach break-even by 2021.
Revenue Breakdown iQiyi.com Homepage
In RMB millions As of June 22, 2018
Fred Liu, CFA | 646-883-8805 | fred.liu@haydencapital.com 12Industry Tailwind
It’s all about the Millennials…
Fred Liu, CFA | 646-883-8805 | fred.liu@haydencapital.com 13Chinese Millennials
Chinese millennials now make up 25% of the population. In total, they number 351M, or 20M more than the entire population of
the United States.
A core thesis of Hayden’s portfolio, is that consumers (esp. millennials) are becoming more homogenous world-wide.
Many are familiar with & want the same brands as their Western counter-parts, have traveled more extensively than
previous generations, have transparency to what’s “cool / trending” via the internet, and are better educated.
Paying for content or purchasing goods online comes much more naturally vs. previous generations.
This Is China’s New Generation: “Fu Er Dai” (富二代) Number of Chinese Millennials > Entire Population of US
“Fu Er Dai” translates to “Rich Second Generation” From FT.com, “The Millennial Moment – In Charts”
(Here’s a sarcastic, albeit some-what true, video about Mainland Millennials vs ABCs, LINK)
Fred Liu, CFA | 646-883-8805 | fred.liu@haydencapital.com 14Where Millennials Are Spending Their Time
China's Video Consumption has grown ~65% y/y, in the last two years.
The number of hours spent on entertainment (“The Pie”) has grown 22% y/y.
Meanwhile, video consumption has also increased as a % of time spent (“The Slice is Getting Bigger”).
There were ~260M video hours consumed in 2016 vs. ~704M hours in 2018.
It's now 22% of the daily time spent on entertainment, with share taken from Social Media.
Time on mobile internet video is rapidly catching up to time spent on traditional TV.
Online video advertising spend is expected to grow 25-30% y/y as a result.
China Daily Time Spent on Entertainment Mobile Video Consumption Gaining vs. Linear TV
Breakdown of daily time spent across media categories Market share, as a % of daily time spent consuming video; in minutes per day per user
Source: Kleiner Perkins 2018 Internet Trends, Hillhouse Capital, Goldman Sachs, iResearch
Fred Liu, CFA | 646-883-8805 | fred.liu@haydencapital.com 15iQiyi Is Best Positioned To Capture This Trend
So consumers are spending more time on videos… but what about long-form vs. short-form content?
There’s no doubt short-form videos (Douyin, Kuaishou, etc) have grown very quickly in the last few years.
But we believe there’s a distinction between the two. Surveys indicate short-form video is primarily consumed during
previous “idle” time: on the bus, subway, bored at work, etc. Long-form is “dedicated” time, after you come home from
work or on the weekends. Although there’s some competition for attention time, the overlap isn’t significant.
As you may expect, short-form videos have higher engagement (these are 15sec videos), but less time spent per day.
Long-form requires a time commitment, and not everyone has an hour each day to watch an episode. So time spent per
day is greater, but engagement is lower. iQiyi has the highest users + time spent out of the long-form video platforms.
Given the longer time spent and higher number of users, we believe long-form content is the more valuable platform.
Exclusive content drives subscription pricing, vs. short-form where very similar videos are free on multiple platforms.
More time spent, leads to better user data / targeting, which also increases the ability for pricing power of advertisements.
Not Only More Users… …But Users are More Engaged (Time Spent per Day)
Monthly active users; engagement measured as daily active users / monthly active users (daily logon rate) In minutes; average time spent per day, per user on the app;
102 99 96
463 458
50.0% 51.1%
374 76
300
235
24.0% 23.0% 23.0%
19.0%
25
20
72
iQiyi (IQ) Tencent Youku Tudou Bilibili (BILI) Douyin Kuaishou iQiyi (IQ) Tencent Youku Tudou Bilibili (BILI) Douyin Kuaishou
Video (Tik Tok) Video (Tik Tok)
Long-Form Video Short-Form Video Long-Form Video Short-Form Video
MAU (in mm) Daily Engagement (DAU / MAU %)
Source: Goldman Sachs, iResearch, TechinAsia, QuestMobile, Company Data, Hayden Capital Estimates
Fred Liu, CFA | 646-883-8805 | fred.liu@haydencapital.com 16iQiyi Today How did iQiyi get to where it is today? Fred Liu, CFA | 646-883-8805 | fred.liu@haydencapital.com 17
Why is iQiyi So Popular?
China’s Traditional TV networks generally produce lower-quality content. Most are state-owned, highly fragmented / regional,
politically-driven (acting as political advocates for the government) and derive majority of revenue from prime-time advertising.
Because of this, the content tends to be more generic, geared to appealing to a wide-audience. Instead of producing high-
quality, niche content.
Evidence of this is the top 20 shows in China got a Douban rating (like IMDB in US) of only 5.7 stars. The top 20 US
shows got a 8.3 rating on Douban.
iQiyi and it’s competitors are not limited by these factors, leading to the freedom to produce differentiated content tailored to
various niches. iQiyi was the #3 app in China (where cellphone addiction is real, and the primary device is mobile).
Paid penetration is still low, at only ~14% household penetration, vs. NFLX at ~45% in the US.
Top Apps in China by Unique Devices Top iQiyi Show KPIs
April 2018 Rankings Views in millions, cost in millions of RMB
English Name Release Date Total Views Total Cost Cost / Episode % from mobile % of female viewers Avg. Monthly Views
Drama Series
The Mys ti c Ni ne June, 2016 12,300 240 5.0 78.0% 51.0% 616
The Los t Tomb June, 2015 4,410 60 5.0 73.0% 49.0% 133
Variety Shows
Ra p of Chi na June, 2017 2,900 250 20.8
Idol Producer Ja nua ry, 2018 3,000 N/A N/A
Source: Goldman Sachs, iResearch, China Renaissance, Company Data
Fred Liu, CFA | 646-883-8805 | fred.liu@haydencapital.com 18Focus on Original Content
iQiyi started creating original content in 2015. Since then, it has produced several Multi-Billion view shows:
Many of the top 100 shows (head content) are available across multiple platforms (iQiyi, Tencent, Youku). Counter-
intuitively, the key differentiator is in the long-tail, niche content.
iQiyi has the most exclusive shows out of the three platforms. ~10% of programming is original today… and expected to
increase to 15% over the next 3 years. Management’s ideal level over time is 30 – 40%.
This tracks content cost spend, with ~15% spent on original content today, increasing to ~25% over the next 3 years.
Examples: Rap of China (3BN views | 12 episodes | aired 2017), Mystic Nine (12.3BN views | 48 episodes | aired 2016),
Idol Producer (3BN views | 12 episodes| aired 2018), Hot-Blood Dance Crew (1.8BN views | 12 episodes | aired 2018).
The IPO in March 2018 raised $2.5BN for the company.
Of this, it plans to spend 50% on content ($1.25BN). And half of this (25%) on original content ($625M) over the next
3-5 years. This is in addition to organic cash generated from subs & ads. Original content spend is up +100% this year.
Unique, Millennial Driven Content
Rap of China, Idol Producer, Qipa Talk, Keep Running
Fred Liu, CFA | 646-883-8805 | fred.liu@haydencapital.com 19Pulling Away From The Pack
Tencent & Youku are shifting to head content, which as explained before, isn’t differentiated and not monetizable (you can’t
charge a subscription fee, if you can watch it for free elsewhere).
iQiyi is the only one growing the long-tail / exclusive content (see exhibit below), which is what drives customer value.
Original content is also cheaper (~7M RMB per episode) vs. licensed content (~15M RMB), while having higher retention.
Notice iQiyi is spending slightly less in recent years vs. Tencent, but is producing far more shows. This is due to Tencent
aggressively paying up for non-exclusive head content, while iQiyi focuses on long-tail exclusive shows (higher retention & ROI).
iQiyi is more efficient at content production, which is aided by its agreements for revenue share deals on exclusive mid-tail
content (166 titles, as of June 2018). This saves on production costs, while generating more paid subscribers.
We estimate iQiyi has the highest gross margin of the 3 players (+5% gross margin vs. Tencent), corroborating a higher
ROI on content spend.
Also for comparison, Netflix spent $6.3BN on content in 2017, while iQiyi and Tencent both spent ~$2BN each.
This is significant, considering Hollywood shows are more costly to produce vs. in China (~$5M per episode vs $1M).
As illustration, the majority of content costs are in labor, and Chinese Tier 1-2 GDP per Capita is 1/4th that of the US.
Content Wars – iQiyi vs. Tencent Video iQiyi Is Producing More Shows, For Less Money
Content spend per year; in RMB millions Data from China Renaissance, Company Data
Total Drama Shows Available
12,617 13,031
2015 2016 2017 CAGR '15-'17
i Qi yi 238 221 286 9.6%
8,277 Tencent Vi deo 237 216 168 (15.8)%
7,541
Youku 252 174 133 (27.4)%
3,694
3,068
1,838 1,606 Total New Shows Planned In 2018
Dramas Variety Total
i Qi yi 79 54 133
2014 2015 2016 2017 Tencent Vi deo 67 30 97
Youku 58 37 95
iQiyi Tencent Video
Source: Company Data, China Renaissance
Fred Liu, CFA | 646-883-8805 | fred.liu@haydencapital.com 20KPI’s Are Trending Up
In the last three years, iQiyi has grown their monthly users by over 100M users. We expect them to end 2018 with ~470M
MAUs.
Paid subscribers as a % of total users continues to grow, from 3% in 2015 to 23% by the end of 2018E. This indicates a
strong change in consumer’s willingness to pay for content.
Not only are there more people using iQiyi, but the time spent on the platform (engagement) is increasing as well.
0.46hrs per MAU in 2015 to 0.79hrs per MAU in 2018E, for a 19.7% CAGR.
iQiyi User Metrics Time Spent Per User
Users in millions Time in hours; Avg Daily Time is per MAU
0.98
0.93
0.87
0.79
639
0.71
0.64 546
458
0.46 376
300
259
170
2015 2016 2017 2018E 2019E 2020E 2021E
Total Hours Watched Per Day Avg. Daily Time Spent per MAU
Source: iResearch, Company Data, Hayden Capital Estimates
Fred Liu, CFA | 646-883-8805 | fred.liu@haydencapital.com 21iQiyi’s Future
Why iQiyi will keep growing more valuable…
Fred Liu, CFA | 646-883-8805 | fred.liu@haydencapital.com 22Proven Ability to Produce Popular Shows
As shown in previous slides, iQiyi is exhibiting strong KPIs. We expect this to continue, due to the company’s proven ability to
produce / underwrite popular content.
If done correctly, these shows can be very profitable…
For example, we estimate Rap of China (a hit show with 3BN views in 2017) made a +245% return (490M RMB profit).
Ad revenues are a large part of this. For example, a single 60sec ad in The Rap of China season finale sold for RMB 45M.
A 30-second ad in the 2018 Super Bowl cost $5M, or just a 40% premium ($10M for 60s vs. ~$7.1M USD).
The largest sponsor was Nongfu Spring (beverage/water brand), which spent $18M (120M RMB) for the entire season. This is
high, but affordable comparable to traditional TV, where prices can run 4x that.
“But one of the biggest beneficiaries of the show has undoubtedly been the New York clothing brand Supreme, which Wu, the show's star,
wears. On search engine Baidu, queries about Supreme are up about 170% this summer compared with the same period last year, according to
Kantar Media CIC. That's just a stroke of luck for the Supreme brand: IQiyi says it's not a product placement.” – AdAge, “Rapper’s
Delight: China’s Hip-Hop Talent Showcase Boosts Brands”
Not every show is this profitable (obviously), but it gives an idea of iQiyi’s influence and reach.
iQiyi’s “advertising as content” (see link below for example) concept allowed Hot-Blood Dance Crew to pull in record-
breaking 650M RMB (~$100M USD) in sponsorships alone.
Rap of China – Unit Economics Rap of China Commercial (“Ads-As-Content”)
In millions of RMB Absolut Vodka commercial, original themed song performed by ROC contestants
Rap of China (English subtitles LINK (requires some navigating), Go to Episode 10 - part 2, min 44:55 – 46:07)
Newl y Acqui red Cus tomers 8.0
x Subs cri pti on Pri ce per Month ¥16.0
x Attri buta bl e Months 3
= Subs cri pti on Revenue ¥384.0
+ Adverti s i ng Reveues 306
= Tota l Revenues ¥690.0
- Producti on Cos t 200
= Profit on Rap of China ¥490.0
memo: Return on Investment 245.0%
memo: Number of Episodes 12
memo: Cost per Episode ¥16.7
Fred Liu, CFA | 646-883-8805 | fred.liu@haydencapital.com 23Using Netflix As A Case Study
Netflix isn’t an exact comp (they don’t sell advertisements). But it’s useful for understanding how IQ’s economics may roughly
develop over time. If we use Netflix as a case study for potential pricing power, using the figures below, it implies $0.22 rev per
hour watched for NFLX vs. just $0.03 for iQiyi.
Even if we adjust for disposable income / GDP per capita, this is a 84% premium (admittedly very rough calc).
Although iQiyi has negative margins today, we see no reason it can’t achieve Netflix’s ~12.5% EBITDA Margin.
Traditional US Media distributors (CBS, TWX, VIAB, etc) all have margins between 20% - 30% too.
So how do you close the gap? For example, we broke down iQiyi’s revenues generated per hour from Paid users vs. Free Users:
Our analysis indicates free users generate only 1/10th the revenues of paid subscribers… a key driver for revenues, is
converting them to paid subscriptions.
We fully expect this to happen, as 1) people get into the habit of paying for subscriptions like in the US, and 2) as industry
competition dissipates.
At TechNet, management stated that ARPU will increase when they feel there’s ample quantity and quality of content.
Their goal is 70% paying sub penetration. On average, each member actually has ~1.5 accounts, and pays for
7mo/yr (vs. 2mo/yr in 2016). It’s significant, as Chinese users are cost-conscious, and historically pay only when a
hit show comes out, then cancel after. We think this up-tick indicates changing habits, and higher customer value.
IQ vs. Netflix – Revenue per Hour Watched iQiyi Potential Pricing Power – GDP adjusted
Figures for the avg user (both paid & free) In $
iQiyi Revenue / Hour Watched GDP Adjusted Pricing
2016 2017 2018E 2019E 2020E 2021E Chi na GDP per Ca pi ta (Ti er 1-2 ci ti es ) $ 14,500
Tota l Hours Wa tched 94,572 109,537 126,551 167,263 199,296 233,060
/ Tota l Revenues 11,237 17,378 25,091 38,995 54,783 76,613 / US GDP per Ca pi ta $ 57,500
= Tota l Revenue per Hour Wa tched ¥0.12 ¥0.16 ¥0.20 ¥0.23 ¥0.27 ¥0.33
= Di fference 25.2%
/ RMB to USD Convers i on 6.45 6.45 6.45 6.45 6.45 6.45
= Rev per Hour Watched (USD) $ 0.02 $ 0.02 $ 0.03 $ 0.04 $ 0.04 $ 0.05 x NFLX Revenue per hour wa tched $ 0.22
= IQ "GDP adjusted" Rev per Hour $ 0.06
Netflix Revenue / Hour Watched / IQ Current Rev per Hour 0.03
Hours Wa tched per Week 1,000
x 52 Weeks 52
= Potential Incremental Pricing Power 84.3%
= Tota l Hours Wa tched i n 2017 52,000 memo: China GDP per Capita - Growth Y/Y 6.1%
2017 Revenue 11,685
/ Tota l Hours Wa tched 52,000
= Rev / Hour Watched $ 0.22
Fred Liu, CFA | 646-883-8805 | fred.liu@haydencapital.com 24Path To Break-even – Sights on 2021
iQiyi is barely gross profitable, and has -22% operating margins today. What are the levers IQ can pull to turn this around?
1) Converting Free Users to Paid Subscribers
If iQiyi can grow paid users to ~35% of total users (vs. just ~15% today), they would be immediately profitable.
Rev/hour for paid subscribers (RMB 0.62 / $0.10) is ~6.5x higher than for free users (RMB 0.10 / $0.016), but this is
narrowing. Paid subscribers are watching more hours per user (a sign of growing customer value), so rev/hour is trending
down. At the same time, advertisers are paying more per commercial as the user base grows, so free user rev/hour is
going up. We expect the gap to narrow to ~4.2x for 2018E.
2) Increasing Monthly Price, as GDP per Capita rises + the industry matures (discussed on previous slide).
3) Advertisers spending more on commercials, thus driving up free user revenues per hour.
Advertisers currently pay RMB 0.08/hour in 2017, vs. just RMB 0.06/hour in 2016. Going forward, we expect a high
growth rate to continue, growing to RMB 0.16/hour in 2020E, for a 26% CAGR.
This growth is likely, since online video advertising costs are still 20-50% below rates for traditional TV.
The key for all of this is exclusive content. It’s what drives up barriers for the industry, creates pricing power & customer value,
and generates differentiation among the platforms. As mentioned before, iQiyi is starting with mid-tier, niche content, and
moving up-market as its production quality rises.
iQiyi Revenues per Hour – Paid vs. Free Users EBITDA per Hour of Viewership (2015) – US Networks
In RMB per hour watched In $ per hour watched; from Credit Suisse
Paid User Revs per Hour
2016 2017 2018E CAGR '16-'18E
Members hi p Servi ces 3,762 6,536 10,935 190.6%
/ Hours Wa tched by Subs cri pti on Us ers 4,771 10,530 22,626 374.3%
= Rev per Hour Watched - Subscription Users ¥0.79 ¥0.62 ¥0.48 (38.7)%
memo: Rev / Hr - Free Users ¥0.06 ¥0.10 ¥0.11
memo: Rev / Hr - Difference 12.1x 6.5x 4.2x
Fred Liu, CFA | 646-883-8805 | fred.liu@haydencapital.com 25Subscriber Economics & Incremental ROICs
Subscriber LTV Model In terms of “Incremental ROIC,” one of iQiyi’s largest investment projects is
Inputs 2017
acquiring paid subscribers.
Our Subscriber Model estimates iQiyi gets returns as high as a 55% IRR.
Paid Subs
Number of Subs cri bers 50.8 Customer acquisition cost of RMB ~317, with each sub generating RMB
Annua l Subs cri pti on Revenue/ Subs cri ber ¥161.38
161 in revenue per year (which doesn’t even include mid-roll ad revenue),
Free Subs and RMB 143 in operating income per year per sub.
Number of Subs cri bers 380.8
Annua l Revenue/ Subs cri ber ¥21.43 Incremental margins are very high at 88%. This will only increase over time as
Allocated Costs (Annual)
content cost is largely fixed, and iQiyi produces more original content (there’s no
Technol ogy & Devel opment Cos t 1,270 revenue share deals for self-produced content).
Content Cos t per Us er (Exi s ti ng) ¥29.95
Percenta ge of Content Cos ts Attri buted to New Sub 25.0% Free Users
Year 0 1 2 3 4 5 6 7 8 9 10
Ba ndwi dth Cos t per Us er ¥5.20
Sa l es Ta x, Surcha rge & Other Cos ts per Us er ¥6.12 Re te nti on Ra te 100.0% 80.0% 80.0% 80.0% 80.0% 80.0% 80.0% 80.0% 80.0% 80.0% 80.0%
Sa l e s pe r Fre e Us e r ¥21.4 ¥22.7 ¥24.1 ¥25.5 ¥27.0 ¥28.7 ¥30.4 ¥32.2 ¥34.1 ¥36.2 ¥38.4
- I ncre me nta l Cos t pe r Fre e Us e r 18.8 19.2 19.6 20.0 20.4 20.8 21.2 21.6 22.0 22.5 22.9
Customer Acq. Cost = Op Income per Free User ¥2.6 ¥3.5 ¥4.5 ¥5.6 ¥6.7 ¥7.9 ¥9.2 ¥10.6 ¥12.1 ¥13.7 ¥15.4
Sel l i ng & Ma rketi ng 2,217 x Re ma i ni ng Accounts 100.0% 80.0% 64.0% 51.2% 41.0% 32.8% 26.2% 21.0% 16.8% 13.4% 10.7%
= Wgt. Op Income per Acct Created ¥2.6 ¥2.8 ¥2.9 ¥2.8 ¥2.7 ¥2.6 ¥2.4 ¥2.2 ¥2.0 ¥1.8 ¥1.7
+ Incrementa l Content Cos t 4,315
x Di s count Ra te 1.0x 1.1x 1.2x 1.3x 1.5x 1.6x 1.8x 1.9x 2.1x 2.4x 2.6x
= Tota l CAC 6,532 = PV of Cash Flows ¥2.6 ¥2.6 ¥2.4 ¥2.1 ¥1.9 ¥1.6 ¥1.4 ¥1.1 ¥0.9 ¥0.8 ¥0.6
/ New Pa i d Us ers 21 memo: Wgt. Yearly Sales per Acct Created ¥21 ¥18 ¥15 ¥13 ¥11 ¥9 ¥8 ¥7 ¥6 ¥5 ¥4
memo: Cummulative Sales Per Acct Created ¥21 ¥40 ¥55 ¥68 ¥79 ¥89 ¥97 ¥103 ¥109 ¥114 ¥118
= CAC per User ¥317
memo: Cummulative Op. Income Per Acct Created ¥3 ¥5 ¥8 ¥11 ¥14 ¥17 ¥19 ¥21 ¥23 ¥25 ¥27
% of Incrementa l Content Cos t Al l oca ted to Attra ct New Subs 85.0%
Paid Subscribers
Annua l Churn Ra te 20.0%
Year 0 1 2 3 4 5 6 7 8 9 10
Growth ra te i n Subs cri pti on Cha rge 6.0%
Growth ra te i n Servi ce Cos t/Subs cri ber 2.0% Re te nti on Ra te 100.0% 80.0% 80.0% 80.0% 80.0% 80.0% 80.0% 80.0% 80.0% 80.0% 80.0%
Sa l e s pe r Pa i d Sub ¥161.4 ¥171.1 ¥181.3 ¥192.2 ¥203.7 ¥216.0 ¥228.9 ¥242.7 ¥257.2 ¥272.7 ¥289.0
Cos t of Ca pi ta l 10.0%
- I ncre me nta l Cos t pe r Pa i d Sub 18.8 19.2 19.6 20.0 20.4 20.8 21.2 21.6 22.0 22.5 22.9
= Op Income per Paid Sub ¥142.6 ¥151.9 ¥161.8 ¥172.3 ¥183.4 ¥195.2 ¥207.7 ¥221.1 ¥235.2 ¥250.2 ¥266.1
- Cus tome r Acq Cos t 317.1 - - - - - - - - - -
= Cash Flow per Paid Sub ¥-174.5 ¥151.9 ¥161.8 ¥172.3 ¥183.4 ¥195.2 ¥207.7 ¥221.1 ¥235.2 ¥250.2 ¥266.1
Margin on Incremental Paid Subscriber - Year 0
x Re ma i ni ng Accounts 100.0% 80.0% 64.0% 51.2% 41.0% 32.8% 26.2% 21.0% 16.8% 13.4% 10.7%
Revenue per Pa i d Sub ¥161.38 = Wgt. Cash Flow per Acct Created ¥-174.5 ¥121.5 ¥103.5 ¥88.2 ¥75.1 ¥64.0 ¥54.5 ¥46.4 ¥39.5 ¥33.6 ¥28.6
- Al l oca ted Content Cos t 7.49 x Di s count Ra te 1.0x 1.1x 1.2x 1.3x 1.5x 1.6x 1.8x 1.9x 2.1x 2.4x 2.6x
= PV of Cash Flows ¥-174.5 ¥110.5 ¥85.6 ¥66.3 ¥51.3 ¥39.7 ¥30.7 ¥23.8 ¥18.4 ¥14.2 ¥11.0
= Gros s Profi t ¥153.90
memo: Wgt. Yearly Sales per Acct Created ¥161 ¥137 ¥116 ¥98 ¥83 ¥71 ¥60 ¥51 ¥43 ¥37 ¥31
- Ba ndwi dth Cos t 5.20 memo: Cummulative Sales Per Acct Created ¥161 ¥298 ¥414 ¥513 ¥596 ¥667 ¥727 ¥778 ¥821 ¥858 ¥889
- Sa l es Ta xes , Surcha rge, & Other (pa s s -thru pa i d by s ub) 6.12 memo: Cummulative Op. Income Per Acct Created ¥-174 ¥-53 ¥51 ¥139 ¥214 ¥278 ¥332 ¥379 ¥418 ¥452 ¥480
= Operating Profit ¥142.58
Paid Sub IRR 54.6%
memo: Incremental Operating Margin 88.3%
Fred Liu, CFA | 646-883-8805 | fred.liu@haydencapital.com 26Having the Right Friends
Why did JD.com recently partner with iQiyi, instead of QQ Video, when Tencent owns 20% of JD? On the surface, it seems
like betrayal…
Reading between the lines, we believe it all comes down to the differences in iQiyi vs. QQ Video’s cohorts.
iQiyi skews younger (42% under 24yrs), more urban (54% in Tier 1 & 2 cities), and female (56%, which JD has been
trying to heavily court, given women make more purchasing decisions, and JD has historically skewed male).
JD Plus (paid membership, similar to Amazon Prime) hadWe’ve Seen This Story Before
It’s only a matter of time before the industry matures (usually when there aren’t anymore “un-tapped” user segments left), and
industry margins rationalize. The “playbook” is typically as follows:
Step 1: The “land-grab” phase. Sign up as many users, as quickly as possible – with promos, free products, even giving
away money (red envelopes) etc. The only goal is to get as many users addicted and in the habit of using your product as
possible, before competitors get to them.
Typically dozens of start-ups will compete to be one of the top 3 surviving players. The key is to find a way to
acquire customers cheaply, and have lots of cash. As this phase ends, smaller players seeing the writing on the wall,
will merge with the top players to boost their market share.
Step 2: “Monetization”. Once the market becomes saturated and everyone has their “loyal users”, there’s typically 2-3 top
players left with ~90% share.
In the early phases, there’s still intense competition and price cutting among the top 3, as they try to “pick off ”
marginal users from their competitors. But as the industry market share “firms up”, the focus becomes on
rationalizing the business model & profitability. The goal is conversion of the large free user base, to paying users.
We believe the online video industry is in this phase, transitioning between the “early” to “later” stages.
There are signs this “maturation” is happening. For example, in China the cost for famous talent is very high (LINK).
~60 - 70% of a show’s budget typically goes toward actor/actress salaries.
In order to reign in content costs, iQiyi, Tencent, Youku recently signed a joint agreement, to limit “unreasonable
exorbitant remuneration” for high-profile stars (a textbook example of bargaining power over suppliers; LINK).
We’re confident the industry will rationalize, especially since many of the VCs / backers, are the same ones who supported other
famous Chinese “Tech Wars”: Ctrip vs. Qunar, Bike Sharing (Ofo vs. Mobike vs. HelloBike), e-commerce, and many more.
We suggest studying these case-studies, to understand how margins inflected after rationalization.
“What people from outside of China don’t realize is that there is a period of rapid growth with lots of money being poured into a category. And then after the first
three years, typically only two to three category leaders emerge. In e-commerce, you have Alibaba and JD.com. In ride-sharing, there’s Didi. In bike-sharing, you have
three right now – Mobike, Ofo, and Hello-Bike.” – Hans Tung (GGV Capital), LINK
Fred Liu, CFA | 646-883-8805 | fred.liu@haydencapital.com 28Foreign Company + Unprofitable + Fear of Anything Chinese = Broken IPO
We believe IQ’s stock performance immediately after the IPO was indicative of a lack of interest in China Tech
Foreign Company: Many investors buying the IPO probably had never even used the product.
By comparison, I spent over 20 hours watching the entire season of Rap of China for “Research”. For example, many IQ
shareholders we’ve spoken to have never even downloaded the app on their phones.
+ Unprofitable: It’s very early stage, and isn’t even gross profitable.
We think due to reasons laid out above, this will change over time – especially due to the high incremental margins per
subscriber. However, this lack of profitability likely deterred those who didn’t do as much work.
+ Fear of Anything Chinese: “China Hustle” (documentary about Chinese reverse merger frauds) had just come out the week
before (3/23 Release Date vs. 3/29 IPO date). White House Trade War rhetoric was also heating up with China at that time.
= Broken IPO: The result was shares immediately trading down -15% from it’s IPO price over the following days.
IQ Trading History - 1 Month After IPO
IPO’d on March 29th, chart from stockcharts.com
IPO’d at $18
Hayden purchased on March 29,
almost our entire 2018
position here (an
avg price of ~$17),
over the following
two weeks.
Fred Liu, CFA | 646-883-8805 | fred.liu@haydencapital.com 29This Is What Happened In The Next Two Months…
In the next ~2.5 months, the stock price rose +170% as investors started understanding the company better, sell-side research
started coverage (leading to more informed investors), and people recognizing / getting excited about the valuation discount vs.
peers.
For example, IQ was trading at 2.7x Sales (2018E) vs. NFLX at 7.5x Sales (2018E) after the IPO.
Recently, it’s trading at 7.5x Sales (2018E) vs. NFLX at 10.7x Sales (2018E).
Sell-side expects NFLX to grow top-line from $16BN to $34BN from 2018-22 (27.5% CAGR). By comparison, the street
expects IQ to grow from $3.8BN to $9BN from 2018-22 (33% CAGR).
Note; iQiyi’s business model isn’t directly comparable to Netflix. In fact, they have publicly stated they view themselves more in-line with an
“online Disney” (i.e. IP-centric).
IQ Trading History – Since IPO
IPO’d on March 29th, chart from stockcharts.com
Fred Liu, CFA | 646-883-8805 | fred.liu@haydencapital.com 30WARNING!
There’s a lot of details and nitty-gritty, KPI-style analysis that wasn’t able to make it into this deck
(15min is too short!). Thus this presentation is very high-level, intended simply to give a taste of
what’s happening in China Tech.
As with everything China related, it’s a much more dynamic and nuanced ecosystem, than you can get
from a cursory glance. It’s for this reason, I don’t disclose our full thinking on valuation either.
This is a case study, not a recommendation (our initial purchase was also lower at ~$17).
Deep due-diligence isn’t just a suggestion… it’s a requirement.
Fred Liu, CFA | 646-883-8805 | fred.liu@haydencapital.com 31Having Said That… You Can’t Ignore China
Of the Top 20 Internet Companies, 25% of the value comes from Chinese Tech companies… and this share is growing rapidly.
Even if you don’t invest directly, it’s beneficial to understand what’s happening there, and what the new business models look
like.
Sooner or later, Chinese companies will be coming to a country near you. (I’m sure many European retailers thought
Amazon was a distinctly “American Problem” ten years ago too).
Examples of this include Alipay in the US & Canada (Chinese companies spreading globally), and the Dock-less Bike / E-
Scooter trend (Limebike, Bird, etc) which began in China (new Chinese business models spreading to the West).
Top 20 Internet Companies, By Valuation For Example, Alipay Is Already Here
As of May 2018 Alipay launches in Canada & US (picture of Vancouver Airport / NYC Taxi)
Source: Kleiner Perkins 2018 Internet Trends, Hillhouse Capital, Goldman Sachs, iResearch
Fred Liu, CFA | 646-883-8805 | fred.liu@haydencapital.com 32But Haven’t You Watched “The China Hustle”?…
I’m sure some of you are sitting out there, saying “Aren’t all Chinese companies frauds? What about the VIE structure?”
Sure, it’s not a 0% risk, but there are some mitigating factors (it’s all about incentives)…
1. China is launching its CDR (Chinese Depository Receipts) program this summer. The idea is to allow the large tech
companies to “return home” and dual-list domestically. Most importantly for western investors, the guidelines call for the
exact same legal structure as the ADRs. Given this, there’s less incentive for China to do anything shady with the VIE
structure, and harm their own citizen investors in the meantime. (More information found here, LINK)
2. These are $30BN+ market cap companies vs. the average reverse merger fraud was only $125M in market cap. These
tech companies are the “pride & joy” of the Chinese government, and a symbol of China’s new level of innovation
(hence why the government wants to bring them back domestically). Any large deception would be a stain to the entire
country’s credibility and damage the country’s access to capital, which the government is unlikely to allow to happen.
3. Just go to China and see for yourself. With the reverse mergers, the factories never existed at all. On the other hand, see
if you can walk 100ft without bumping into someone who watches iQiyi videos on their phones, or a courier carrying
Jingdong or Alibaba packages.
Investors Are Afraid of This… …Causing Them To Miss Out On This
The China Hustle Documentary (2018) JD Warehouse, Rap of China Los Angeles Audition, iQiyi App
There’s a BIG difference here…
Just hop on a plane to see for yourself.
Fred Liu, CFA | 646-883-8805 | fred.liu@haydencapital.com 33If There’s One Takeaway It’s:
There’s Some Interesting Things Going On In China Tech…
So Investors, Pay Attention!
Fred Liu, CFA | 646-883-8805 | fred.liu@haydencapital.com 34Contact Information
For More Information
Contact Us:
Fred Liu
Managing Partner
Hayden Capital
79 Madison Ave, 3rd Floor
New York, NY. 10016
Office: (646) 883-8805
Mobile: (513) 304-3313
Email: fred.liu@haydencapital.com
Fred Liu, CFA | 646-883-8805 | fred.liu@haydencapital.com 35You can also read