INVESTOR OVERVIEW Post Fourth Quarter 2019 - One of North America's largest electric utilities - Hydro One
←
→
Page content transcription
If your browser does not render page correctly, please read the page content below

INVESTOR OVERVIEW
                                     Post Fourth Quarter 2019

One of North America’s largest electric utilities               TSX:H
WHY INVEST IN HYDRO ONE
A unique low-risk opportunity to participate in the transformation of a premium, large scale regulated electric utility

•   One of the largest electric utilities in North America with significant scale and leadership position across
    Canada’s most populated province.
                                                                                                                                                                          ~5%
                                                                                                                                                                            ~5%       Rate Base Growth
•   One of the strongest investment grade balance sheets in the North American utility sector.
•   Unique combination of pure-play electric power transmission and local distribution, with no generation or
    material exposure to commodity prices.
•   Stable and growing cash flows with 99% of business fully rate-regulated in a constructive, transparent and                                                                         EPS Growth Over
                                                                                                                                                                             ~5%
                                                                                                                                                                          4-7%
    collaborative regulatory environment.                                                                                                                                                2019 - 2022

•   Predictable self-funding organic growth profile with expanding rate base and strong cash flows, together
    with broad support for refurbishment of aging infrastructure and with ~5% expected five year rate base
    CAGR1. No external equity required to fund planned growth.                                                                                                                         Average Annual
                                                                                                                                                                          ~5%
                                                                                                                                                                            ~5%
                                                                                                                                                                                       Dividend Growth
•   Increased $0.966 annualized dividend with 70% - 80% target payout ratio.
•   Opportunity for continued dividend growth with rate base expansion, continued consolidation and
    efficiency realization.

                                                                                                      Hydro One’s Role in the Ontario Electric Power System

            Generation Stations                     Transformer Stations                 Transmission Lines                  Distribution Stations   Distribution Lines        Delivery to Your Home or Business   23
                                                                                                                                                                                                                        2
       1)    Further information on Rate Base Growth, Average Annual EPS Growth, and Average Annual Dividend Growth can be found on slide 15
       2)    Compound Annual Growth Rate (CAGR)
RECENT DEVELOPMENTS
Organization Priorities
Fourth Quarter Highlights
•   Fourth quarter earnings per share (EPS) was $0.35 and adjusted EPS was $0.35, compared to a loss per share of $1.18 and adjusted EPS of $0.30, respectively, for
    the same period in 2018. For the full year, EPS was $1.30 and adjusted EPS was $1.54. Adjusted EPS was 14.1% higher than adjusted EPS of $1.35 in 2018.
•   Annual productivity savings of $202 million represent a 49.1% increase year-over-year. Total productivity savings since 2015 amount to over $450 million.
•   Strong project execution led to annual capital investments of $1.67 billion, which was an increase of 5.8% from last year and in-line with the plans put forward to
    the OEB.
•   Continued improvement of customer satisfaction, with Residential and Small Business satisfaction scores increasing by 9.3% year over year.
•   Allowed regulated return-on-equity (ROE) set to 8.52% for the transmission business under the Custom Incentive Rate-setting mechanism.
•   Credit rating agencies took positive rating action, with S&P Global Ratings revising its ratings outlook on Hydro One and Hydro One Inc. to stable from negative,
    and Moody’s Investors Service upgrading the rating on Hydro One Inc. to A3 (stable) from Baa1 (stable).
•   The OEB affirmed its decision with respect to the recovery of the revenue requirement associated with pension costs; the Company will discontinue its appeal
    before the Ontario Divisional Court.
•   Canadian Electricity Association (CEA) recognized Hydro One under the Sustainable Electricity Program for Hydro One’s commitment to continuous improvement
    for Indigenous procurement.
•   Edison Electric Institute (EEI) awarded Hydro One for its efforts to help restore power in Manitoba following a severe storm that caused widespread outages. This
    is the 10th award Hydro One has received from the EEI for demonstrating its industry-leading expertise in storm restoration.
•   Hydro One was recognized for the 5th consecutive year as one of Canada’s Best Employers for 2020 by Forbes.
•   Leadership team bolstered with the appointment of David Lebeter as Chief Operating Officer and Darlene Bradley as Chief Safety Officer.
•   Quarterly dividend declared at $0.2415 per share, payable March 31, 2020.

                                                                                                                                                   3
                                                                                                                                                        3                 3
THE VALUE OF HYDRO ONE
     ABOUT THE COMPANY                                                                                                    HOW WE DID IN 2019                                             WHY INVEST
     Transmission & Distribution                                                                                                                                                            Stable Operations
                                                                                                                    Transmission         Distribution      Other
                   ~30,000 circuit KM’s of transmission lines                                                                                                                     Stable and growing cash flows with
                                                                                           Revenue Net of Purchased Power                                   Total Assets
                                                                                                                   1%                                                             99% of overall business fully rate-
                                                                                                                                                                                  regulated
                                                                                                                                                                7%
                     Largest Local Distribution Company in
                                                                                                                                                                                  No generation or material
                     Ontario with approximately 1.4 million
                                                                                                                                                                                  exposure to commodity prices
                     customers                                                                                             49%                                     $27.1B
                                                                                                       50%     $3,369M                                    37%
                                                                                                                                                                            56%

                    Combined 2019 Transmission & Distribution                                                                                                                         Financial Performance
                    Rate Base of $20.7B2

                    Market Capitalization of ~$15.01 billion                                                                                                                      Predictable self-funding organic
                                                                                                         Regulated EBIT                                  Capital Investments      growth profile with ~5% expected
                                                                                                                                                                    1%            five year rate base CAGR

     Regulated and Privatized Operations                                                                                                                  37%
                                                                                                       44%                                                                        Attractive 70% - 80% target
                                                                                                               $1,493M                                          $1,667M
                   99% of revenue from regulated operations                                                                56%                                                    dividend payout ratio
                                                                                                                                                                            62%
                                                                                                                                     Rate Base                                    Annualized dividend of $0.966 per
                                                                                                                                                                                  share
                    Privatization initiative by Province of Ontario
                    to divest majority stake in Hydro One
                    complete with post November 2015 IPO
                    (15%), April 2016 secondary (15%), and May                                                                     39%                                            Strong balance sheet with
                    2017 secondary (20%) offerings                                                                                        $20.7B                                  investment grade credit ratings
                                                                                                                                                   61%

1)    Based on closing share price on December 31st, 2019                                                                                                                                                               4
2)    Company estimates subject to change and include amounts from March 2019 filed transmission rate application which
      is subject to OEB approval                                                                                                                                                                                            4
A LOOK AT THE ORGANIZATION
Corporate Structure

                                                   Public Company                                           TSX: H
                                                                                        Hydro One Limited

    Public Debt Issuer
                                            Hydro One Inc.

              Hydro One Networks Inc.                             Hydro One Remote Communities Inc.                  Hydro One Telecom Inc.

                              Rate-Regulated Businesses (99% of revenue)                                             Non-Rate-Regulated Business

                                                                                                                                              5
                                                                                                                                                   7   5
EXECUTIVE LEADERSHIP TEAM
A leadership team with strong operational experience committed to achieving efficiencies at Hydro One

                                                                               Mark Poweska
                                                                              President and CEO

      Brad Bowness            Darlene Bradley        Jason Fitzsimmons          Paul Harricks           David Lebeter              Chris Lopez          Saylor Millitz-Lee
 Chief Information Officer   Chief Safety Officer   Chief Corporate Affairs   Chief Legal Officer   Chief Operating Officer   Chief Financial Officer     Chief Human
                                                    & Customer Care Officer                                                                             Resources Officer

                                                                                                                                                                             6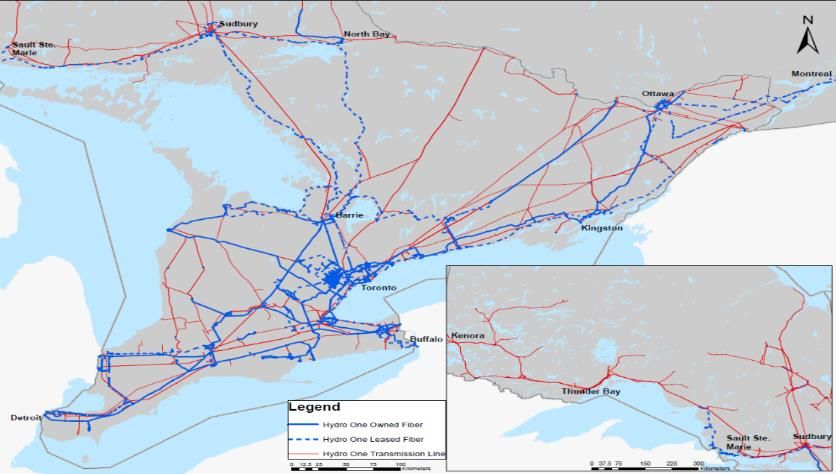
HYDRO ONE’S NEW STRATEGY
                       Plan, design and build a                     Be the safest and most                     Be a trusted partner              Advocate for our customers               Innovate and grow the
Strategic Priorities

                          grid for the future                           efficient utility                                                           and help them make                          business
                                                                                                                                                     informed decisions

                       We will plan, design and build a            We will transform and improve our        We will make concerted efforts to    We will make it easier to do business   We will continue to invest
                       reliable grid taking into account           safety culture through robust safety     build and grow relationships with    with Hydro One by strengthening         responsibly in our core transmission
                       changing technologies to prevent            analytics as well as grass-roots         Indigenous peoples, government       the customer experience through         and distribution business.
                       future outages.                             engagement with our employees.           and industry partners.               innovative customer centric
                                                                                                                                                 practices.                              In addition, we will pursue
                       There will be increased focus on grid       Field operations will be more            We will proactively address                                                  incremental regulated and
 Areas of Focus

                       resilience in order to restore power        empowered to drive efficiency,           community concerns and establish     We will help our customers make         unregulated business opportunities
                       after events. Climate change and
                                                                   productivity and reliability and         strong partnerships with our         informed decisions with deeper          through innovation and our focused
                       sustainability factors will be taken into
                                                                   provided with efficient corporate        customers through local investment   insights and leverage our position as   presence in Ontario.
                       consideration in our planning
                                                                   support.                                 and economic development for the     energy experts. We will expand
                       processes to increase resilience and
                       lower our environmental footprint.                                                   benefit of Ontarians.                access to energy offerings to
                                                                   There will be a focus on efficient                                            become the provider of choice to
                       We will incorporate distributed energy      capital delivery to support an                                                our customers.
                       resources to enable customer choice         ongoing growing work program.
                       while delivering exceptional value to
                       customers through best-in-class asset
                       management practices.

                                                                        A people focus that inspires employees and prepares the right workforce for evolving needs
Enablers

                                                                                                   A regulatory focus to support our strategic vision

                                                                                                 A technology focus to enhance workforce efficiency
                                                                                                                                                                                                                                7
HYDRO ONE’S NEW STRATEGY
An Ontario focus, and plan to enhance value

         Strategic Priorities                                                         Business Outcomes

       Plan, design and build a grid for
                  the future                                      Improved safety culture where Hydro One employees
                                                                            go home safely every single day

       Be the safest and most efficient
                    utility
                                                                    Improved reliability above average performance of
                                                                                    Canadian utilities
             Be a trusted partner                                                                                                                               Enhance Shareholder
                                                                                                                                                                      Value
    Advocate for our customers and help                                  High satisfaction for Hydro One customers
      them make informed decisions

       Innovate and grow the business                                     Sustainable business practices and lower
                                                                                  environmental footprint

 "The roll out of our corporate strategy will involve sticking to our strengths and continuing to champion for our customers and the electricity sector in Ontario. Our main focus has been and will remain
 operational excellence as we continue to drive performance. We are a leader in Ontario and continue to build relationships with all partners in our region. We are taking a focused lens on creating a
 brighter, sustainable future for Ontarians, and are steadfast in improving the safety, reliability, affordability, and environmental impacts of our operations.”

 -Mark Poweska, President and Chief Executive Officer
                                                                                                                                                                                                              8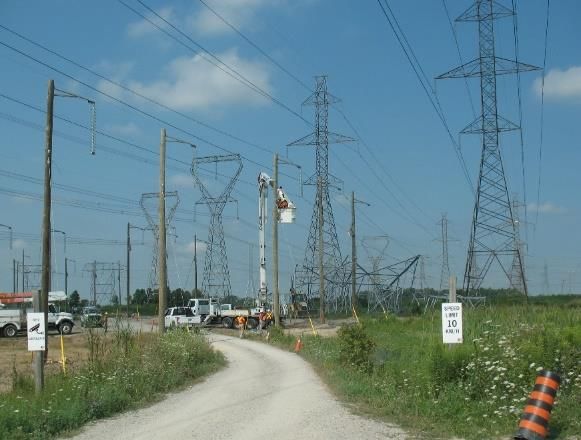
ACHIEVEMENTS AND EFFICIENCIES
  Paving New Paths in Productivity Savings ($M)
2019                                                                202.3
                                                                                                             Generated productivity savings of $202.3 million in 2019 comprised of
                                                                                                             $84.6 million in OM&A and $117.7 million in capital and totaling a
2018                                              135.5                                                      nearly half a billion dollars since 2015

                                                                                          $452.2
2017                                 89.5

                                                                                                                            Move to Mobile transformed work processes and implemented
2016            24.9
                                                                                                                            technology that automated the scheduling & dispatching functions

                                      Capital   OM&A
                                                                                                                            Strategic sourcing initiatives led to price reduction for materials and
          High Customer Satisfaction (%)                     Reducing the Fleet by 10%                                      services as a result of consolidating spend across Hydro One and
                                                                                                                            increasing competition among vendors
                                                           8,010
                               90
                  86                   87
                                                                        7,189           7,106       6,995
           77
                                                                                                                            Hydro One leveraged telematics data to identify underutilized fleet
                                                                                                                            equipment causing a reduction of fleet size by 10%

                                                                                                                            Optimal Cycle Protocol (OCP) is a state-of-the-art vegetation
                                                                                                                            management program that was implemented in October 2017. OCP
                                                                                                                            will shorten tree clearing and trimming cycle to 3 years from 10 years

       Residential & Small    Transmission                YE 2016      YE 2017      YE 2018        YE 2019
            Business
                       2018   2019                         On-Roads         Off-Roads     Other Equipment

                                                                                                                                                    9                                                 9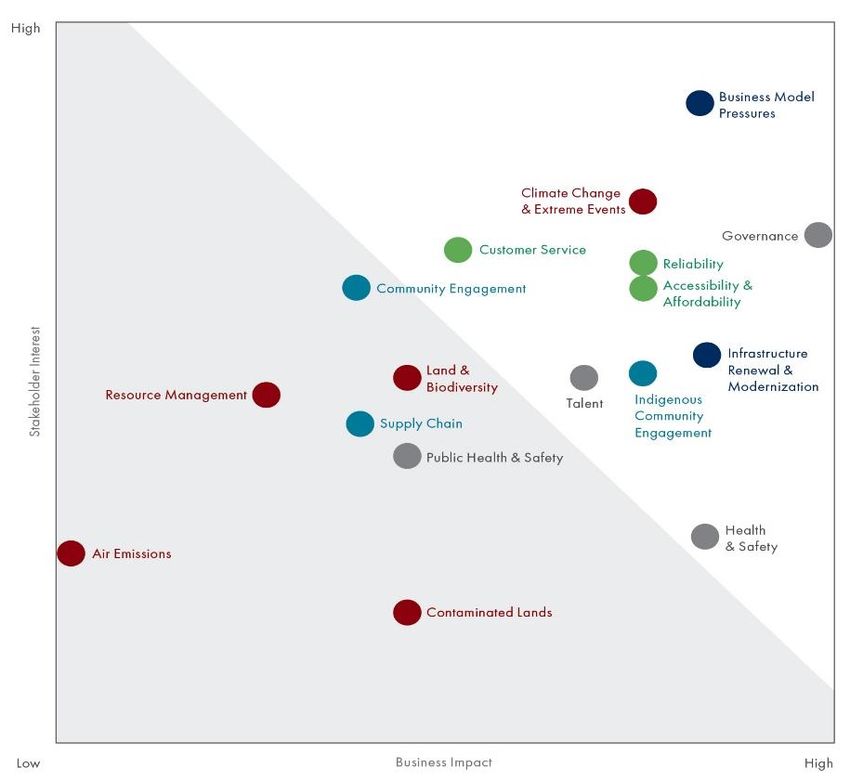
THE REGULATED BUSINESS
Transmission & Distribution
                                                 Transmission

        98%          OF ONTARIO’S TRANSMISSION
                     CAPACITY1
                                                 • Hydro One has filed a 3-year Custom IR application for Transmission from 2020-2022                        LDC Customers       38

                                                 • Hydro One owns and operates 98% of Ontario’s transmission capacity1
                                                                                                                                                    Large Directly Connected
                                                                                                                                                        Industrial Customers
                                                                                                                                                                                 83
                                                 • Transmission produces reliable cash flow with low volatility under Ontario Energy Board (OEB)
                                                 • Growing rate base with planned annual capital investments of ~$1,100 - $1,400 million over             Transmission Lines
                                                                                                                                                                                ~30,000
                                                   next five years                                                                                              (Circuit KM)

                                                 • Emerging industries and system requirements helping drive expansion of transmission network
                                                                                                                                                     Transmission Stations In    309
                                                 • 2018 allowed ROE of 9.00% with 40% / 60% deemed equity/debt capital structure. 2019 rates                         Service

                                                   are inflationary and grew 1.4% from 2018 base Revenue Requirement

                                                 Distribution
                                                                                                                                                          LDC’s Consolidated     ~90
                                                                                                                                                                  Since 2000
                                                 • Distribution is a stable, rate-regulated business operating under OEB Custom IR framework
                                                                                                                                                           Distribution Lines
                                                 • Growing rate base with planned annual capital investments of ~$650 - $800 over next five years                (Circuit KM)
                                                                                                                                                                                ~123,000

                                                 • Allowed ROE of 9.00% with 40% / 60% deemed equity/debt capital structure through application              Distribution End
                                                                                                                                                                   Customers     ~1.4M
                                                 • OEB decision in place transitioning residential distribution rates to fully fixed
                                                                                                                                                            Distribution and
                                                 • Drivers of growth include rate base expansion, productivity improvements and continued                 Regulating Stations    ~1,000
                                                   consolidation of other LDC’s
        75%          GEOGRAPHY OF PROVINCE
                     SERVED BY DISTRIBUTION
                                                 • Haldimand, Woodstock, Norfolk LDC acquisitions grew customer base by ~5%

   1)   Based on revenue approved by the OEB
                                                                                                                                                                                           10
GROWTH OPPORTUNITIES FOR THE TELECOM BUSINESS
FOCUS ON VALUE-ADDED SERVICES
Managed & Managed & Professional Telecommunications Services: Outsourced consultative and operative processes and
functions that simplify operations and reduce expenses by leveraging the knowledge and resources of industry experts
Professional • Telecommunications Consulting and Digital Transformation Journey Mapping
Telecommunications • Legacy and Hybrid Technology Integration
Services • Network Engineering
Hydro One Telecom Client Value Exchange
Cloud Services: Outsourced platforms, applications and storage pools.
• Secure SD-WAN
Cloud Services • Backup-as-a-Service (BaaS)
• Infrastructure-as-a-Service (IaaS)
• Managed Security Services and Unified Communications
Telecommunications Operations Services: Outsourced operational services that leverage highly specific
expertise, resources and manpower to simplify operations and reduce operating expenses
Telecommunications • Network Operations-as-a-Service (NOS)
Operations Services • Field Operations-as-a-Service (FOS)
• Equipment Spares Management and Network Planning
The Market
Core Telecommunication Services: Network connectivity and access in order to improve the efficiency and security • Core connectivity revenues declining; a shift towards cloud connectivity,
of Client data telecommunications managed services & security-based services with increasing bandwidth
Core Broadband • High Performance Network Broadband Connectivity demand
Services • Internet Transit • Canadian telecom market is approx. $49B (2017) – Enterprise and
• Data Centre access Wholesale segments represent nearly $17B of the addressable market with
• Microwave Tower space leasing Ontario 43% of the national total
Hydro One Telecom Services Historical Future
Fibre connectivity Historical Hydro One Telecom
Internet transit Leveraged Hydro One Network fibre assets to provide secure, low latency broadband connectivity in
Data center connectivity and tower space leasing to ISPs Ontario extending to Montreal with connections into Buffalo and Detroit
and other Telcos, Public Sector & Enterprise accounts
Security Future Hydro One Telecom
Cloud connectivity Pivot HOTI from a sole focus on commoditized connectivity to a solutions company responding to
Data backup and recovery market demand for new services and increasing bandwidth. Differentiate HOTI from traditional service
Professional services across all verticals providers through an excellent client experience
11 and responsiveness, offering choice and value
11 11SUSTAINABILITY AT HYDRO ONE
Hydro One conducted a formal materiality assessment to identify the sustainability issues that matter most to our business,
stakeholders and partners
Approach to Sustainability A Matrix of 10 Material Issues Identified1 A Sustainable Future for All
We focused on developing the groundwork to build a 50% Board of Directors diversity (Independent Non-Executive)
successful sustainability program through the
completion of a detailed materiality assessment. $1.7 billion in capital investments to expand electricity grid and renew
and modernize existing infrastructure
Selected by the Canadian Council for Aboriginal Business as an
Indigenous Procurement Champion
$41.3 million Total procurement spending with Indigenous businesses –
our highest ever spend
104 First Nations communities served by Hydro One Networks Inc. and
Hydro One Remote Communities Inc.
$2.8 million In sponsorships and donations in communities where we
live and work
Designated as a Sustainable Electricity Company by the Canadian
Electricity Association
Recognized as one of the Best 50 Corporate Citizens in Canada by
Corporate Knights
(1) Material issues identified are found in the top right unshaded corner of Matrix
12DELIVERING CLEAN AND SUSTAINABLE ENERGY
Transmitting and delivering some of the cleanest energy in North America
• Ontario was the first North American jurisdiction to fully eliminate coal electricity generation
and leads Canada in wind and solar capacity
• Recent five year Ontario Climate Change Action Plan will further accelerate province’s
leadership in reduction of greenhouse gas emissions
• One of only seven utilities in Canada to achieve the Sustainable Energy Company designation
from the Canadian Electrical Association
• Ontario electricity now generated by: nuclear 58%, hydro 24%, natural gas 6%, wind 8%, solar 2%, other 2%
• Hydro One recognized as one of the Best 50 Corporate Citizens in Canada by Corporate Knights in 2019
• Environmental stewards of thousands of kilometers of transmission grid corridor lands, including management of vegetation for habitat
preservation and protection of species at risk
• ISO 14001 Compatible Environmental Management System to identify and proactively manage environmental risks for continual
improvement
• Greener Choices program actively engages employees in sustainability improvement efforts for energy efficiency, recycling and waste
reduction at work
13
22 13$10B OF CAPITAL INVESTMENT DRIVING
RATE BASE GROWTH
Consistent and predictable organic growth profile underpinned by required replacement of aging
infrastructure
Projected Regulated Capital Investments* ($M) Projected Rate Base Growth*
$26,250
$25,091
$2,116 $2,130 $23,792
$1,973 $1,991 $22,676
$1,870 $21,613
$734 $750
$666 $632
$689
$1,307 $1,359 $1,382 $1,380
$1,181
2020 2021 2022 2023 2024 2020 2021 2022 2023 2024
* Company estimates subject to change and include amounts from 2018-2022 Approved Distribution Rate Order, 2019
Transmission Distribution Transmission inflationary filing, and 2020-2022 Transmission filing which is subject to OEB approval
Comments
• Organic growth underpinned by continued rate base expansion to renew and modernize grid
• Material amounts of deteriorated, end-of-service life infrastructure must be upgraded or replaced
• Little concentration risk as most projects within capex envelope are small to medium relative to total
• Investments not undertaken without reasonable expectation of regulatory recovery
• Equity issuance not anticipated for planned capital investment program which is self-funded
14
142022 GUIDANCE
$1.65
$1.52
$0.02
$1.35
$1.30 $0.11 $0.24
$0.08
$0.02
2019 Basic EPS 2018 Distribution Normalizing to Insurance Merger Related Costs Lake Superior Link 2019 Normalized EPS Blank 2022 Basic EPS
Decision Catch-Up Distribution Allowed
ROE
• Company estimates subject to change and include amounts from 2018-2022 Approved Distribution Rate Order, 2019 Transmission inflationary filing, and 2020-2022 Transmission filing which is subject to OEB approval
• Growth rates included in this slide are dependent upon approval of 2020 Transmission filing as currently filed
• The forward-looking information in this presentation is based on a variety of factors and assumptions, as described in the financial statements and management’s discussion and analysis. Actual results may differ materially
from those predicted by such forward-looking information.
15INFRASTRUCTURE INVESTMENTS
Leamington Area Transmission Integrated System Operating
Niagara Reinforcement Project Reinforcement Centre Richview Transmission Station
Estimated Total Project Cost: $135 million Estimated Total Project Cost: $325 million Estimated Total Project Cost: ~$150 million Estimated Total Project Cost: $115 million
Capital Cost To Date: Completed Capital Cost To Date: $2 million Capital Cost To Date: Not Started Capital Cost To Date: $109 million
Anticipated In-Service Date: 20191 Anticipated In-Service Date: 2026 Anticipated In-Service Date: 2021 Anticipated In-Service Date: 2021
The Niagara Reinforcement Project was The Leamington Area Transmission Integrated System Operating Centre Replacement of 50 year old end-of-life
placed in-service in August 2019. Reinforcement project consists of the (ISOC), will accommodate the following equipment at Richview Transformer
construction of a new double-circuit line functions: Primary Transmission and Station to ensure the secure and reliable
between Chatham and Leamington and Distribution Operating, power supply to the City of Toronto and
associated transmission stations and Telecommunication Management Centre; surrounding communities
connections. The project is currently in Security Operations; and general back
the development stage. office
1) The Niagara Reinforcement Project was placed in-service in August 2019. Total costs include $119 million for the construction of a new 230 kV transmission line (Niagara Line), as well as $16 million for costs relating to other assets, including stations. In September 2019, the Niagara Line
assets were transferred from Hydro One Networks to Niagara Reinforcement Limited Partnership.
16CONSTRUCTIVE RATE REGULATOR (OEB)
Consistent, independent regulator with a transparent rate-setting process
• Transmission and Distribution businesses rate-regulated by the Ontario Energy Board (OEB)
• Deemed debt / equity ratio of 60% / 40% for both transmission and distribution segments
• Reduced regulatory lag through forward-looking test years, revenue decoupling and adjustment mechanisms
• Received a decision for distribution rates under the OEB’s Custom Incentive Rate Making model on March 7, 2019 for 2018 – 2022 (5-year term)
• Received a decision for transmission rates under the OEB’s Incentive Rate Making model on April 25, 2019 for 2019 rates
• Filed a 3-year transmission application under the OEB’s Custom Incentive Rate Making model on March 21, 2019 for 2020 – 2022 (3-year term)
Current rate Allowed Expected Effective term of
methodology ROE rate base1,3 next application Comments
2019 2019 One-year inflationary adjustment to transmission revenue requirement
Transmission Inflationary 2020-22 for 2019. On March 21, 2019, Hydro One filed a 3-year Custom Incentive
8.98%4 $12.6 billion Rate (CIR) application for the 2020-2022 period.
Current rate Allowed Expected Effective term of
methodology ROE rate base2,3 application Comments
2019 2019 Custom incentive rates. Decision for 2018-2022 distribution rates
Distribution Custom IR 2018-22 received. 2020 annual update approved in Q4 of 2019 to reflect the
9.00% $8.1 billion latest inflation assumptions.
19
(1) Transmission rate base includes 100% of B2M LP, Niagara Reinforcement Partnership and Hydro One Sault Ste. Marie
(2) Distribution Rate Base includes recent LDC acquisitions and Hydro One Remote Communities 17
(3) Company estimates subject to change and include amounts from March 2019 filed transmission rate application which is subject to OEB approval
(4) Allowed ROE for Transmission in 2019 will update to 8.52% when a decision is received on the 2020-2022 transmission rate applicationSEGMENTED INCENTIVE REGULATORY CONSTRUCT
The transition from cost of service to incentive based regulatory model coincident with transformation
of business will create value for both customers and shareholders
Distribution Transmission
OEB Approved Subject to OEB Approval
2018-2022 2020-2022
Rebasing Year 2018 2020
Custom Revenue Cap Index (RCI) by Component (%) Custom Revenue Cap Index (RCI) by Component (%)
(A) Inflation Adjustment Factor5 (A) Inflation Adjustment Factor5
(B) Less: Productivity Stretch Factor Offset (B) Less: Productivity Stretch Factor Offset
(C) Add: Capital Factor (C) Add: Capital Factor
(D) Equals: Custom Revenue Cap Index Total (D) Equals: Custom Revenue Cap Index Total
Revenue Requirement
Determined By1,2,3:
2019 2020 2021 2022 20194 2020 2021 2022
(A) 1.50% 2.00% 1.50% 1.50% (A) 1.40% 1.80% 1.80%
2020 revenues
(B) (0.45%) (0.45%) (0.45%) (0.45%) (B) 0.00% determined 0.00% 0.00%
though an
(C) 1.65% 1.21% 1.95% 1.85% (C) application 3.25% 3.77%
process
(D) 2.70% 2.76% 3.00% 2.90% (D) 1.40% 5.05% 5.57%
Earnings Sharing Method 50% of earnings that exceed allowed ROE by more than 100 basis points in any year of the term of the filing shared with customers
Allowed ROE 9.00% through test years (2018-2022) 8.52% through test years (2020-2022)
May 1, 2019 for 2019 Rates
Effective Rate Setting May 1, 2018
January 1 for respective rates 2020-2022
(1) Source: Distribution RCI as filed in Hydro One’s Draft Rate Order dated April 2019, as updated in the 2020 Annual Update dated August 2019.
(2) Source: Transmission RCI in 2020-2022 Rate Application. Update as part of the Oral Hearing Undertaking Responses and provided on November 2019.
(3) Source: Distribution RCI for 2020 based on annual update dated November 2019.
(4) 2019 Transmission Inflationary Application as approved April 2019.
(5) Inflation Adjustment Factor is updated annually for Transmission and Distribution. 20 18REDUCING OUR CUSTOMER BILLS
Since 2017, Hydro One customer bills have decreased on average from $165 to $127 per month
Pre-Fair Hydro Plan Post Ontario Energy
2017 Monthly Bill- $165 Rebate
2020 Monthly Bill- $127
$8
$90
$38 % of Bill2
Taxes and OCEB 16%
Electricity Charges 56%
$6
$52 $9
Regulatory 2%
Transmission 7%
Distribution 20%
2017 Distribution 2017 Transmission 2017 Regulatory 2017 Electricity 2017 Sales Tax & Reductions in Bill 2020 Customer Bill
Costs Costs Charges Charges OCEB through 2020
Pre-Fair Hydro Plan Post Ontario Energy Rebate
$179
$165 CAGR CAGR
$157
2006-2017 2006-2020
$141 $149
$136 Taxes and OCEB
$123
$129 $122 $125 $127 1.0% 10.1%
$108 $101 $111
$104 Electricity &
Energy Charges 6.6% 3.0%
other charges
Regulatory (5.4%) (10.4%)
Transmission 1.4% 0.1%
Hydro One’s
Portion
Distribution 3.0% (3.3%)
2006 2007 2008 2009 2010 2011 2012 2013 2014 2015 2016 2017 2018 2019 2020
Annual changes to
(4.0%) (2.5%) 9.6% 10.8% 5.5% 4.8% 3.6% 5.9% 5.6% 13.9% (7.7%) (26.3%) 2.4% 1.5%
customer bill
Note: The charts represent the breakdown of a typical bill for a Hydro One medium-density residential local distribution end customer using 750 kWh a month. Subject to update upon effective rate setting. 19
1) OCEB is an abbreviation for the Ontario Clean Energy Benefit
2) Bill composition total to more than 100% due to roundingSTRONG BALANCE SHEET AND LIQUIDITY
Investment grade balance sheet with one of lowest debt costs in utility sector
Significant Available Liquidity ($M) Strong Investment Grade Credit Ratings (LT/ST/Outlook) Shelf Registrations
250
Hydro One Limited Hydro One Inc. (HOI)
Hydro One Inc. HOL:
Universal Shelf3: $4.0B
S&P A- / A-1 (low) / stable1
2,300
1,143 DBRS A (high) / R-1 (low) / stable HOI:
Medium Term Note
Undrawn Credit Facilities Short-Term Notes Shelf4:
Payable
Moody’s A32 / Prime-2 / stable $4.0B
900 Debt Maturity Schedule ($M) Weighted average cost of long-term debt: 4.2%
800 Weighted average term (years): 15.7
700 Debt to Capitalization5: 56.3%
600 FFO to Net Debt6: 12.2%
500
400
300
200
100
0
2020
2021
2022
2023
2024
2025
2026
2027
2028
2029
2030
2031
2032
2033
2034
2035
2036
2037
2038
2039
2040
2041
2042
2043
2044
2045
2046
2047
2048
2049
2050
2051
2052
2053
2054
2055
2056
2057
2058
2059
2060
2061
2062
2063
2064
(1) On November 8, 2019, S&P affirmed Hydro One Limited’s issuer credit rating and Hydro One Inc.’s issuer and issue-level credit ratings and revised its ratings outlook on Hydro One Limited and Hydro One Inc. to stable from negative, based on expectations that Hydro One Limited’s operating environment has stabilized and that
the company will focus on regulated operations in Ontario, without expansions outside Ontario.
(2) On November 20, 2019, Moody’s Investors Service (Moody’s) upgraded Hydro One Inc.’s rating to A3 (stable), from Baa1 (stable). The upgrade reflects Moody’s view of an increased probability of extraordinary support from the provincial government due to the company’s exclusive focus on business in Ontario for at least the
next 5 years.
(3) The Universal Base Shelf Prospectus allows Hydro One to offer, from time to time in one or more public offerings, up to $4.0 billion of debt, equity or other securities, or any combination thereof, during the 25-month period ending on July 18, 2020. At December 31, 2019, no securities have been issued under the Universal Base
Shelf Prospectus. Hydro One Limited filed the Universal Base Shelf Prospectus to provide the Company with financing flexibility going forward.
20
(4) At December 31, 2019, $2.9 billion was drawn from the Medium Term Note (MTN) Shelf, leaving $1.1 billion available for issuance until April 2020. A new MTN prospectus is expected to be filed in the first half of 2020.
(5) Debt to capitalization ratio has been calculated as total net debt (includes total long-term debt and short-term borrowings, net of cash and cash equivalents) divided by total debt plus total shareholders’ equity, including preferred shares but excluding any amounts related to noncontrolling interest.
(6) FFO to Net Debt for the last twelve months ending Q4 2019 has not been adjusted for one-time costs related to the termination of the Avista Corporation acquisition in Q1 2019.
20EQUITY MARKET CAP OVERVIEW
Approximate Ownership of Public Float Equity Index Inclusions Approximate Geographic Dispersion of Public Float
S&P/TSX Composite FTSE All-World
Index (Canada)
23% 24%
Canada
MSCI World (Canada) S&P/TSX Composite
Low Volatility Index
49% US
Dow Jones Canada S&P/TSX Utilities Index Rest of
Select Utilities World
77% 27%
Institutional
S&P/TSX Composite S&P/TSX Composite
Retail
Dividend Index High Dividend Index
Comments
• ~597 million common shares outstanding, listed on
Toronto Stock Exchange (TSX: H)
• Equity market capitalization of ~$15.0 billion1 and
public float of ~$7.9 billion
• Equity market capitalization amongst the top 60 of
all listed Canadian companies
21
15 21
(1) Based on closing share price on December 31st, 2019COMMON SHARE DIVIDENDS
Consecutive annual 5% increase announced on May 9th, 2019
Key Points
Dividend Statistics
• Quarterly dividend declared at $0.2415 per common
share ($0.966 annualized)
Yield1 3.9%
• Targeted dividend payout ratio remains at 70% - 80% of
net income
Annualized Dividend2,3 $0.966 / share
• Attractive and growing dividend supported by stable,
regulated cash flows and planned rate base growth
Expected Quarterly Dividend Dates3
• No equity issuance anticipated to fund planned five year
Declaration Date Record Date Payment Date
capital investment program
February 11, 2020 March 11, 2020 March 31, 2020 • Non-dilutive dividend reinvestment plan (DRIP) was
implemented post IPO (shares purchased on open
May 7, 2020 June 10, 2020 June 30, 2020
market, not issued from treasury)
August 10, 2020 September 9, 2020 September 30, 2020
November 5, 2020 December 9, 2020 December 31, 2020
(1) Based on closing share price on December 31st, 2019 22
(2) Unless indicated otherwise, all common share dividends are designated as "eligible" dividends for the purpose of the
Income Tax Act (Canada)
16 22
(3) All dividend declarations and related dates are subject to Board approval.APPENDIX
24 23HYDRO ONE LIMITED
4Q19 FINANCIAL SUMMARY
Fourth Quarter Year End
(millions of dollars, except EPS) 2019 2018 % Change 2019 2018 % Change
Revenue
Transmission $407 $342 19.0% $1,652 $1,686 (2.0%)
Distribution 1,298 1,138 14.1% 4,788 4,422 8.3%
Distribution (Net of Purchased Power) 384 397 (3.3%) 1,677 1,523 10.1%
Other 10 11 (9.1%) 40 42 (4.8%)
Consolidated 1,715 1,491 15.0% 6,480 6,150 5.4%
Consolidated (Net of Purchased Power) $801 $750 6.8% $3,369 $3,251 3.6%
OM&A Costs 239 308 (22.4%) 1,181 1,105 6.9%
Earnings Before Financing Charges and Income Taxes (EBIT)
Transmission 228 114 100.0% 835 842 (0.8%)
Distribution 117 129 (9.3%) 658 526 25.1%
Other (8) (18) - (183) (59) -
Consolidated 336 225 49.3% 1,310 1,309 0.1%
1
Net Income (Loss) 211 (705) - 778 (89) -
1,2
Adjusted Net Income (Loss) 211 176 19.9% 918 807 13.8%
Basic EPS $0.35 ($1.18) - $1.30 ($0.15) -
1
Basic Adjusted EPS $0.35 $0.30 16.7% $1.54 $1.35 14.1%
Capital Investments 562 467 20.3% 1,667 1,575 5.8%
Assets Placed In-Service
Transmission 573 698 (17.9%) 1,082 1,164 (7.0%)
Distribution 271 253 7.1% 602 642 (6.2%)
Other 5 1 - 19 7 -
Consolidated 849 952 (10.8%) 1,703 1,813 (6.1%)
Financial Statements reported under U.S. GAAP 24
(1) Net Income is attributable to common shareholders and is after non-controlling interest, dividends to preferred shareholders,
(2) Adjusted Net Income excludes items related to the Avista Corporation acquisition and the impact related to the OEB’s deferred tax asset decision on HONI’s Distribution and Transmission businesses
25 24TOP TRANSMISSION CAPITAL PROJECTS UNDERWAY
Anticipated Estimated Capital Cost
Development Project Name Location Type
In-Service Date Cost To-Date
Niagara Reinforcement Project Niagara area New transmission line 20191 $135 million $135 million
Southwestern Ontario
Wataynikaneyap Power LP Line Pickle Lake New stations and transmission 2021 $23 million $1 million
Connection Northwestern Ontario connection
East-West Tie Station Expansion Northern Ontario New transmission connection 20222 $157 million $62 million
and station expansion
Waasigan Transmission Line Thunder Bay-Atikokan-Dryden New transmission line 20243 $35 million $3 million
Northwestern Ontario
Leamington Area Transmission Leamington New transmission line 20264 $325 million $2 million
Reinforcement Southwestern Ontario and stations
Anticipated Estimated Capital Cost
Sustainment Project Name Location Type
In-Service Date Cost To-Date
Richview Transmission Station Toronto Station sustainment 2021 $115 million $109 million
Circuit Breaker Replacement Southwestern Ontario
Bruce A Transmission Station Tiverton Station sustainment 2021 $147 million $133 million
Southwestern Ontario
Beck #2 Transmission Station Niagara area Station sustainment 2023 $135 million $77 million
Circuit Breaker Replacement Southwestern Ontario
Lennox Transmission Station Napanee Station sustainment 2024 $116 million $78 million
Circuit Breaker Replacement Southeastern Ontario
Middleport Transmission Station Circuit Middleport Station sustainment 2025 $116 million5 $36 million
oBreaker Replacement Southwestern Ontario
(1) The Niagara Reinforcement Project was placed in-service in August 2019. See section Regulation - Niagara Reinforcement Limited Partnership for additional information.
(2) The majority of the East-West Tie Station Expansion project is expected to be placed in-service in 2021, enabling the connection and energization of the new East-West Tie transmission line. Additional work to complete the upgrades is expected to be placed in-service in 2022.
(3) The in-service date and the costs of the Waasigan Transmission Line project (formerly known as Northwest Bulk Transmission Line Development project) relate to the development phase.
(4) The Leamington Area Transmission Reinforcement project consists of the construction of a new double-circuit line between Chatham and Leamington and associated transmission stations and connections. The project is currently in the development stage. The anticipated in-
service dates for the line and stations are between 2020 and 2026, and the total estimated cost is in the range of $290 million to $325 million, with approximately $249 million of the total estimated cost included in the projected capital investments 25
(5) Approximately $76 million of the total estimated cost is included in the projected capital investments 26 25REGULATORY STAKEHOLDERS
Who: Provincial Government, Ministry of Energy
What: Policy, legislation, regulations
Who: Ontario Energy Board (OEB)
What: Independent electric utility price and service quality regulation
Who: Independent Electricity System Operator
What: Wholesale power market rules, intermediary, North American reliability standards
Who: Canadian Energy Regulator
What: Federal regulator, international power lines and substations
Who: North American Electric Reliability Corporation
What: Continent-wide bulk power reliability standards, certification, monitoring
Who: Northeast Power Coordinating Council
What: Northeastern North American grid reliability, standards, compliance
26INDEPENDENT BOARD OF DIRECTORS
Timothy Hodgson, MBA, FCPA, ICD.D Jessica McDonald, ICD.D
Corporate Director, Chair of Hydro One Ltd, Chair of Sagicor Financial Corporation Limited, Director Public Corporate Director, Chair, Canada Post Corporation, Former President & CEO BC Hydro & Power
Sector Pension Investment Board (PSP Investments), Director Alignvest Acquisition II Corporation, retired Authority, Director Coeur Mining Inc., Chair Trevali Mining Corporation, Member Council of Sustainable
Managing Partner Alignvest Management Corporation, Former Special Advisor to Bank of Canada Development Technology Canada
Governor Mark Carney, Former CEO Goldman Sachs Canada,
Cherie Brant, JD Russel Robertson, FCPA, FCA, ICD.D
Partner, Borden Ladner Gervais LLP, Director Anishnawbe Health Foundation, Member Canadian Council Corporate Director, Former EVP and Head, Anti-Money Laundering, BMO Financial Group, Former Vice-
for Aboriginal Business, Research Advisory Board, Aboriginal Energy Working Group-IESO Chair, Deloitte & Touche LLP, Director Bausch Health Companies Inc., Director Turquoise Hill Resources
Blair Cowper-Smith, LLM, ICD.D William Sheffield, BSC, MBA, ICD.D
Principal and founder Erin Park Business Solutions, Former Chief Corporate Affairs Officer OMERS Corporate Director, Former CEO Sappi Fine Papers, Director Houston Wire & Cable Company, Director
Velan Inc., Former Board Member OPG
Anne Giardini, O.C., O.B.C, Q.C, LLM Melissa Sonberg, BSC, MHA, ICD.D
Chancellor, Simon Fraser University, Former Canadian President Weyerhaeuser Company Limited, Former Adjunct Professor and Executive-in- Residence, McGill University, Desautel Faculty of Management,
Director Nevsun Resources LTD Director Exchange Income Corporation, Former Senior Vice President, Human Resources & Corporate
Affairs and Senior Vice President, Global Brands, Communications and External Affairs at AIMIA.
David Hay, LLB, ICD.D Susan Wolburgh Jenah J.D., ICD.D
Managing Director Delgatie Incorporated, Former CEO New Brunswick Power Corporation, Former Vice- Corporate Director, Director Laurentian Bank, Director Aecon Group Inc, and Humber River Hospital.
Chair and Managing Director of CIBC World Markets Inc., Director EPCOR, Council Member of the Council Governor of the Financial Industry Regulatory Authority (FINRA), and member of the Independent Review
for Clean and Reliable Energy Committee of Vanguard Investments Canada.
Mark Poweska1
President and CEO of Hydro One Ltd, Former Executive Vice President, Operations at BC Hydro, Director
and Chair of the Operations Committee of the Western Energy Institute, Board Advisor to Yukon Energy
Corporation
27
(1) Mark Poweska is an Executive Board Member
27 27DISCLAIMERS
DISCLAIMERS
In this presentation, all amounts are in Canadian dollars, unless otherwise indicated. Any graphs, tables or other information in this presentation demonstrating the historical performance of the
Company or any other entity contained in this presentation are intended only to illustrate past performance of such entitles and are not necessarily indicative of future performance of Hydro One. In
this presentation, “Hydro One” refers to Hydro One Limited and its subsidiaries and other investments, taken together as a whole.
Forward-Looking Information
This presentation contains “forward-looking information” within the meaning of applicable Canadian securities laws. Forward-looking information in this presentation is based on current
expectations, estimates, forecasts and projections about Hydro One’s business and the industry in which Hydro One operates and includes beliefs of and assumptions made by management. Such
statements include, but are not limited to: statements about Hydro One’s strategy, areas of focus and anticipated outcomes; statements regarding ongoing and planned projects and initiatives,
including anticipated timing and impacts; statements about consolidation; statements relating to our sustainability initiatives; statements related to dividends; statements regarding future equity
issuances; expectations regarding planned or expected capital investments; statements related to regulatory models, rate applications, anticipated regulatory decisions and impacts; discontinuance
of Hydro One’s appeal of the OEB’s decision with respect to recovery of revenue requirement associated with pension costs; statements related to the Universal Shelf and the Medium Term Note
Shelf; statements related to credit ratings; statements related to the Ontario Climate Change Action Plan; statements about growth relating to both the regulated and unregulated businesses,
creation of value and efficiency realization; and statements and projections regarding rate base, cash flows, and borrowings.
Words such as “aim”, “could”, “would”, “expect”, “anticipate”, “intend”, “attempt”, “may”, “plan”, “will”, “believe”, “seek”, “estimate”, “goal”, “target”, and variations of such words and similar
expressions are intended to identify such forward-looking information. These statements are not guarantees of future performance and involve assumptions and risks and uncertainties that are
difficult to predict. Therefore, actual outcomes and results may differ materially from what is expressed, implied or forecasted in such forward-looking information. Hydro One does not intend, and it
disclaims any obligation to update any forward-looking information, except as required by law.
The forward-looking information in this presentation is based on a variety of factors and assumptions, as described in the financial statements and management’s discussion and analysis. Actual
results may differ materially from those predicted by such forward-looking information. While Hydro One does not know what impact any of these differences may have, Hydro One’s business,
results of operations and financial condition may be materially adversely affected if any such differences occur. Factors that could cause actual results or outcomes to differ materially from the
results expressed or implied by forward-looking information are described in the financial statements and management’s discussion and analysis.
Non-GAAP Measures
Hydro One prepares and presents its financial statements in accordance with U.S. GAAP. “Funds from Operations” or “FFO”, “Adjusted Net Income”, “Revenue Net of Purchased Power” and
“Adjusted Earnings Per Share” are not recognized measures under U.S. GAAP and do not have standardized meanings prescribed by U.S. GAAP. These are therefore unlikely to be comparable to
similar measures presented by other companies. Funds from Operations should not be considered in isolation nor as a substitute for analysis of Hydro One’s financial information reported under U.S.
GAAP. “Funds from Operations” or “FFO” is defined as net cash from operating activities, adjusted for the following: (i) changes in non-cash balances related to operations, (ii) dividends paid on
preferred shares, and (iii) non-controlling interest distributions. Management believes that these measures will be helpful as a supplemental measure of the Company’s operating cash flows and
earnings. For more information, see “Non-GAAP Measures” in Hydro One’s 2019 full year MD&A.
28
28 28CONTACT
Omar Javed
Vice President, Investor Relations
ojaved@HydroOne.com
(416) 345-5943
HydroOne.com/InvestorRelations
29
29 29You can also read