INVESTOR OVERVIEW Post Third Quarter 2018 - Hydro One
←
→
Page content transcription
If your browser does not render page correctly, please read the page content below
INVESTOR OVERVIEW Post Third Quarter 2018

AGENDA
                                    •     Business Update
                                    •     Company Overview
                                    •     Regulatory Framework
                                    •     Appendix

Investor Overview – Post Third Quarter 2018                      2
BUSINESS UPDATE
RECENT DEVELOPMENTS
     Organization Priorities
     • Hydro One and Avista mutually agree to terminate merger agreement.
     • As required by the merger agreement, Hydro One will pay Avista a US$103 million termination fee as a result of the termination of the
       merger agreement.
     • Favourable weather coupled with continued efficiencies in operation, maintenance and administrative (OM&A) costs led to earnings per
       share (EPS) of $0.33 and adjusted EPS of $0.38, compared to $0.37 and $0.40, respectively, in the prior year when regulatory catch-up
       revenues and a lower effective tax rate had previously boosted earnings.

     • Following Hydro One’s Motion to Review and Vary regarding a 2017 deferred tax asset ruling, the Ontario Energy Board (OEB) granted
       the motion and the matter will now return back to the OEB for further consideration.

     • Hydro One announced an agreement to acquire the business and distribution assets of Peterborough Distribution Inc. (Peterborough
       Distribution) and that it has submitted a new application to the OEB to acquire Orillia Power Distribution Corporation (Orillia Power). The
       Company also successfully reached the operational integration of Hydro One Sault Ste. Marie LP (HOSSM) into Hydro One Networks Inc.
     • A survey of residential and small business customers reveals satisfaction at 76%, up 5% and the highest in five years. When combined
       with a survey of transmission customer satisfaction scoring a highest-ever 90% earlier this year, it demonstrates a consistent, company-
       wide dedication to customer service.
     • A significant wind and rain storm resulted in power outages to more than 500,000 customers and a tornado caused extensive damage to
       the company’s Merivale transmission station near Ottawa. While power to all customers was restored quickly, repairs are ongoing at the
       damaged station.

     • Distribution service reliability has improved over previous years and is better than forecasted, with year-over-year improvements in
       both outage frequency and duration due to a multi-faceted strategy to improve performance.
     • Following the announcement of a new, ten-member Board of Directors on August 14, Tom Woods was appointed its new Chair. Chris
       Lopez, previously Senior Vice President of Finance, was appointed Acting Chief Financial Officer. Paul Dobson continues in his role as
       Acting President and Chief Executive Officer (CEO).
     • Transmission rate application for 2019 filed with the OEB, seeking an increase close to inflation.

     • Quarterly dividend declared at $0.23 per share, payable December 31, 2018.
Investor Overview – Post Third Quarter 2018                                                                                                          4
COMPANY OVERVIEW
THE VALUE OF HYDRO ONE
 ABOUT THE COMPANY                                                                            HOW WE DID IN 2017                                                                                 WHY INVEST
                                                                                           Transmission            Distribution          Other
 Transmission & Distribution                                                                                                                                                                       Stable Operations
                                                                                                     1%
                  30,000 circuit KM’s of transmission                                                                Revenue Net of
                                                                                                                     Purchased Power                                                           Stable and growing cash flows
                  lines across 98% of Ontario                                                                                                                                                  with 99% of overall business fully
                                                                                                                                                                                               rate-regulated
                                                                                        48% $3,115M 51%
                    Largest Local Distribution Company in
                                                                                                                                                                                               No generation or material
                    Ontario with over 1.3 million end                                                                                  11%
                                                                                                                                                                                               exposure to commodity prices
                    customers

                                                                                                         Total Assets                     $25.7B       53%
                                                                                                                                36%
                  Expected combined 2018 Transmission
                  & Distribution Rate Base of $19.7B1                                                                                                                                      Financial Performance
                  Market Capitalization of ~$11.72 billion                                                                                                                                     Predictable self-funding organic
                                                                                         39%                                                                                                   growth profile with ~5% expected
                                                                                                 $1,291M                  Regulated EBIT                                                       five year rate base CAGR
                                                                                                               61%
 Regulated and Privatized                                                                                                                    1%
 Operations                                                                                                                                                                                    Attractive 70% - 80% target
                  99% of revenue from regulated                                                                                                                                                dividend payout ratio
                  operations                                                                                   Capital 37%
                                                                                                          Investments      $1,567M                                                             Recently increased annualized
                                                                                                                                                       62%                                     dividend of $0.92 per share
                  Privatization initiative by Province of
                  Ontario to divest majority stake in Hydro
                  One complete with post November 2015
                  IPO (15%), April 2016 secondary (15%),                                40%                                                                                                    Strong balance sheet with
                  and May 2017 secondary (20%) offerings                                          $18.6B                                                                                       investment grade credit ratings
                                                                                                               60%
                                                                                                                      Rate Base

Investor Overview – Post Third Quarter 2018                                                                                                                                                                                         6
1)   Company estimates subject to change and include amounts from March 2017 filed distribution rate application and 2019 transmission inflationary filing which are subject to OEB approval
2)   Based on closing share price on September 28th, 2018
EXECUTIVE LEADERSHIP TEAM
     A leadership team with demonstrated experience transforming organizations and
     growing shareholder value.

                                                                          Paul Dobson
                                                                    Acting President and CEO

Jason Fitzsimmons                   Greg Kiraly             Chris Lopez             Judy McKellar       Patrick Meneley        Jamie Scarlett
Chief Corporate Affairs       Chief Operating Officer           Acting             EVP, Chief Human    EVP, Chief Corporate   Chief Legal Officer
& Customer Care Officer                                 Chief Financial Officer    Resources Officer   Development Officer

   Investor Overview – Post Third Quarter 2018                                                                                                      7
A LOOK AT THE ORGANIZATION
Corporate Structure
Public Company TSX: H
Hydro One Limited
Public Debt Issuer Hydro One Inc.
Hydro One Remote
Hydro One Networks Inc. Hydro One Telecom Inc.
Communities Inc.
Rate-Regulated Businesses (99% of revenue) Non-Rate-Regulated Business
Our Role in the Electricity Grid
Our transmission and distribution system safely
and reliably serves communities throughout
Ontario. Our customers are suburban, rural and
remote homes and businesses across our
province.
We proudly own and operate over C$25 billion in
assets and have annual revenues of nearly C$6
billion.
Investor Overview – Post Third Quarter 2018 8PURPOSE, VALUES & STRATEGY Investor Overview – Post Third Quarter 2018 9
ACHIEVEMENTS AND EFFICIENCIES
  Paving New Paths in Productivity Savings ($M)                                                        • Generated productivity savings totaling
                                                                                                         $89.5 million in 2017 ($43.6 million in
   2017                                                                  89.5                            OM&A and $45.9 million in capital)
                                                                                           $114.4M     • Move to Mobile transformed work
   2016                         24.9                                                                     processes and implemented technology that
                                                                                                         automated the scheduling & dispatching
                                                                                                         functions
                                        Capital         OM&A
                                                                                                       • Strategic sourcing initiatives led to price
   Improving Customer Satisfaction (%) Reducing the Fleet by 10%                                         reduction for materials and services as a
                                                   88
                                                                 8,010                                   result of consolidating spend across Hydro
                        78
                                                                                      7,189              One and increasing competition among
                                       71                                                                vendors
            66
                                                                                                       • Hydro One leveraged telematics data to
                                                                                                         identified underutilized fleet equipment
                                                                                                         causing a reduction of fleet size by 10%

                                                                                                       • Optimal Cycle Protocol (OPC) is a state-of-
                                                                                                         the-art vegetation management program
                                                                                                         that was implemented in October 2017.
                                                                                                         OCP will shorten tree clearing and trimming
                                                                                                         cycle to 3 years from 8-10 years
                 2016                       2017                  2016                 2017

                 Distribution      Transmission                On-road          Off-road       Other

Investor Overview – Post Third Quarter 2018                                                                                                         10
THE REGULATED BUSINESS
Transmission & Distribution
Transmission
• Hydro One owns and operating 98% of Ontario’s transmission capacity
LDC Customers
• Transmission produces reliable cash flow with low volatility under 43
Ontario Energy Board (OEB) cost of service regulation and will transition
to incentive rate making under OEB Large Directly Connected
Industrial Customers 88
• Growing rate base with planned annual capital investments of ~$1,000 -
$1,500 million through 2022 with focus on refurbishing aging assets Transmission Lines
(Circuit KM) 30,000
• Continued shift to renewable and distributed generation sources helping
drive expansion of transmission network
Transmission Stations In
• 2018 allowed ROE of 9.00% with 40% / 60% deemed equity / debt capital Service 308
structure
One of North America’s largest electric
Cross Boarder
transmission providers Interconnections 25
Distribution
• Distribution is a stable, rate-regulated business operating under OEB cost of LDC’s Consolidated
Since 2000 90
service framework. Transition to performance-based model in 2018 pending
approval of rate application by OEB
Distribution Lines
• Growing rate base with planned annual capex of ~$650 - $800 million through (Circuit KM) 123,000
2022
Distribution Poles
• 2018 expected ROE of 9.00.% with 40% / 60% deemed equity/debt capital 1.6M
structure
• Recent OEB decision in place transitioning residential distribution rates to fully Distribution End
+1.3M
Customers
fixed
• Drivers of growth include rate base expansion, productivity improvements Distribution and Regulating 1,000
The largest electric LDC in Ontario with
and continued consolidation of other LDC’s Stations
further expansion opportunities
• Recent Haldimand, Woodstock, Norfolk LDC acquisitions grew customer base
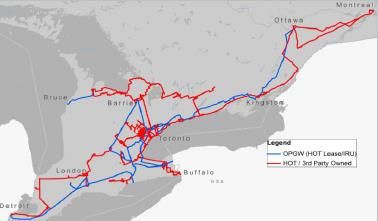
Investor Overview – Post Third Quarter 2018 by ~5% 11HYDRO ONE TELECOM
Integral role in servicing grid assets
Fiber optic lines (route KMs) 6,400
Network Points of Presence 81
Customer Site Connections
1,900
Data Centres Connected 30
• Leverages Hydro One’s network fiber assets used to monitor and manage power grid circuitry
• Diverse, secure, low latency broadband connectivity across Ontario utilizing infrastructure constructed
principally along electric transmission network
• Provincial fiber routes extend to Montreal and also include connection points in Buffalo and Detroit
• Provides fiber-optic broadband network services including leased circuits, dark fiber, ethernet transport,
internet transit, data center connectivity and tower access
• Customers include data centers, cloud service providers, enterprises, ISPs, other Telco's and public sector
entities
• Currently expanding number of data center connections and launching managed security, cloud backup and
data recovery solutions
Investor Overview – Post Third Quarter 2018 12$10B OF CAPITAL INVESTMENT DRIVING
RATE BASE GROWTH
Consistent and predictable organic growth profile underpinned by required
replacement of aging infrastructure
Projected Capital Investments* ($M) Projected Rate Base Growth*
$2,205 $2,209
$1,993 $24,082
$1,810 $22,918
$20,697 $21,807
$1,651 $719 $805 $19,724
$715
$751
$641
$1,486 $1,404
$1,278
$1,010 $1,059
2018 2019 2020 2021 2022 2018 2019 2020 2021 2022
* Company estimates subject to change and include amounts from March 2017 filed
Transmission Distribution distribution rate application and 2019 transmission inflationary filing which are
subject to OEB approval
Comments
• Organic growth underpinned by continued rate base expansion to renew and modernize grid
• Material amounts of deteriorated, end-of-service life infrastructure must be upgraded or replaced
• Little concentration risk as most projects within capex envelope are small to medium relative to total
• Investments not undertaken without reasonable assurance of regulatory recovery
• Equity issuance not anticipated for planned capital investment program which is self-funded
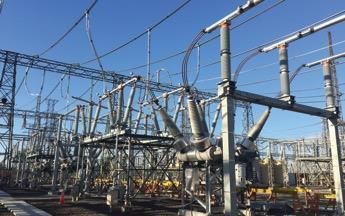
Investor Overview – Post Third Quarter 2018 13INFRASTRUCTURE INVESTMENTS
Clarington Transmission Station Richview Transmission Station
Estimated Total Project Cost: $2401 million Estimated Total Project Cost: $104 million
Capital Cost To Date: $235 million Capital Cost To Date: $96 million
Anticipated In-Service Date: 2018 Anticipated In-Service Date: 2019
Comprised of two 750MVA, 500/230 kV Replacement of 50 year old end-of-life
transformers and associated termination equipment at Richview Transformer Station to
facilities to connect Hydro One’s bulk ensure the secure and reliable power supply to
transmission network to Eastern Ontario upon the City of Toronto and surrounding
retirement of the Pickering Nuclear Generation communities
Station
1) Major portions of the Clarington Transmission Station projects were completed and placed in-service. Work on certain minor portions of the project continues in the second half of 2018.
Investor Overview – Post Third Quarter 2018 14STRONG BALANCE SHEET AND LIQUIDITY
Investment grade balance sheet with one of lowest debt costs in utility sector
Significant Available Liquidity ($M) Strong Investment Grade Credit Ratings (LT/ST/Outlook) Shelf Registrations
250 Hydro One Inc. (HOI)
Hydro One Limited
Hydro One Inc. HOL:
Universal Shelf3: $4.0B
S&P A- / A-1 (low) / CreditWatch negative1
2,300
444
DBRS A (high) / R-1 (low) / stable HOI:
Medium Term Note
Undrawn Credit Commercial Paper Shelf4:
Facilities Outstanding (Under Moody’s Baa1 / Prime-2 / stable2 $4.0B
$1.5B CP Program)
Debt Maturity Schedule ($M)
1000 Weighted average cost of debt: 4.1%
Weighted average term (years): 15.5
800
Debt to Capitalization5: 53.1%
600 FFO to Net Debt: 13.7%
400
200
0
2018
2019
2020
2021
2022
2023
2024
2025
2026
2027
2028
2029
2030
2031
2032
2033
2034
2035
2036
2037
2038
2039
2040
2041
2042
2043
2044
2045
2046
2047
2048
2049
2050
2051
2052
2053
2054
2055
2056
2057
2058
2059
2060
2061
2062
2063
2064
(1) On September 13, 2018, S&P lowered the issue-level rating on HOI's senior unsecured debt by one notch to "A-" from "A" and lowered the rating on HOI's commercial paper program by one notch to "A-1(low)" from "A-1(mid)" on the Canadian National Scale. All ratings remain on
CreditWatch where S&P placed them with negative implications on June 15, 2018. The one-notch downgrade reflects S&P’s reassessment of Hydro One’s management and governance structure, which has weakened following the Province's decision to exert its influence on the Company's
compensation structure through legislation, potentially promoting the interests and priorities of one owner above those of other stakeholders.
(2) On June 20, 2018, Moody's Investors Service (Moody’s) downgraded the long-term debt rating for Hydro One Inc. to "Baa1" from "A3", and revised its outlook on Hydro One Inc. to stable from negative. In addition, Moody’s affirmed the existing "Prime-2" short-term debt rating for Hydro One
Inc. Moody’s no longer assigns any probability of extraordinary support from the Province of Ontario in Hydro One Inc.’s credit analysis which has led to the downgrade.
(3) On June 18, 2018, Hydro One filed a short form base shelf prospectus (Universal Shelf) with securities regulatory authorities in Canada to replace the universal base shelf prospectus that expired on April 30, 2018. The Universal Base Shelf Prospectus allows Hydro One to offer, from time to time
in one or more public offerings, up to $4.0 billion of debt, equity or other securities, or any combination thereof, during the 25-month period ending on July 18, 2020. Hydro One filed the Universal Base Shelf Prospectus to provide the Company with financing flexibility going forward.
(4) $1.4 billion was drawn from the Medium Term Note Shelf during June 2018, leaving $2.6 billion available for issuance until April 2020.
(5) Debt to capitalization ratio has been calculated as total debt (includes total long-term debt, convertible debentures and short-term borrowings, net of cash and cash equivalents) divided by total debt plus total shareholders’ equity, including preferred shares but excluding any amounts
related to noncontrolling interest.
Investor Overview – Post Third Quarter 2018 15EQUITY MARKET CAP OVERVIEW
Approximate Ownership of Public Float Equity Index Inclusions
S&P/TSX Composite FTSE All-World (Canada)
17% Index
MSCI World (Canada) S&P/TSX Composite
Institutional Low Volatility Index
Retail Dow Jones Canada Select S&P/TSX Utilities Index
83% Utilities
S&P/TSX Composite S&P/TSX Composite High
Dividend Index Dividend Index
Approximate Geographic Dispersion of Public Float Comments
• 596 million common shares outstanding, listed on Toronto
7%
Stock Exchange (TSX: H)
11%
• Equity market capitalization of ~$11.7 billion1 and public
Canada float of ~$7 billion
US • Equity market capitalization amongst the top 60 of all listed
Canadian companies
Rest of World
82%
• Secondary offerings by Province increased liquidity without
diluting public shareholders
(1) Based on closing share price on September 28th, 2018
Investor Overview – Post Third Quarter 2018 16COMMON SHARE DIVIDENDS
Consecutive annual 5% increase to dividend announced on May 15th, 2018
Key Points
Dividend Statistics • Quarterly dividend increased to $0.23
per share ($0.92 annualized)
Yield1 4.7%
• Targeted dividend payout ratio remains
Annualized Dividend2,3 $0.92 / share at 70% - 80% of net income
(1) Based on closing share price on September 28th, 2018 • Attractive and growing dividend
(2) Unless indicated otherwise, all common share dividends are designated as "eligible" dividends
for the purpose of the Income Tax Act (Canada) supported by stable, regulated cash
flows and planned rate base growth
Expected Upcoming Quarterly Dividend Dates3
• No equity issuance anticipated to fund
Declaration Date Record Date Payment Date planned five year capital investment
program
November 7, 2018 December 11, 2018 December 31, 2018 • Non-dilutive dividend reinvestment
plan (DRIP) was implemented post IPO
(shares purchased on open market, not
issued from treasury)
(3) All dividend declarations and related dates are subject to Board approval.
Investor Overview – Post Third Quarter 2018 17REGULATORY FRAMEWORK
REGULATORY STAKEHOLDERS

                                              Who: Provincial Government, Ministry of Energy
                                              What: Policy, legislation, regulations

                                              Who: Ontario Energy Board (OEB)
                                              What: Independent electric utility price and service quality regulation

                                              Who: Independent Electricity System Operator
                                              What: Wholesale power market rules, intermediary, North American reliability standards

                                              Who: National Energy Board
                                              What: Federal regulator, international power lines and substations

                                              Who: North American Electric Reliability Corporation
                                              What: Continent-wide bulk power reliability standards, certification, monitoring

                                              Who: Northeast Power Coordinating Council
                                              What: Northeastern North American grid reliability, standards, compliance

Investor Overview – Post Third Quarter 2018                                                                                            19
CONSTRUCTIVE RATE REGULATOR (OEB)
Consistent, independent regulator with a transparent rate-setting process
• Transmission and distribution businesses rate-regulated by the Ontario Energy Board (OEB)
• Deemed debt / equity ratio of 60% / 40% for both transmission and distribution segments
• Hydro One has earned or exceeded its allowed ROE on a consolidated basis over past five years
• Reduced regulatory lag through forward-looking test years, revenue decoupling and adjustment mechanisms
• Filed for distribution rates under OEB’s Custom Incentive Rate Making model on March 31, 2017 for a 2018 – 2022 five year term. A decision is expected in 2018
• On October 26, 2018, Hydro One filed its submission regarding the implementation Hydro One Accountability Act for the 2018-2022 distribution rate filing
• Hydro One applied to the Ontario Energy Board (“OEB”), asking for a one-year mechanistic inflationary adjustment to its transmission rates for 2019
• Hydro One will file an application under the OEB’s custom incentive rates framework in 2019 for 2020-2022 following a thorough review of the transmission investment plan by
the Company’s new Board of Directors.
Current rate Allowed Expected Effective term of
methodology ROE rate base1 next application Comments
2018 2018 One-year inflationary adjustment to transmission
Transmission Cost of Service 2019 rates for 2019 . Custom incentive rates framework
9.00% $11.87 billion for 2020-2022
Current rate Allowed Expected Effective term of
methodology ROE3 rate base2,3 next application Comments
2018 2018 Filed on 31st Five-year incentive based rate filing made March
Distribution Cost of Service March, 2017 31, 2017. Decision for phased transition to fixed
9.00% $7.85 billion for 2018-22 residential rates (decoupling) already in place.
(1) Transmission rate base includes 100% of B2M JV and Hydro One Sault Ste. Marie
(2) Distribution Rate Base includes recent LDC acquisitions and Hydro One Remote Communities
(3) Company estimates subject to change and include amounts from March 2017 filed distribution rate application which is subject to OEB approval
Investor Overview – Post Third Quarter 2018 20DISTRIBUTION SEGMENT INCENTIVE
REGULATORY CONSTRUCT
The transition from cost of service to incentive based regulatory model coincident with
transformation of business will create value for both customers and shareholders
• Filed March 31, 2017 under OEB’s Custom Incentive Rate Making model for 2018 – 2022 five year term
• 2018 is considered “rebasing” year where a cost of service forward test year rate model is applied
• Revenue requirement for each of the ensuing four years determined annually by
• i) applying an inflation adjustment factor,
• ii) offset by a productivity and stretch factor of 0.45%, and
• iii) adding a capital factor (added revenue requirement to recover planned capital investments)
• ROE and short term debt rate set based on OEB approved Cost of Capital Parameter Update, issued November 23
2017. Additional update in 2021 requested
• 50% of earnings that exceed allowed ROE by more than 100 basis points in any year of the term of the filing shared
with customers (actual sharing deferred until 2023 rebasing)
• Previously acquired Norfolk, Haldimand and Woodstock LDC’s brought into rate base in 2021
• Planned rate base CAGR of 5% over five year term of filing
• Average annual impact on rates over the five year term of the rate application is approximately 3.5%
• On October 26, 2018, Hydro One filed its submission regarding the implementation of Bill 2 (Hydro One Accountability
Act, 2018)
• Transmission segment expected to be filed under custom incentive rates framework for 2020-2022 following a
thorough review of the transmission investment plan
Investor Overview – Post Third Quarter 2018 21REDUCING OUR CUSTOMER BILLS
Since 2017, Hydro One customer bills have decreased on average from $165 to $122 per month
2017 Monthly Bill- $165 2018 Monthly
Bill- $122
$8
$44
$6 (5%) Sales Tax and OCEB
$90
$66 (54%) Electricity Charges
$6 Regulatory Charges
$9
$3 (2%)
$9 (7%) Transmission Charges
$52
Distribution Charges
$37 (30%)
2017 Distribution Cost 2017 Transmission 2017 Regulatory 2017 Electricity 2017 Sales Tax & Reductions in bill for
2018 Bill
Costs Charges Charges OCEB 2018
Annual Change in Customer Monthly Bills
9% 11% 6% 5% 4% 6% 6% 14%
-4% -2% -8%
$179 -26%
$157 $165 CAGR CAGR
$141 $149
$136 2006-2017 2006-2018
$129
$111 $123 $122 -1.6%
Sales Tax & OCEB1
OECB
and 1.0%
$108 $104 $101
Electricity Charges 6.6% 3.3% Electricity &
other charges
Regulatory 5.4% -9.0%
Transmission 1.4% 1.3%
Hydro One’s
Distribution Portion
3.0% -0.1%
2006 2007 2008 2009 2010 2011 2012 2013 2014 2015 2016 2017 2018
Investor Overview – Post Third Quarter 2018 22
Note: The charts represent the breakdown of a typical bill for a Hydro One medium-density residential local distribution end customer using 750 kWh a month
1) OCEB is an abbreviation for the Ontario Clean Energy BenefitDELIVERING CLEAN AND SUSTAINABLE
ENERGY
Transmitting and delivering some of the cleanest energy in North America
• Ontario was the first North American jurisdiction to fully eliminate coal
electricity generation and leads Canada in wind and solar capacity
• Recent five year Ontario Climate Change Action Plan will further
accelerate province’s leadership in reduction of greenhouse gas emissions
• One of only six utilities in Canada to achieve the Sustainable Energy Company
designation from the Canadian Electrical Association
• Ontario electricity now generated by: nuclear 58%, hydro 23%, natural gas 10%, wind 7%, solar 2%
• Ranked as the top utility in Corporate Knights Canada’s 2016 Best Corporate Citizens on a set of 12
sustainability metrics, including carbon productivity and gender diversity in leadership
• Environmental stewards of thousands of kilometers of transmission grid corridor lands, including
management of vegetation for habitat preservation and protection of species at risk
• ISO 14001 Compatible Environmental Management System to identify and proactively manage environmental
risks for continual improvement
• Greener Choices program actively engages employees in sustainability improvement efforts for energy
efficiency, recycling and waste reduction at work
Investor Overview – Post Third Quarter 2018 23WHY INVEST IN HYDRO ONE
A unique low-risk opportunity to participate in the transformation of a premium,
large scale regulated electric utility
• One of the largest electric utilities in North America with significant scale and leadership position across Canada’s
most populated province
• Unique combination of pure-play electric power transmission and local distribution, with no generation or material
exposure to commodity prices
• 99% of business is rate-regulated in a constructive, stable, transparent and collaborative regulatory environment
• Predictable growth profile with expanding rate base and strong cash flows, together with broad support for
refurbishment of aging infrastructure
• Opportunities to transform to a performance driven culture, capture productivity improvements and transition to
incentive-based regulatory model
• One of the strongest investment grade balance sheets in the North American utility sector
• Increased $0.92 annualized dividend with 70% - 80% target payout ratio and opportunity for continued dividend
growth with rate base expansion, continued consolidation and efficiency realization
• Float and liquidity increased without dilution as phased privatization by Province of Ontario was executed
• Blue chip fully independent board together with legislated governance structure allow company to operate
autonomously, transform culture and drive shareholder value creation on multiple fronts
• Proven management team with demonstrated experience transforming organizations, accelerating performance
and creating significant shareholder value
Investor Overview – Post Third Quarter 2018 24APPENDIX
HYDRO ONE LIMITED

3Q18 FINANCIAL SUMMARY
                                                                                 Third Quarter                                                                           YTD
   ($ millions)                                                               2018           2017                           % Change                      2018                      2017                 % Change
     Revenue
     Transmission                                                              $493                     $471                      4.7%                    $1,344                    $1,199                    12.1%
     Distribution                                                             1,103                     1,040                     6.1%                     3,284                    3,317                    (1.0%)
     Distribution (Net of Purchased Power)                                     370                       365                      1.4%                     1,126                    1,104                     2.0%
     Other                                                                      10                        11                     (9.1%)                      31                       35                     (11.4%)
        Consolidated                                                            1,606                    1,522                     5.5%                     4,659                     4,551                     2.4%
     Consolidated (Net of Purchased Power)                                     873                       847                      3.1%                     2,501                    2,338                     7.0%
     OM&A Costs                                                                271                       277                     (2.2%)                     797                      822                     (3.0%)
    Earnings Before Financing Charges and Income Taxes (EBIT)
     Transmission                                                              287                       271                      5.9%                      728                       594                     22.6%
     Distribution                                                              120                       114                      5.3%                      397                       369                     7.6%
     Other                                                                     (18)                      (24)                    25.0%                      (41)                     (50)                     18.0%
     Consolidated                                                              389                       361                      7.8%                     1,084                      913                     18.7%
     Net   Income1                                                             194                       219                    (11.4%)                     616                      503                      22.5%
     Adjusted Net     Income1,2                                                227                       237                     (4.2%)                     631                       524                     20.4%
     Basic EPS                                                                $0.33                     $0.37                   (10.8%)                    $1.03                    $0.85                     21.2%
     Adjusted Basic EPS1                                                      $0.38                     $0.40                    (5.0%)                    $1.06                    $0.88                     20.5%
     Capital Investments                                                       402                       380                      5.8%                     1,108                    1,136                    (2.5%)
    Assets Placed In-Service
     Transmission                                                              112                       120                     (6.7%)                     466                       367                     27.0%
     Distribution                                                              126                       172                    (26.7%)                     389                       482                    (19.3%)
     Other                                                                       1                        2                         -                         6                       10                         -
     Consolidated                                                              239                       294                    (18.7%)                     861                       859                     0.2%

Investor Overview – Post Third Quarter 2018                                                                                                                                                                               26
 Financial Statements reported under U.S. GAAP
 (1) Net Income is attributable to common shareholders and is after non-controlling interest, dividends to preferred shareholders, (2) Adjusted Net Income excludes items related to the Avista Corporation acquisition
TOP TRANSMISSION CAPITAL PROJECTS UNDERWAY
Anticipated Estimated Capital Cost
Development Project Name Location Type
In-Service Date Cost To-Date
Supply to Essex County Windsor-Essex area New transmission 2018 $551 million $54 million
Transmission Reinforcement Southwestern Ontario line and station
Clarington Transmission Station Oshawa area New transmission 2018 $2401 million $235 million
Southwestern Ontario station
Niagara Reinforcement Project Niagara area New transmission 2019 $130 million $114 million
Southwestern Ontario line
East-West Tie Station Expansion Northern Ontario New transmission 2021 $157 million $12 million
connection and
station expansion
Northwest Bulk Transmission Thunder Bay-Atikokan New transmission 2024 $350 million $1 million
Line Northwestern Ontario line
Anticipated Estimated Capital Cost
Sustainment Project Name Location Type
In-Service Date Cost To-Date
Richview Transmission Station Toronto Station sustainment 2019 $104 million $96 million
Circuit Breaker Replacement Southwestern Ontario
Bruce A Transmission Station Tiverton Station sustainment 2020 $138 million $119 million
Southwestern Ontario
Beck #2 Transmission Station Niagara area Station sustainment 2022 $114 million $61 million
Circuit Breaker Replacement Southwestern Ontario
Lennox Transmission Station Napanee Station sustainment 2023 $98 million $56 million
Circuit Breaker Replacement Southeastern Ontario
(1) Major portions of the Supply to Essex County Transmission Reinforcement and Clarington Transmission Station projects were
Investor Overview – Post Third Quarter 2018 completed and placed in-service. Work on certain minor portions of the project continues in the second half of 2018. 27
(2) The estimated cost to complete the Bruce A Transmission Station project is currently under review.INDEPENDENT BOARD OF DIRECTORS
Tom Woods Currently a Director of Bank of America Corporation, Alberta Investment Timothy Hodgson Currently Managing Partner of Alignvest Capital Management.
Management Corporation, Providence St. Joseph’s St. Michael’s Health Care (Board Chair) Previously, Special Advisor to Governor Mark Carney at Bank of Canada and CEO of Goldman
and CIBC Children’s Foundation. Previously with CIBC and Wood Gundy, serving as Head of Sachs Canada. Currently a Director with Alignvest Acquisition II Corporation (Chair), PSP
Canadian Corporate Banking, Chief Financial Officer, Chief Risk Officer and Vice Chairman. Investments, MEG Energy Corp.
Cherie Brant Currently a Partner at Dickinson Wright’s Toronto law office where she has Jessica McDonald Currently Interim President and Chief Executive Officer of Canada Post
an Indigenous law practice with a focus on commercial real estate, energy and transmission Corporation. Previously President and Chief Executive Officer of British Columbia Hydro &
and First Nations economic development. Currently a Director with Anishnawbe Health Power Authority and Executive Vice President of HB Global Advisors Corp. Currently a
Foundation and is a member of the Canadian Council for Aboriginal Business, Research Director with Canada Post Corporation, Coeur Mining Inc. and Trevali Mining Corporation,
Advisory Board and the Aboriginal Energy Working Group of the Independent Electricity and is on the Member Council of Sustainable Development Technology Canada.
System Operator.
Blair Cowper-Smith Currently the principal and founder of Erin Park Business Solutions. Russel Robertson Currently a Director with Bausch Health Companies Inc. and Turquoise
Previously, he was Chief Corporate Affairs Officer of Ontario Municipal Employees Hill Resources. Previously Executive Vice President and Head, Anti-Money Laundering, Chief
Retirement System (OMERS) and a member of the Senior Executive Team. Board experience Financial Officer and Executive Vice‐President, Business Integration with BMO Financial
includes numerous advisory assignments, including governance advisory assignments, with Group.
boards of directors including OMERS, Stelco, Hammerson, and includes existing or prior
director appointments and board committee leadership roles with companies like Porter
Airlines, 407 ETR, the Financial Services Regulatory Authority and Face the Future
Foundation.
Anne Giardini, O.C., Q.C. Currently Chancellor of Simon Fraser University. Previously with William Sheffield Currently a Director with Houston Wire & Cable Company, Velan, Inc.,
Weyerhaeuser Company Limited, including role as Canadian President. Currently a Director Burnbrae Farms Ltd., Longview Aviation Capital and Family Enterprise Xchange. Previously
of Nevsun Resources Ltd., Canada Mortgage & Housing Corporation, World Wildlife Fund Chief Executive Officer of Sappi Fine Papers, headquartered in South Africa. Previously, held
(Canada), BC Achievement Foundation, TransLink and the Greater Vancouver Board of senior roles with Abitibi-Consolidated, Inc. and Abitibi-Price, Inc.
Trade.
David Hay Currently a Director of EPCOR, SHAD (Chair), the Council of Clean and Reliable Melissa Sonberg Currently Adjunct Professor and Executive-in-Residence at McGill
Energy and as Chair of the Acquisition Committee of the Beaverbrook Art Gallery. Formerly University’s Desautel Faculty of Management. Currently a Director with Exchange Income
Vice-Chair and Managing Director of CIBC World Markets Inc., President and Chief Executive Corporation, MD Financial Holdings, Inc., Canadian Professional Sales Association, Group
Officer of New Brunswick Power Corporation, Managing Director of Delgatie Incorporated Touchette, Women in Capital Markets and Equitas – International Centre for Human Rights.
and Senior Vice-President and Director responsible for mergers and acquisitions with Merrill
Lynch Canada.
Investor Overview – Post Third Quarter 2018 28DISCLAIMERS DISCLAIMERS In this presentation, all amounts are in Canadian dollars, unless otherwise indicated. Any graphs, tables or other information in this presentation demonstrating the historical performance of the Company or any other entity contained in this presentation are intended only to illustrate past performance of such entitles and are not necessarily indicative of future performance of Hydro One. In this presentation, “Hydro One” refers to Hydro One Limited and its subsidiaries and other investments, taken together as a whole. Forward-Looking Information This presentation contains “forward-looking information” within the meaning of applicable Canadian securities laws. Forward-looking information in this presentation is based on current expectations, estimates, forecasts and projections about Hydro One’s business and the industry in which Hydro One operates and includes beliefs of and assumptions made by management. Such statements include, but are not limited to: statements regarding operational priorities; statements about strategy; statements related to dividends; statements regarding future equity issuances; expectations regarding planned or expected capital investments; statements related to rate applications, proceedings, models and expected outcomes and impacts of decisions; statements regarding performance and productivity improvements; statements regarding acquisitions; statements related to the Universal Base Shelf Prospectus and Medium Term Note Prospectus; statements about debt maturity; statements related to credit ratings; statements regarding infrastructure investments, including cost and in-service dates; statements about planned or ongoing projects and initiatives; statements related to the Ontario Climate Change Action Plan; statements regarding customer bills; and statements and projections regarding rate base and cash flows. Words such as “aim”, “could”, “would”, “expect”, “anticipate”, “intend”, “attempt”, “may”, “plan”, “will”, “believe”, “seek”, “estimate”, “goal”, “target”, and variations of such words and similar expressions are intended to identify such forward-looking information. These statements are not guarantees of future performance and involve assumptions and risks and uncertainties that are difficult to predict. Therefore, actual outcomes and results may differ materially from what is expressed, implied or forecasted in such forward-looking information. Hydro One does not intend, and it disclaims any obligation to update any forward-looking information, except as required by law. The forward-looking information in this presentation is based on a variety of factors and assumptions, as described in the financial statements and management’s discussion and analysis. Actual results may differ materially from those predicted by such forward-looking information. While Hydro One does not know what impact any of these differences may have, Hydro One’s business, results of operations and financial condition may be materially adversely affected if any such differences occur. Factors that could cause actual results or outcomes to differ materially from the results expressed or implied by forward-looking information are described in the financial statements and management’s discussion and analysis. Non-GAAP Measures Hydro One prepares and presents its financial statements in accordance with U.S. GAAP. “Funds from Operations” or “FFO”, “Adjusted Net Income”, “Revenue Net of Purchased Power” and “Adjusted Earnings Per Share” are not recognized measures under U.S. GAAP and do not have standardized meanings prescribed by U.S. GAAP. These are therefore unlikely to be comparable to similar measures presented by other companies. Funds from Operations should not be considered in isolation nor as a substitute for analysis of Hydro One’s financial information reported under U.S. GAAP. “Funds from Operations” or “FFO” is defined as net cash from operating activities, adjusted for the following: (i) changes in non-cash balances related to operations, (ii) dividends paid on preferred shares, and (iii) non-controlling interest distributions. Management believes that these measures will be helpful as a supplemental measure of the Company’s operating cash flows and earnings. For more information, see “Non-GAAP Measures” in Hydro One’s 2017 full year MD&A. Investor Overview – Post Third Quarter 2018 29
CONTACT

        Omar Javed
        Vice President, Investor Relations
        ojaved@HydroOne.com
        (416) 345-5943

        HydroOne.com/InvestorRelations

Investor Overview – Post Third Quarter 2018   30
You can also read