Household Transmission of Severe Acute Respiratory Syndrome Coronavirus 2 in the United States: Living Density, Viral Load, and Disproportionate ...
←
→
Page content transcription
If your browser does not render page correctly, please read the page content below
Clinical Infectious Diseases
   Major Article

Household Transmission of Severe Acute Respiratory
Syndrome Coronavirus 2 in the United States: Living
Density, Viral Load, and Disproportionate Impact on
Communities of Color

                                                                                                                                                                                                 Downloaded from https://academic.oup.com/cid/advance-article/doi/10.1093/cid/ciab701/6349288 by guest on 03 December 2021
Carla Cerami,1,2 Zachary R. Popkin-Hall,1 Tyler Rapp,1 Kathleen Tompkins,1 Haoming Zhang,3 Meredith S. Muller,1 Christopher Basham,1
Maureen Whittelsey,1 Srijana B. Chhetri,1 Judy Smith,1 Christy Litel,1 Kelly D. Lin,1 Mehal Churiwal,1 Salman Khan,4 Rebecca Rubinstein,3 Faith Claman,1
Katie Mollan,3 David Wohl,1 Lakshmanane Premkumar,4 Kimberly A. Powers,3 Jonathan J. Juliano,1 Feng-Chang Lin,3 and Jessica T. Lin1,
1
 Institute of Global Health and Infectious Diseases, University of North Carolina School of Medicine, Chapel Hill, North Carolina, USA; 2Medical Research Council Unit The Gambia at the
London School of Hygiene & Tropical Medicine, Fajara, The Gambia; 3Gillings School of Global Public Health, University of North Carolina, Chapel Hill, North Carolina, USA; and 4Department of
Microbiology and Immunology, University of North Carolina School of Medicine, Chapel Hill, North Carolina, USA

   Background.             Households are hot spots for severe acute respiratory syndrome coronavirus 2 transmission.
   Methods. This prospective study enrolled 100 coronavirus disease 2019 (COVID-19) cases and 208 of their household members
in North Carolina though October 2020, including 44% who identified as Hispanic or non-White. Households were enrolled a me-
dian of 6 days from symptom onset in the index case. Incident secondary cases within the household were detected using quantita-
tive polymerase chain reaction of weekly nasal swabs (days 7, 14, 21) or by seroconversion at day 28.
   Results. Excluding 73 household contacts who were PCR-positive at baseline, the secondary attack rate (SAR) among household con-
tacts was 32% (33 of 103; 95% confidence interval [CI], 22%–44%). The majority of cases occurred by day 7, with later cases confirmed as
household-acquired by viral sequencing. Infected persons in the same household had similar nasopharyngeal viral loads (intraclass cor-
relation coefficient = 0.45; 95% CI, .23–.62). Households with secondary transmission had index cases with a median viral load that was
1.4 log10 higher than those without transmission (P = .03), as well as higher living density (more than 3 persons occupying fewer than 6
rooms; odds ratio, 3.3; 95% CI, 1.02–10.9). Minority households were more likely to experience high living density and had a higher risk
of incident infection than did White households (SAR, 51% vs 19%; P = .01).
   Conclusions. Household crowding in the context of high-inoculum infections may amplify the spread of COVID-19, poten-
tially contributing to disproportionate impact on communities of color.
   Keywords. SARS-CoV-2; household transmission; viral load; secondary attack rate; living density.

Households are hot spots for severe acute respiratory syndrome                                      and prospective analyses [6, 7]. Prospective testing of house-
coronavirus 2 (SARS-CoV-2) transmission [1]. Person-to-person                                       hold contacts (HCs) regardless of symptom status is required
transmission is difficult to control in shared living spaces. For                                   to capture all secondary cases. Previously identified risk factors
those who isolate at home with young children in small living                                       associated with increased transmission include the presence
spaces, following guidelines to physically distance and use sepa-                                   of symptoms [6–8] and high viral load in the index case [9].
rate sleeping, eating, and lavatory facilities is difficult [2]. Because                            Among HCs, spouses and those aged >18 years (ie, adults com-
the period of peak infectiousness starts prior to the onset of symp-                                pared with children) are more likely to acquire infection [6, 7,
toms, spread can occur before these measures are taken [3–5].                                       10]. Measuring secondary household attack rates in vulnerable
   Meta-analyses of the secondary household attack rate (SAR)                                       communities and identifying risk factors for transmission in
in the first 6 months of the pandemic ranged from 15% to                                            these communities are critical.
20% [6, 7], but these analyses incorporated both retrospective                                         The University of North Carolina (UNC) COVID-19
                                                                                                    Household Transmission Study (CO-HOST) is the largest,
                                                                                                    single-site, observational, household cohort in the United States
   Received 30 May 2021; editorial decision 8 August 2021; published online 12 August 2021.
   Correspondence: J. T. Lin, 111 Mason Farm Rd, 2336 MBRB, CB#7036, Chapel Hill, NC 27599
                                                                                                    to date and the most ethnically and racially diverse. Weekly
(jessica_lin@med.unc.edu).                                                                          sampling for quantitative viral loads combined with SARS-
Clinical Infectious Diseases®  2021;XX(XX):1–10                                                     CoV-2 antibody testing at baseline and at 1 month provided
© The Author(s) 2021. Published by Oxford University Press for the Infectious Diseases Society
of America. All rights reserved. For permissions, e-mail: journals.permissions@oup.com.
                                                                                                    an extended period to evaluate transmission. Our objective in
https://doi.org/10.1093/cid/ciab701                                                                 this study was to measure the incident SAR in a setting where

                                                                                          SARS-CoV-2 Transmission in US Households • cid 2021:XX (XX XXXX) • 1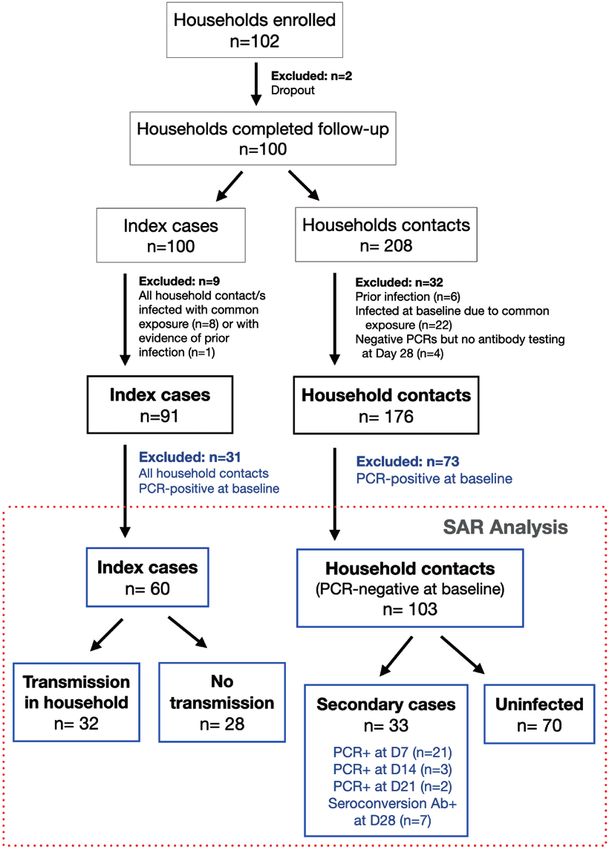
infected individuals were asked to quarantine at home and given           venipuncture), results from a BioMedomics COVID-19 immu-
standard guidance. Household and individual demographics as               noglobulin (Ig) M/IgG Rapid Test [13–15] were used.
well as daily symptoms and weekly viral loads were collected to              To determine the prevalence of the 614G variant, which pre-
identify risk factors and timing of household transmission.               dominated in North Carolina at the time of the study, in our
                                                                          study samples, we developed a real-time PCR assay to target a
METHODS
                                                                          107 bp region encompassing the D614G mutation in the S1 seg-
                                                                          ment of the SARS-CoV-2 spike protein.
Study Design and Enrollment                                                  To determine whether secondary cases were acquired out-
In the CO-HOST study, we evaluated SARS-CoV-2 acquisi-                    side the household rather than due to household transmission,
tion among persons undergoing quarantine in their home after a            we performed high-density amplicon sequencing on NP/NMT

                                                                                                                                                Downloaded from https://academic.oup.com/cid/advance-article/doi/10.1093/cid/ciab701/6349288 by guest on 03 December 2021
care-seeking household member (the index case) tested positive            swab samples from households with late secondary cases to as-
for SARS-CoV-2. Recruitment occurred between April 2020 and               sign SARS-CoV-2 clades and determine the genetic relatedness
October 2020, prior to the introduction of SARS-CoV-2 vaccines            of viral isolates within and between households.
in the United States. Inclusion criteria for the index cases were age
>18 years with a positive qualitative nasopharyngeal (NP) swab            Statistical Analyses
for SARS-CoV-2 RNA using polymerase chain reaction (PCR)                  We summarized baseline demographic characteristics and un-
performed at the UNC hospital clinical laboratory, willingness            derlying conditions of index cases and HCs, as well as their
to self-isolate at home for a 14-day period, living with at least 1       household demographics. We determined if baseline NP SARS-
HC who was also willing to participate, and living within driving         CoV-2 viral loads were correlated within households by the
distance (1 year and currently living in the        vs between household variation.
same home as the index case without plans to live elsewhere during           We evaluated the secondary household attack rate among
the 28-day study. All participants (or their parents/guardians) gave      household members of persons who tested positive for SARS-
written, informed consent. Minors aged >7 years provided assent.          CoV-2. For each household, if multiple participants were pos-
   As shown in Supplementary Figure 1, all households were                itive at enrollment, the index case was defined as the person
visited on day 1 by the study team. NP and nasal midturbinate             with the earliest onset of infection based on reported onset
(NMT) swabs were collected for SARS-CoV-2 PCR testing, and                of symptoms and known date(s) of PCR test positivity. If this
blood samples were collected for serology. All study participants         was ambiguous, baseline antibody positivity was used as ev-
received instruction on self-collection of NMT swabs and com-             idence of less recent infection. We calculated the SAR as the
pleted baseline questionnaires that included basic demographic            risk of incident infection among HCs, defined as the propor-
and household information, abbreviated medical history, symp-             tion of contacts who were PCR-negative at baseline but then
toms, recent travel history, and exposure to confirmed cases of           developed SARS-CoV-2 infection during the 28-day study fol-
coronavirus disease 2019 (COVID-19).                                      low-up, confirmed by either PCR or antibody seroconversion.
   All participants received a daily symptom questionnaire via email      Those with evidence of prior infection (antibody-positive and
until no symptoms were reported for 2 consecutive days. HCs who           PCR-negative) or HCs who reported the same COVID-19 ex-
remained asymptomatic received the questionnaire for 21 days to           posure outside the household as the index case were excluded
monitor for new symptoms. On days 7, 14, and 21, a study staff            from the analysis. To avoid misclassification of asymptomatic
member conducted home visits to collect self-collected NMT                infection, HCs who tested PCR-negative by weekly nasal swabs
swabs. At the final study visit (day 28), participants were asked about   (days 7, 14, and 21) but without day 28 antibody results were
COVID-19–related care-seeking and underwent serologic testing.            also excluded. A 95% confidence interval (CI) for the SAR was
                                                                          calculated using a robust variance estimation for the intercept
Laboratory Analyses                                                       term in a logistic regression model to account for outcome de-
Details for all laboratory methods are found in the                       pendence within a household.
Supplementary Materials. Quantitative PCR testing for SARS-                  Potential risk factors for secondary transmission within the
CoV-2 was performed using a Centers for Disease Control                   household, including characteristics of index cases, house-
and Prevention reverse-transcription quantitative-PCR pro-                holds, and HCs, were examined. These risk factors and de-
tocol authorized by the US Food and Drug Administration                   tails of symptom severity evaluation are described in the
for emergency use, as previously described [11]. Serology was             Supplementary Materials. Statistical significance was tested
performed using enzyme-linked immunoassay (ELISA) that                    using either the Fisher exact test or χ2 test for categorical vari-
detects antibodies to the receptor binding domain of the spike            ables and the Mann-Whitney test for continuous variables.
protein with high sensitivity and specificity [12]. When ELISA            To determine if the association between index race-ethnicity
results were not available (ie, in children who did not undergo           and SAR was related to housing density or viral load (which

2 • cid 2021:XX (XX XXXX) • Cerami et al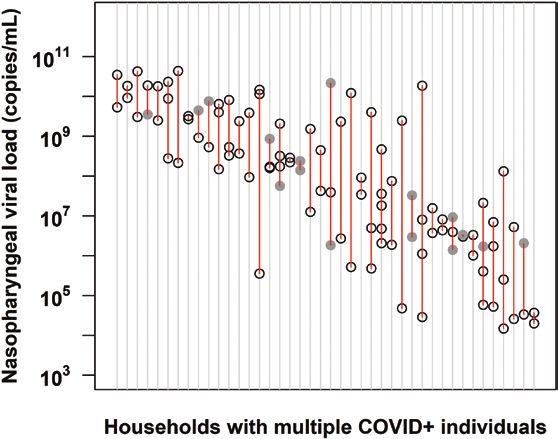
were correlated with race-ethnicity and/or transmission in                                  The University of North Carolina Institutional Review Board
unadjusted analyses), we calculated the odds ratio of the race-                           approved the study.
ethnicity–specific SAR, with the 95% CI estimated using the
same robust variance estimation described above, then added                               RESULTS
the other risk factors as covariates in the logistic regression                           Study Enrollment
model to calculate adjusted odds ratios.                                                  Between April 2020 and October 2020, the UNC CO-HOST
   Analyses were performed using R 4.0.2 (R Core Team, Vienna,                            study enrolled 102 households across the central Piedmont
Austria). All hypothesis tests were 2-sided at a significance level                       Region of North Carolina (Supplementary Figure 2). After
of 0.05 with no adjustments for multiple comparisons.                                     excluding participants who did not complete follow-up,

                                                                                                                                                                                 Downloaded from https://academic.oup.com/cid/advance-article/doi/10.1093/cid/ciab701/6349288 by guest on 03 December 2021

Figure 1. COVID-19 Household Transmission Study enrollment and SAR. Among 100 households that completed the 28-day follow-up, household contacts were excluded if
they had evidence of prior infection (negative PCR and positive antibody test at enrollment), were possibly infected at the same time as the index case based on a common ex-
posure event, or negative PCR testing could not be confirmed with a negative antibody test at day 28. Of the remaining 176 household contacts of 91 index cases, 41% (73) were
already PCR-positive at baseline and thus excluded from the primary SAR analysis. During study follow-up, 33 incident severe acute respiratory syndrome coronavirus 2 cases
were identified, yielding a SAR of 32% (33 of 103). Among the 33 secondary cases, 22 were identified by both PCR and seroconversion from day 1 to day 28, 4 were identified by
PCR only, and 7 were identified based on seroconversion. Abbreviations: Ab+, antibody positive; D, day; PCR, polymerase chain reaction; SAR, secondary household attack rate.

                                                                                SARS-CoV-2 Transmission in US Households • cid 2021:XX (XX XXXX) • 3
had evidence of prior infection, or those who were pos- non-Hispanic race-ethnicity, and 33% of adults were obese sibly infected at the same time as the index case based on (body mass index >30 kg/m2; Table 1, other comorbidities in a common exposure, 91 households were included in the Supplementary Table 1). baseline analysis (Figure 1). Households were enrolled a median of 6 days (interquartile range [IQR], 4–7) after Household Characteristics symptom onset of the designated index case, which was re- The median size of households was 4 persons (Supplementary assigned in 11 households. Baseline characteristics of the 91 Table 2). However, in 38% of households, at least 1 household index cases and 176 HCs are listed in Table 1. The median member chose not to participate. Households with a non-White index case age was 37 years (IQR, 23–49), while the age of index case were more likely to live in a home less than 2000 HCs ranged from 2 to 77 years with 34% aged 65 4 (4.4) 10 (5.7) Education (excluding those aged 18 years 80 113 High school or lower 36 (45) 54 (48) College degree 23 (29) 34 (30) Graduate degree 21 (26) 25 (22) Occupation (excluding those aged 18 years 83 116 Education 3 (3.6) 6 (5.2) Healthcare worker 11 (13) 9 (7.8) Retail/Hospitality/Other frontline worker 19 (23) 22 (19) Student 7 (8.4) 12 (10) White collar worker 23 (28) 34 (29) Other (trade and arts) 6 (7.2) 6 (5.2) Not working outside the home 14 (17) 27 (23) Comorbidities (excluding those aged 30 28 (34) 38 (33) 25–29.9 24 (29) 31 (27) >30 and 1 or more comorbidity Adults aged >18 years (n = 83 index, 116 HC) 16 (19) 22 (19) Adults aged >50 years (n = 22 index, 37 HC) 7 (32) 12 (32) Abbreviation: HC, household contact. 4 • cid 2021:XX (XX XXXX) • Cerami et al
3 household members living in a home with fewer than 6 rooms
compared with 8% of White households (P < .001).
   SARS-CoV-2 viral burden was correlated within households
(Figure 2). When comparing the baseline NP viral load within vs
between households, viral burden showed significant clustering
within households (ICC = 0.45; 95%, CI 0.23–0.62; P < .001).
Differences in viral load are not attributable to D614G mutation
in the viral spike protein that has been associated with increased
viral load and infectivity [16], as 90 of 92 (98%) of genotyped
SARS-CoV-2 isolates contained the 614G mutant, while only 2

                                                                                                                                                           Downloaded from https://academic.oup.com/cid/advance-article/doi/10.1093/cid/ciab701/6349288 by guest on 03 December 2021
of 92 were wild type at this locus.

Secondary Attack Rate Among Household Contacts
The incident SAR among HCs was 32% (33 of 103; 95% CI,
22%–44%). Among 91 households, 73 of 176 (41%) HCs
tested PCR-positive at baseline and were excluded from the           Figure 2. Severe acute respiratory syndrome coronavirus 2 viral burden is cor-
primary SAR analysis (Figure 1, Supplementary Table 3 for            related within families. The viral load obtained at enrollment from nasopharyngeal
demographics of baseline infected cases). Among the re-              (NP) swabs in households with multiple COVID-19–positive household members is
                                                                     shown (n = 42 households). Each vertical row in red depicts an individual house-
maining 103 HCs of 51 index cases, 33 incident SARS-CoV-2            hold, with circles delineating the log viral load of each member within the house-
infections were observed during the 28-day study follow-up           hold. Gray-shaded circles represent values derived from a nasal midturbinate swab
(SAR = 32%; 33 of 103). Of these 33 secondary cases, 22 were         if NP sampling was not performed. This was based on a linear regression equation
                                                                     generated from more than 100 study participants with positive viral load from both
identified by both PCR and seroconversion from day 1 to
                                                                     NP and nasal midturbinate swabs [11]. Households are depicted across the x-axis
day 28, 4 were identified by PCR only, and 7 were identified         in order of decreasing viral load. Data drawn from 148 participants. The intraclass
by seroconversion alone. The majority of secondary cases in          correlation coefficient = 0.45; 95% confidence interval, .23–.62; P value < .001.
the household experienced symptoms (27 of 33), while 18%             Abbreviation: COVID-19, coronavirus disease 2019.

(n = 6) remained asymptomatic.
   Secondary household transmission occurred early, within the       recently infected [16, 18] (Figure 4). Symptom severity was not
first week following enrollment for the majority of cases (n = 21    associated with household transmission, though secondary
of 26 for those identified by PCR; Figure 1). Five cases were de-    transmission did occur in households of the 4 index cases who
tected by PCR after the first week of enrollment, at day 14 or day   were hospitalized (Table 2).
21. Four of these late secondary cases occurred in households           Households with non-White index cases were more likely
of 5 or more (including 2 from the same household), which            to experience incident transmission in the household (Table
suggests the possibility of sequential transmission within the       2), despite there being no difference in index case viral loads
household. High-density amplicon sequencing of viral isolates        by race-ethnicity (median NP viral load for White vs non-
from these late secondary cases and others in their household        White: 8.3 vs 8.3 log10 copies/mL). This corresponds to a
confirmed that 4 of 5 were indeed due to household transmis-         SAR of 51% (95% CI, 33%–69%) in households with a non-
sion (1 isolate failed sequencing) and not community-acquired        White or Hispanic index case compared with 19% (95% CI,
(Figure 3).                                                          10%–35%) in White, non-Hispanic households (P = .008).
                                                                     Higher living density, defined as more than 3 household
Risk Factors for Household Transmission                              members living in a home with fewer than 6 rooms, was as-
At the household level, 44% of households (40 of 91) had at least    sociated with a greater odds of transmission (OR, 3.3; 95%
1 infected household member at enrollment in addition to the         CI, 1.02–10.9; P = .047; Table 3); a greater proportion of non-
index case, rising to 69% (63 of 91) of households 1 month later.    White/Hispanic households met this definition of high living
Sixty households contained susceptible HCs at enrollment and         density (42%, 11 of 26) compared with White, non-Hispanic
were thus included in the risk factor analysis.                      households (12%, 4 of 34; P = .01). However, after adjusting
   Secondary transmission in the household was associated            for viral load and living density, Hispanic/non-White race-
with a higher NP viral load in index cases at enrollment. The        ethnicity remained associated with secondary household
median NP viral load among index cases was 1.4 log10 higher          transmission (Table 4).
in households with secondary cases detected during the study            Among susceptible HCs, those who shared a bathroom
vs those with no incident cases in the household (P = .03; Table     with the index case were at higher risk of acquiring infection
2). This difference persisted when the analysis was restricted       (Supplementary Table 4). Obesity and being female were also
to index cases who were still antibody-negative and thus more        associated with a higher risk of incident infection, though these

                                                               SARS-CoV-2 Transmission in US Households • cid 2021:XX (XX XXXX) • 5
Downloaded from https://academic.oup.com/cid/advance-article/doi/10.1093/cid/ciab701/6349288 by guest on 03 December 2021
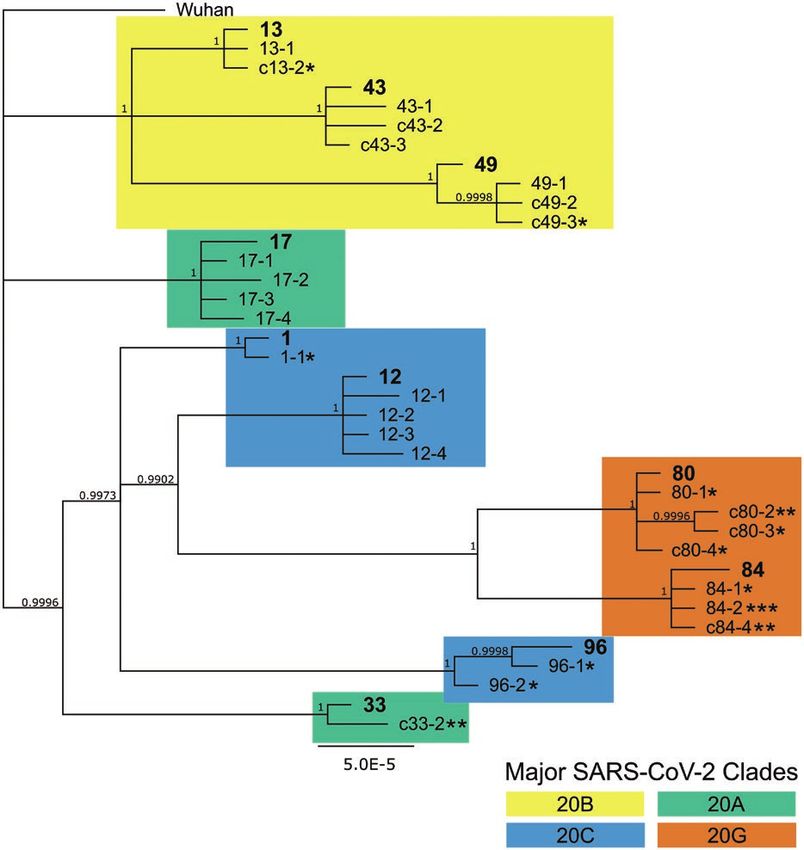
Figure 3. Bayesian phylogeny showing high relatedness within household infections, indicating household transmission. High-density amplicon sequencing was performed
on all available viral isolates from 10 households with secondary infections to assess relatedness between infections. Whole-genome sequences were assembled according
to the Wuhan reference genome, assigned to major clades, and then used for Bayesian phylogeny reconstruction. Index cases within each numbered household are in bold.
Household contacts are numbered sequentially starting with the index case number, eg, X-1, X-2. Minors are indicated with the letter “c” prior to the case number. Each
asterisk indicates 1 study week preceding a positive quantitative polymerase chain reaction (PCR) test, ie, * indicating a D7 positive test, ** indicating a D14 positive test,
and *** indicating a D21 positive test. Household contacts without asterisks were PCR-positive at baseline. Abbreviation: SARS-CoV-2, severe acute respiratory syndrome
coronavirus 2.
associations were not statistically significant. Though a slightly status, and confirmatory viral sequencing in a subset of house-
greater percentage of participants in households without sec- holds, we show that household transmission occurs in a sub-
ondary transmission reported wearing a mask at home in the stantial proportion of COVID-19–positive households, with
week prior to enrollment (22% vs 13% for index cases and racial-ethnic disparities in secondary attack rates and higher
30% vs 20% in HCs), these differences were not statistically risk of infection in more crowded households. Our data also
significant. suggest that those infected with a high viral load are not only
more likely to transmit virus to other household members but
they may seed other high viral load infections, putting the en-
DISCUSSION
tire household at higher risk for more severe illness.
Household transmission is one of the main drivers of the SARS- The incident SAR in this study was 32%, rising to 51% in mi-
CoV-2 pandemic. By incorporating timely recruitment of index nority households. While a meta-analysis of household trans-
cases, prospective sampling to 21 days regardless of symptom mission studies conducted in the first 6 months of the pandemic
6 • cid 2021:XX (XX XXXX) • Cerami et alTable 2. Potential Risk Factors for Severe Acute Respiratory Syndrome Coronavirus 2 Transmission From Index Cases
Household Trans- No Transmission, P
Index Cases All Indexes, n (%) mission, n (%) n (%) Value
60 (100) 32 (53) 28 (47) —
Age, years
50 8 (13) 3 (9) 5 (18)
Sex
Female 33 (55) 15 (47) 18 (64) NS
Male 27 (45) 17 (53) 10 (36)
Downloaded from https://academic.oup.com/cid/advance-article/doi/10.1093/cid/ciab701/6349288 by guest on 03 December 2021
Mask wearing at home prior to enrollment (missing n = 3) 10 (18) 4 (13) 6 (22) NS
Race-Ethnicity
White, non-Hispanic 34 (57) 13 (41) 21 (75) .01a
Black or African American 7 (12) 5 (16) 2 (7)
Other, non-Hispanic 4 (7) 4 (12) 0 (0)
Hispanic/Latinx 15 (25) 10 (31) 5 (18)
Symptom severity
Mild 12 (21) 4 (14) 8 (29) .07
Moderate/Severe 41 (72) 21 (72) 20 (71)
Hospitalized 4 (7) 4 (14) 0 (0)
Duration of symptoms at enrollment, median (IQR), days 5 (4–7) 5 (4–7) 6 (4–7) NS
Nasopharyngeal viral load (log10 copies/mL) at enrollment 8.3 (5.9–9.5) 8.8 (7.3–10.1) 7.4 (5.3–8.7) .03
(missing n = 6), median (IQR)
Comorbidities for adults aged >18 years (missing n = 1 for diabetes, n = 3 for obesity)
Diabetes 0 (0) 0 (0) 0 (0) NS
Obesity, body mass index >30 kg/m2 21 (42) 13 (50) 8 (33) NS
Education for adults aged >18 years (missing n = 3)
High school or less 21 (42) 13 (52) 8 (32) NS
College degree 17 (34) 9 (36) 8 (32)
Graduate degree 12 (24) 3 (12) 9 (36)
P values only reported if ≤ .10, otherwise noted as NS.
Abbreviations: IQR, interquartile range; NS, not significant.
a
Compares White, non-Hispanic vs all other categories.
(prior to circulation of new variants) found a much lower inequities rather than individual biological or behavioral char-
overall household SAR of 17% (95% CI, 14%–19%), it noted acteristics [22–25]. Our limited findings are consistent with this
significant heterogeneity between studies (ranging from 4% to explanation. While the sample size precluded full investigation
45%) and combined both retrospective studies based on contact of drivers of increased transmission in minority households, we
tracing data and prospective analyses [6]. As expected, prospec- found that high living density/household crowding was more
tive studies with increased frequency of testing regardless of common in non-White households, while viral load and re-
symptom status generally show higher infection rates [7]. In the ported masking in the home did not differ by race-ethnicity.
United States, a retrospective study in New York that included We also found that SARS-CoV-2 viral burden was correlated
household testing offered regardless of symptom status reported within households. Increased viral load increases infectivity
a SAR of 38% [17], while 2 prospective studies following house- in vivo [26]. A study of 282 clusters in Spain showed an in-
holds in Utah and Wisconsin (58 households, SAR 29%) [18] creased risk of transmission with shorter time to onset of symp-
and Tennessee and Wisconsin (101 households, SAR 53%) [10] toms among contacts as viral load of the index cases increased
also reported higher SARs. Altogether, these studies document [9]. Since greater viral burden (high viral load or lower cycle
high secondary household attack rates within US households. threshold values by PCR) is associated with disease severity
To our knowledge, this is the first study to show increased [27–30], our findings imply that when a person is hospitalized,
transmission in non-White US households. Though they expe- others in the same household may be at a higher risk for a sim-
rience similar case fatality rates, African American/Black and ilar outcome than would be predicted based on their individual
Hispanic populations in the United States experience dispro- risk factors alone. An inoculum effect may underlie this finding
portionately higher rates of SARS-CoV-2 infection [19–21]. [31] and also explain why secondary cases in households appear
These racial disparities are likely due to differences in healthcare to be overdispersed, with either most or all members infected,
access and exposure risk that are driven by systemic societal or none at all [6, 32, 33].
SARS-CoV-2 Transmission in US Households • cid 2021:XX (XX XXXX) • 7in our ability to do adjusted analyses beyond a simplistic explo-
ration of whether living density might account for the observed
racial disparity in SAR. In the households with multiple infected
household members at baseline, we cannot be certain that the
designated index case was the source of infection for all infected
household members. This may have affected our evaluation of
index case risk factors associated with transmission.
Additionally, we were unable to adequately assess the effects of
age, mask-wearing, and the presence of symptoms on transmission.
We recruited adult index cases, and in 38% of households, at least 1
Downloaded from https://academic.oup.com/cid/advance-article/doi/10.1093/cid/ciab701/6349288 by guest on 03 December 2021
household member (most often young children) declined to partic-
ipate. While mask use was queried, mask use prior to any COVID-
19 diagnosis in the household was not specifically elicited. All index
cases except 1 were tested because they were symptomatic.
In conclusion, SARS-CoV-2 transmits early and often among
household members. While masking, physical distancing, and
quarantining the whole household may reduce or prevent transmis-
Figure 4. Association of index NP viral load and transmission in the household. sion beyond the household, these strategies are less effective within
Households with secondary cases were more likely to have index cases with high the household, especially in the setting of high viral load infections
NP viral load compared with households without secondary transmission (median NP
viral load log 8.8 vs 7.4 copies/mL, respectively; P = .03). Index cases who were not
and crowded living spaces. Frequent point-of-care testing and post-
yet antibody-positive at enrollment, as a marker of more recent infection, are depicted exposure prophylaxis in those at risk for severe illness [34] and ul-
to the right in gray. Abbreviations: Ab+, antibody positive; NP, nasopharyngeal. timately widespread and equitable distribution of vaccines [35] are
needed to lessen the impact of COVID-19 within households and
This study has several limitations. First, although we enrolled vulnerable communities.
most households within 24 to 48 hours of a positive SARS-CoV-2 Supplementary Data
test result, delays in testing meant that it was common for others Supplementary materials are available at Clinical Infectious Diseases online.
in the household to be PCR-positive at enrollment. While 33 HCs Consisting of data provided by the authors to benefit the reader, the posted
met our end point as incident SARS-CoV-2 cases, 73 HCs were materials are not copyedited and are the sole responsibility of the authors, so
questions or comments should be addressed to the corresponding author.
infected at study baseline and hence could not be categorized de-
finitively as due to household transmission and were excluded Notes
Acknowledgments. The authors thank the wonderful COVID-19
from the analysis. Thus, we likely underestimated the true SAR,
Household Transmission Study participants, Moby and the HIV Clinical
and the resultant small sample size was not sufficient to investigate Trials Unit, and the University of North Carolina (UNC) Respiratory
all drivers of household transmission. We were similarly limited Diagnostic Center team. Thanks to Michelle Berrey, JoAnn Kuruc, and
Table 3. Potential Household-Level Risk Factors for Severe Acute Respiratory Syndrome Coronavirus 2 Transmission
Households All Households, n (%) Infected, n (%) Uninfected, n (%) P Value
60 (100) 32 (53) 28 (47) -
Household size, mean 3.8 4.2 3.4 .03
Living space (missing n = 3), sq ft
2000 28 (49) 12 (40) 16 (59)
Number of roomsa
2 or fewer 5 (8) 2 (6) 3 (10) .06
3–5 27 (45) 19 (59) 8 (29)
6 or more 28 (47) 11 (34) 17 (61)
More than 3 people and fewer than 6 rooms 15 (25) 13 (41) 2 (7) .003
Home ownership (missing n = 1)
Renting apartment 4 (7) 2 (7) 2 (7) NS
Renting home 17 (29) 11 (36) 6 (21)
Own home 38 (64) 18 (58) 20 (71)
P values only reported if ≤ .10, otherwise noted as NS.
Abbreviation: NS, not significant.
a
Number of rooms includes bedrooms, kitchen, and common rooms but not bathrooms or garage.
8 • cid 2021:XX (XX XXXX) • Cerami et alTable 4. Risk Factors for Severe Acute Respiratory Syndrome Coronavirus 2 Transmission in the Household
Adjusted
Susceptible House- Incident Sec- Secondary Household Odds Ratio
Index or Household Risk Factor hold Contacts ondary Cases Attack Rate (95% CI) Odds Ratio (95% CI) (95% CI)
Non-White 41 21 51% (33–69) 4.4 (1.5–13.0) 4.8
(1.5–15.4)
White, non-Hispanic 62 12 19% (10–35) -
Higher index nasopharyngeal viral loada - - - 3.5 (1.5–8.1) 3.6 (1.5–8.5)
High living densityb 29 15 52% (27–75) 3.3 (1.02–10.9) 1.4 (.4–4.6)
Not high living density 74 18 24% (15–37) -
Adjusted odds ratio adjusts for viral load as a continuous variable and race-ethnicity and living density as dichotomous variables.
Downloaded from https://academic.oup.com/cid/advance-article/doi/10.1093/cid/ciab701/6349288 by guest on 03 December 2021
Abbreviation: CI, confidence interval.
a
Odds ratio for 3 log10 increase in the index viral load (VL). For example, the odds of transmission in a household where the index VL is 1 × 10⁹ copies/mL is 3.5 times greater than in a
household where the index VL is 1 × 10⁶ copies/mL.
b
Defined as more than 3 people occupying fewer than 6 rooms.
Dania Munson for help with protocol writing and submission; Oksana SARS-CoV-2 infections: a living systematic review and meta-analysis. PLoS Med 2020;
Kharabora, Maureen Furlong, Amy James Loftis, Tia Belvin, and Dana 17:e1003346.
Swilley for help with study preparation and implementation; and Joe 9. Marks M, Millat-Martinez P, Ouchi D, et al. Transmission of COVID-19 in 282
clusters in Catalonia, Spain: a cohort study. Lancet Infect Dis 2021; doi: 10.1016/
Eron, Billy Fischer, and Ada Adimora for their input and support.
S1473-3099(20)30985-3.
Financial support. Research was supported by funds and charitable con-
10. Grijalva CG, Rolfes MA, Zhu Y, et al. Transmission of SARS-COV-2 infections
tributions from the UNC Department of Medicine (emergency funds to in households—Tennessee and Wisconsin, April-September 2020. MMWR Morb
principal investigator [PI] J. T. L., UNC School of Medicine), UNC COVID- Mortal Wkly Rep 2020; 69:1631–4.
19 Response Fund/Health Foundation (via UNC Health Foundation to PI 11. Muller MS, Chhetri SB, Basham C, et al. Practical strategies for SARS-CoV-2
J. T. L., UNC School of Medicine), a Gillings Innovations Laboratory Award RT-PCR testing in resource-constrained settings. medRxiv [Preprint]. 2021. doi:
funded by the 2007 Gillings Gift to UNC–Chapel Hill’s Gillings School 10.1101/2021.02.18.21251999.
of Global Public Health (to co-PIs K. A. P. and J. T. L.), and the National 12. Premkumar L, Segovia-Chumbez B, Jadi R, et al. The receptor binding domain of the
Center for Advancing Translational Sciences, National Institutes of Health, viral spike protein is an immunodominant and highly specific target of antibodies in
SARS-CoV-2 patients. Sci Immunol 2020; 5. doi: 10.1126/sciimmunol.abc8413.
through grant award UL1TR002489 (NC TrACs Pilot Funding Award to PI
13. Li Z, Yi Y, Luo X, et al. Development and clinical application of a rapid IgM-IgG
J. T. L.). L. P. reports grants as the co-investigator for NCI-U54 CA260543
combined antibody test for SARS-CoV-2 infection diagnosis. J Med Virol 2020;
and NC Collaboratory Fund. Trainees were supported by the National 92:1518–24.
Institute of Allergy and Infectious Diseases (NIAID; T32A1007151, K. T.) 14. COVID-19 IgM/IgG rapid test—BioMedomics Inc. Available at: https://www.
and the Infectious Diseases Society of America (T. R.). Rapid antibody tests biomedomics.com/products/infectious-disease/covid-19-rt/. Accessed 17
were provided by BioMedomics Inc, Morrisville, NC. February 2021.
Potential conflicts of interest. K. R. M. received grant support from Ridgeback 15. Naranbhai V, Chang CC, Beltran WFG, et al. High seroprevalence of anti-SARS-
Biotherapeutics LP (2020–2021) and has human immunodeficiency virus col- CoV-2 antibodies in Chelsea, Massachusetts. J Infect Dis 2020; 222:1955–9.
laborations unrelated to this study with Gilead Sciences (ongoing). L. P. reports 16. Korber B, Fischer WM, Gnanakaran S, et al. Tracking changes in SARS-CoV-2
spike: evidence that D614G increases infectivity of the COVID-19 virus. Cell
grants or contracts as co-investigator for NIAID (U01AI151788). All other au-
2020; 182:812–27.e19.
thors report no potential conflicts. All authors have submitted the ICMJE Form
17. Rosenberg ES, Dufort EM, Blog DS, et al. COVID-19 testing, epidemic features,
for Disclosure of Potential Conflicts of Interest. Conflicts that the editors con- hospital outcomes, and household prevalence, New York State—March 2020.
sider relevant to the content of the manuscript have been disclosed. Clin Infect Dis 2020. Available at: https://academic.oup.com/cid/advance-article-
abstract/doi/10.1093/cid/ciaa549/5831986. Accessed 13 September 2020.
REFERENCES 18. Lewis NM, Chu VT, Ye D, et al. Household transmission of SARS-CoV-2 in the
1. Report of the WHO-China Joint Commission on Coronavirus Disease United States. Clin Infect Dis 2020. doi: 10.1093/cid/ciaa1166.
2019 (COVID-19). Available at: https://www.who.int/docs/default-source/ 19. Mackey K, Ayers CK, Kondo KK, et al. Racial and ethnic disparities in COVID-
coronaviruse/who-china-joint-mission-on-covid-19-final-report.pdf. Accessed 19-related infections, hospitalizations, and deaths: a systematic review. Ann
16 February 2021. Intern Med 2020; doi: 10.7326/M20-6306.
2. Centers for Disease Control and Prevention. Public health guidance for 20. Lopez CA, Cunningham CH, Pugh S, et al. Disparities in SARS-CoV-2 seroprev-
community-related exposure. 2020. Available at: https://www.cdc.gov/ alence among individuals presenting for care in central North Carolina over a
coronavirus/2019-ncov/php/public-health-recommendations.html. Accessed 16 six-month period. medRxiv [Preprint]. 2021. doi: 10.1101/2021.03.25.21254320.
February 2021. 21. Brandt K, Goel V, Keeler C, et al. SARS-CoV-2 testing in North Carolina: racial,
3. He X, Lau EHY, Wu P, et al. Temporal dynamics in viral shedding and transmissi- ethnic, and geographic disparities. Health Place 2021; 69:102576.
bility of COVID-19. Nat Med 2020; 26:672–5. 22. Karmakar M, Lantz PM, Tipirneni R. Association of social and demographic
4. Tindale LC, Stockdale JE, Coombe M, et al. Evidence for transmission of COVID- factors with COVID-19 incidence and death rates in the US. JAMA Netw Open
19 prior to symptom onset. Elife 2020; 9. doi: 10.7554/eLife.57149. 2021; 4:e2036462.
5. Benefield AE, Skrip LA, Clement A, Althouse RA, Chang S, Althouse BM. SARS- 23. Poteat T, Millett GA, Nelson LE, Beyrer C. Understanding COVID-19 risks
CoV-2 viral load peaks prior to symptom onset: a systematic review and individual- and vulnerabilities among black communities in America: the lethal force of
pooled analysis of coronavirus viral load from 66 studies. bioRxiv [Preprint]. 2020. syndemics. Ann Epidemiol 2020; 47:1–3.
Available from: http://medrxiv.org/lookup/doi/10.1101/2020.09.28.20202028. 24. Holmes L, Enwere M, Williams J, et al. Black–White risk differentials in COVID-
6. Madewell ZJ, Yang Y, Longini IM Jr, Halloran ME, Dean NE. Household trans- 19 (SARS-COV2) transmission, mortality and case fatality in the United States:
mission of SARS-CoV-2: a systematic review and meta-analysis. JAMA Netw translational epidemiologic perspective and challenges. Int J Environ Res Public
Open 2020; 3:e2031756. Health 2020; 17:4322.
7. Fung HF, Martinez L, Alarid-Escudero F, et al. The household secondary attack 25. Rogers TN, Rogers CR, VanSant-Webb E, Gu LY, Yan B, Qeadan F. Racial dispar-
rate of severe acute respiratory syndrome coronavirus 2 (SARS-CoV-2): a rapid ities in COVID-19 mortality among essential workers in the United States. World
review. Clin Infect Dis 2020. Available at: https://academic.oup.com/cid/advance- Medi Health Policy 2020; 12:311–27.
article-abstract/doi/10.1093/cid/ciaa1558/5921151. Accessed 21 February 2021. 26. Hou YJ, Chiba S, Halfmann P, et al. SARS-CoV-2 D614G variant ex-
8. Buitrago-Garcia D, Egli-Gany D, Counotte MJ, et al. Occurrence hibits efficient replication ex vivo and transmission in vivo. Science 2020;
and transmission potential of asymptomatic and presymptomatic 370:1464–8.
SARS-CoV-2 Transmission in US Households • cid 2021:XX (XX XXXX) • 927. Maltezou HC, Raftopoulos V, Vorou R, et al. Association between upper res- 31. Silvia Munoz-Price L, Rivera F, Ledeboer N. Air contamination of households
piratory tract viral load, comorbidities, disease severity and outcome of versus hospital inpatient rooms occupied by SARS-CoV-2 positive patients. Infect
patients with SARS-CoV-2 infection. J Infect Dis 2021; doi: 10.1093/infdis/ Control Hosp Epidemiol 2021; 1–5. doi: 10.1017/ice.2021.45.
jiaa804. 32. Ladhani SN, Andrews N, Aiano F, et al. Secondary attack rate and family clus-
28. Magleby R, Westblade LF, Trzebucki A, et al. Impact of SARS- tering of SARS-CoV-2 infection in children of healthcare workers with confirmed
CoV-2 viral load on risk of intubation and mortality among hospital- COVID-19. Clin Infect Dis 2020; doi: 10.1093/cid/ciaa1737.
ized patients with coronavirus disease 2019. Clin Infect Dis 2020; doi: 33. Paul LA, Daneman N, Brown KA, et al. Characteristics associated with household
10.1093/cid/ciaa851. transmission of SARS-CoV-2 in Ontario, Canada: a cohort study. Clin Infect Dis
29. Liu Y, Yan LM, Wan L, et al. Viral dynamics in mild and severe cases of COVID- 2021; doi: 10.1093/cid/ciab186.
19. Lancet Infect Dis 2020; 20:656–7. 34. Hurt AC, Wheatley AK. Neutralizing antibody therapeutics for COVID-19.
30. Fajnzylber J, Regan J, Coxen K, et al; Massachusetts Consortium for Viruses 2021; 13. doi: 10.3390/v13040628.
Pathogen Readiness. SARS-CoV-2 viral load is associated with in- 35. Harris RJ, Hall JA, Zaidi A, Andrews NJ, Dunbar JK, Dabrera G. Effect of vaccina-
creased disease severity and mortality. Nat Commun 2020; tion on household transmission of SARS-CoV-2 in England. N Engl J Med 2021;
11:5493. doi: 10.1056/NEJMc2107717.
Downloaded from https://academic.oup.com/cid/advance-article/doi/10.1093/cid/ciab701/6349288 by guest on 03 December 2021
10 • cid 2021:XX (XX XXXX) • Cerami et alYou can also read