Phytophagous hoverflies (Diptera: Syrphidae) as indicators of changing landscapes
←
→
Page content transcription
If your browser does not render page correctly, please read the page content below
Community Ecology 18(3): 287-294, 2017
1585-8553 © Akadémiai Kiadó, Budapest
DOI: 10.1556/168.2017.18.3.7

Phytophagous hoverflies (Diptera: Syrphidae) as indicators of
changing landscapes*

S. Popov1,6, M. Miličić2,3, I. Diti4,5, O. Marko2, D. Sommaggio4, Z. Markov1
and A. Vujić1
1Department  of Biology and Ecology, University of Novi Sad, Trg Dositeja Obradovića 2, 21000 Novi Sad, Serbia
2BioSense Institute - Research Institute for Information Technologies in Biosystems, University of Novi Sad,
Trg Dr Zorana Đinđića 1, 21000 Novi Sad, Serbia
3Finnish Museum of Natural History, Zoology Unit, University of Helsinki, Pohjoinen Rautatiekatu 13,

00100 Helsinki, Finland
4Department of Agricultural Sciences, University of Bologna, Viale G. Fanin 42, 40127 Bologna, Italy
5Department of Sustainable Crop Production, Università Cattolica del Sacro Cuore, 29100 Piacenza, Italy
6Corresponding author. Fax: (+381) 21450 620; E-mail: snezana.jovicic@dbe.uns.ac.rs

Keywords: Bioindicators, Connectivity, Cheilosia, Insects, Land cover change, Landscape structure, Merodon, Species rich-
ness.
Abstract: Spatial and temporal differences in landscape patterns are of considerable interest for understanding ecological pro-
cesses. In this study, we assessed habitat quality by using the Syrph The Net database and data on decreasing species richness
over a 25-year period for the two largest phytophagous hoverfly genera (Merodon and Cheilosia). Furthermore, within this
time frame, we explored congruence between ecological responses (species richness and Biodiversity Maintenance Function
for these two genera) and landscape structural changes through correlation analysis. Our results indicate that landscapes have
experienced changes in aggregation, isolation/connectivity and landscape diversity, with these parameters being significantly
correlated with Cheilosia species richness loss and habitat quality. We conclude that the genus Cheilosia is a good bioindicator
that can highlight not only the current quality of an area but also temporal changes in landscape patterns.
Nomenclature: Meigen (1803) for genus Merodon and Meigen (1822) for genus Cheilosia.
Abbreviations: BDMF–biodiversity maintenance function; CONN–Connectance Index; CONTAG–Contagion Index; DIV–
Landscape Division Index; ENN–Euclidean Nearest-Neighbor Distance; FRAC–Fractal Dimension Index; GYR–Radius of
Gyration; LPI–Large Patch Index; LSI–Landscape Shape Index; PRD–Patch Richness Density; SHDI–Shannon’s Diversity
Index; SHEI–Shannon’s Evenness Index; StN–Syrph The Net database.

Introduction                                                            identify bioindicator taxa that can reflect broad-scale impacts
                                                                        and exhibit measurable responses to different changes in the
     Global biodiversity is constantly being eroded as a conse-         environment. Although species level is the most often con-
quence of human-induced pressures (Pimm 1995). One such                 sidered taxonomic resolution, genus-level indicators could
pressure is landscape change (Foley et al. 2005, Tscharntke et          have significant values. Due to the specific larval food type of
al. 2005). Besides biotic and abiotic parameters, human influ-          phytophagous genera, one can assume that the whole genera
ence has been determined as one of the main factors shap-               could be sensitive to changes in the environment and would
ing landscape patterns (Rackham 1998, Moser et al. 2002).               have timely and measurable responses to these changes.
Disturbance of those patterns influences multiple ecological                 Landscape structure is a key element of our understand-
processes, thereby affecting both ecosystem functions and               ing of species diversity (Walz 2011) and it has been proven
species within ecosystems (With 1997). In order to alleviate            to significantly influence insect communities (Didham et al.
the negative consequences of landscape disturbances and to              1996). Different landscape features (such as isolation of habi-
preserve imperiled species and areas, varying conservation              tat fragments, patch area, patch quality, ratio of habitat edge
measures have to be applied. However, due to limited resourc-           to interior, etc.) affect insect richness and abundance in space.
es for conservation action, proper estimation of conservation           Thus, it is clear that insects can be used to assess changes in
priorities is needed (Faith 1992). Therefore, it is crucial to          landscapes across time (Hunter 2002).
* The Student Conference on Conservation Science (SCCS) is organized each year in several locations, Tihany at the Lake Balaton in Hungary
being one of them. Since 2016, Community Ecology offers a prize at SCCS Tihany for the best presentation in the field of community ecology.
An independent jury awards the prize that is an invitation to submit a manuscript to the journal. This is the paper of the SCCS Tihany’2017
Awardee, Snezana Popov.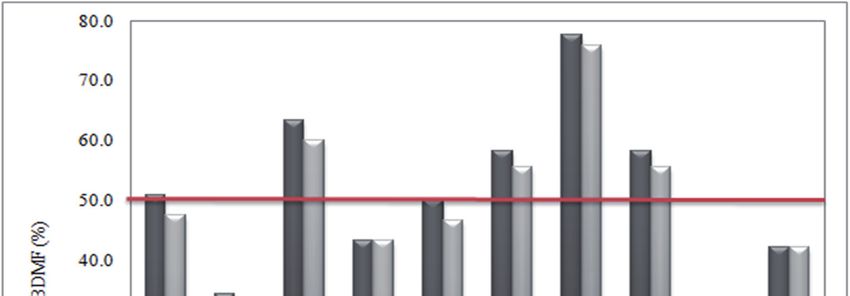
288								                                                                                                              Popov et al.

Table 1. Research study sites: GPS coordinates and summary of landscape characteristics.

       Sites            Coordinates                                    Landscape matrix                    Type of Landscape
         1     N44°0'55.48 E21°52'54.77              Broadleaf forest (Quercus & Fagus)                       Low mountain
         2     N44°0'47.12 E21°55'32.81              Broadleaf forest (Quercus & Fagus)                       Low mountain
         3     N44°1'43.59 E21°57'29.33              Broadleaf forest (Quercus)                               Low mountain
         4     N44°1'1.22 E21°57'35.77               Broadleaf forest (Quercus)                               Low mountain
         5     N45°10'44.22E 19°51'55.54             Broadleaf forest (Quercus)                               Low mountain
         6     N43°16'39.11 E20°46'32.24             Conifer forest (Picea)                                  High mountain
         7     N43°21'15.38 E20°44'40.33             Conifer forest (Picea) & Broadleaf forest (Fagus)       High mountain
         8     N43°19'22.80 E20°44'57.84             Conifer forest (Picea)                                  High mountain
         9     N43°19'0.64 E22°48'5.98               Conifer forest (Picea)                                  High mountain
        10     N43°14'1.79" E22°46'53.35             Broadleaf forest (Fagus) & Conifer forest (Picea)       High mountain

     In our study, we focused on the Syrphidae; a Dipteran            Isaac et al. 2009), implying that these species will exhibit
insect family. Around 6000 hoverfly species have been de-             rapid and measurable responses to landscape changes.
scribed worldwide to date (Pape et al. 2011). They mainly feed            Jovičić et al. (2017) showed that landscape structure and
on pollen and nectar and are considered the second-most sig-          land use patterns affect both Cheilosia and Merodon species.
nificant group of pollinators after bees (Petanidou et al. 2011).     Here, we investigate (i) the effects of landscape structural
In order to ensure the persistence of these species in Serbia,        change on Merodon and Cheilosia species richness at both
keystone habitats (PHA-Prime Hoverfly Area) were assigned             spatial and temporal scales, and (ii) the bioindicator potential
(Vujic at al. 2016), while Miličić et al. (2017) conducted area       of these species using BDMF calculated for data spanning 25
prioritization for Southeast Europe based on distribution and         years. To fulfill our objectives, we assess whether there have
vulnerability of hoverflies. Their role as a bioindicator has         been shifts in the communities of these two hoverfly genera
been particularly recognized through the development of the           and, if so, we test whether these shifts are associated with
Syrph The Net (StN) database, representing an expert sys-             changes in landscape structure.
tem for analyzing and evaluating hoverfly communities. The
“biodiversity maintenance function” (BDMF) can be used as
                                                                      Material and methods
an estimate of site quality and is calculated by comparing the
expected biodiversity within a habitat type on a site with its
observed biodiversity. BDMF is the main output of StN and             Data on hoverfly species richness
represents the ratio between the observed number of species
to the total number predicted by StN (Speight 2008). Lists of              Hoverfly species distributions throughout Serbia have
predicted species can be generated by considering regional            been investigated regularly over the last 35 years. The Faculty
lists of species and matching the habitat preferences of each         of Science of the University of Novi Sad, Serbia, hosts an in-
species to the habitats available at a given site (Speight and        ternal database comprising a large amount of geo-referenced
Castella 2001). Numerous studies have successfully used               data on hoverfly species presence. For the purposes of this
this database for habitat evaluations, confirming the poten-          study, we selected 10 sites from the database (Table 1), which
tial of hoverflies as bioindicators (Speight and Castella 2001,       were recently surveyed by the authors over a 4-year period
Sarthou et al. 2005, Velli et al. 2010, Sommaggio and Burgio          (2011–2014). Sites were chosen by experts based on knowl-
2014). However, unlike the previous studies assessing the             edge about the ecological preferences of species from the
bioindicator role of syrphids based only on present informa-          genera Merodon and Cheilosia. A detailed description of the
tion, in this study we examine the changes over time both in          sites and all of their macrohabitats can be found in Jovičić et
landscape structure and in species richness. Specifically, we         al. (2017).
targeted the two largest European hoverfly genera, Cheilosia               Specimens were counted during peak flight periods, from
Meigen, 1822 and Merodon Meigen, 1803. These genera                   April to the end of August, using entomological netting. The
have been the focus of numerous field surveys in Serbia over          StN database consists of information on adult hoverfly spe-
the last 35 years, so their distributions and habitat preferences     cies collected using Malaise traps. However, a major limita-
are well known (Vujić, pers. comm.). Additionally, species of         tion of using Malaise traps for sampling hoverflies is that they
these two genera can be considered specialists, having lar-           are often vandalized or damaged by grazing animals (Speight
vae that are phytophagous and often linked to a specific plant        et al. 2000). We chose to use entomological netting as a sam-
genus or species (Rotheray and Gilbert 2011). It is widely            pling method for our study instead of Malaise traps for two
acknowledged that specialized species are more sensitive to           reasons. First, for a large number of our sites, we could not
environmental change than generalists (O’Grady et al. 2004,           adequately protect Malaise traps. Secondly, data in our inter-
                                                                      nal database for the period 1990-2010 were collected using
Indicators of landscape changes 289
Table 2. Landscape metrics used to quantify landscape structure and to assess landscape structural change; calculated in Fragstat.
GroupType Landscape metrics Description
Measure of patch extent; it describes how far across the landscape a
Area & edge Radius of Gyration (GYR)*
patch extends its reach.
Index of dominance that equals the percentage of landscape
Shape Large Patch Index (LPI)*
comprised by the largest patch
Fractal Dimension Index (FRAC) Describes the complexity of a patch's perimeter.
Index measuring the degree of clumping of attributes on raster
Aggregation Contagion Index (CONTAG)*
maps.
Describes the regularity of landscape patches in the considered
Landscape Shape Index (LSI)*
landscape
Subdivision Landscape Division Index (DIV)* Describes how much the landscape is subdivided into patches.
Patch Richness Density (PRD)* Measure of landscape diversity.
Diversity
Describes the proportion of the landscape occupied by a certain
Shannon's Evenness Index (SHEI)*
class.
Describes how many patches of the same type are dispersed in the
Shannon's Diversity Index (SHDI)
landscape.
Isolation Euclidean Nearest-Neighbor Distance (ENN)* Quantifies patch isolation.
Describes connectivity between patches of the same class.
Connectance Index (CONN)
entomological nets. Thus, in order to compare our findings for each of the 10 analyzed sites. We adopted a threshold of
among years, we decided to use the same sampling method. 50% to indicate sites of good conservation status. Thus, if
Additionally, entomological netting is considered to be more less than 50% of expected species were recorded for a given
efficient than Malaise traps (Marcos-García et al. 2012). site (BDMF < 50%), it may be considered degraded (Speight
et al. 2000), whereas BDMF > 50% indicates sites with good
Data on landscape structural change habitat quality.
Landscape structural change was evaluated using GIS Correlations among ecological and landscape variables
tools and relevant ecological software. We based our anal-
ysis on CORINE land cover maps in vector format from Our dataset was comprised of ecological (Merodon
1990, 2006 and 2012, using the ArcGIS software package and Cheilosia species richness and BDMF) and landscape
(ArcGIS10, ESRI). We established circular zones with radii variables [Radius of Gyration (GYR), Large Patch Index
of 2 km and 5 km around each site. The Fragstat 4.2 software (LPI), Fractal Dimension Index (FRAC), Contagion Index
(McGarigal et al. 2002) was used to calculate landscape met- (CONTAG), Landscape Shape Index (LSI), Landscape
rics based on prepared maps that had previously been con- Division Index (DIV), Patch Richness Density (PRD),
verted into ERDAS raster format (15 m/pixel). In total, we Shannon’s Evenness Index (SHEI), Shannon’s Diversity
selected 11 landscape metrics aimed at describing landscape Index (SHDI), Euclidean Nearest-Neighbor Distance (ENN),
structure and change over 25 years, three of which were based Connectance Index (CONN)]. We had two data points for the
on previous research on the influence of landscape structure ecological parameters, i.e., for periods 1990-2006 and 2006-
on Merodon and Cheilosia communities (Jovičić et al. 2017) 2014, and three data points for landscape parameters, i.e., for
and further eight metrics were added (Table 2; indicated with individual years 1990, 2006 and 2014. In order to bring two
asterisks) because we assumed that over longer time periods sets of parameters to the common time-frame, we calculated
they would influence species richness of the two investigated the landscape parameters for the periods for which we had
genera. the measurements of ecological parameters (1990-2006 and
2006-2014). We did this by calculating the average value for
Data analysis each period:
1) p(1990 + p2006)/2;
Syrph The Net analysis
2) p(2006 + p2012)/2
A detailed description of the process of calculating BDMF where p stands for parameter value.
can be found in Speight et al. (2000).We calculated BDMF290 Popov et al.
To test whether there was a relationship between chang- However, this trend was reversed for the following years (an
ing landscape parameters over the 25-year time-frame and the average value of –7.5% for 2006-2014), with the lowest value
three ecological parameters, we calculated the correlation be- at site 5 where urbanization is more pronounced. We found
tween the corresponding columns from the first and the sec- the same trend for the DIV index. One of the most widely
ond matrix. Kolmogorov-Smirnov test showed that there was used landscape metrics in landscape ecology, Shannon’s
a large and significant distance between the normal distribu- Diversity Index, indicated a decrease in dispersion of patches
tion and empirical distribution function of the three ecological across the investigated landscapes.
parameters (all p < .001). This means that we can assume with
a high certainty that the samples are not normally distributed. Analysis of changes in species richness and site quality
Hence, the use of Pearson correlation is not appropriate and (BDMF) over 25 years
Spearman’s rank correlation was used instead. The result-
ing correlations, calculated in MATLAB, are given in Table In percentage terms, the greatest decrease in species rich-
3, where all statistically significant results are indicated by ness in both genera for the period 1990-2014 was observed at
asterisks. sites 1, 2, and 5 (Fig. 1, Electronic Appendix A2). The great-
est decrease in Merodon species richness was recorded at site
Results 8, whereas the genus Cheilosia suffered the greatest decrease
in species richness at site 2. The only site where no change in
Landscape structural change over 25 years species richness was observed was site 4.
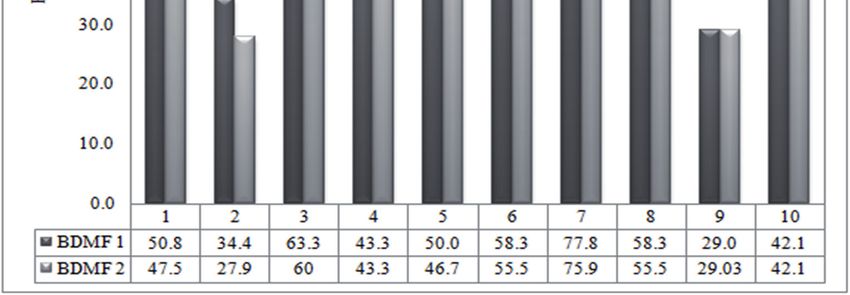
Mean BDMF for the first period (BDMF1; 1990-2006)
We found interesting trends regarding landscape structur- was 50.7%; the highest mean value was observed for site 7
al change for the first time period (1990-2006). Within the 2 (77.8%), whereas the lowest mean value was found for site
km buffer, an increase in the LPI and LSI indices indicated a 9 (29%). All BDMF1 and BDMF2 values (2006-2012) are
simplification of landscape patches (Appendix 1). The larger presented in Figure 2. According to the BDMF classification,
and more symmetric patches, together with the higher com- currently six sites can be considered as degraded habitats,
plexity of patch perimeter shapes (decreased FRAC index), with BDMF values < 50% (sites 1, 2, 4, 5, 9 and 10), whereas
confirm that over this period patches became more regular in three sites can be classed as “good quality” habitats (3, 6 and
shape. Moreover, within the 5 km buffer areas, the CONTAG 8) with BDMF values ranging between 50 and 74%. Only
and CONN metrics exhibited negative trends, signifying that one site (7) presented a value > 75%, indicating the highest
similar patches became less connected. The different CONN habitat quality.
values between the 2 and 5 km buffers indicate different land-
scape patterns at these two scales; the 2 km buffers manifest Correlations among ecological and landscape variables
higher connectivity (a mean of approximately 70%), where-
as connectivity was approximately 40% for the 5 km buff- Our results showed differences in correlation patterns
ers. Our data also revealed an increase in the LSI index for between changes in landscape variables and species richness
1990-2006, with an average value of +6.4% indicating an in- of the two genera (Tables 3 and 4). Although there was no
crease in the regularity of landscape patterning in this period. correlation between Merodon species richness and landscape
1 2 3 4 5 6 7 8 9 10
0,0
0,0 0,0 0,0 0,0 0,0 0,0 0,0 0,0
-3,2 -3,3 -3,9
-10,0 -8,3 -6,7 -6,7
-11,1 -10,7
-15,0
-20,0
Cheilosia (%)
-30,0 Merodon (%)
-33,3
-40,0 -37,5
-50,0
-50,0
-60,0
Figure 1. Observed change in percentage for Merodon and Cheilosia species richness based on the ten study sites, between 1990-
2014.
Figure 1. Observed percentage change in Merodon and Cheilosia species richness during the period 1990-
2014 for ten study sites (1-10).Indicators of landscape changes 291
Table 3. Correlations among ecological (Cheilosia and Merodon species richness and BDMF) and landscape variables [Radius of
Gyration (GYR), Large Patch Index (LPI), Fractal Dimension Index (FRAC), Contagion Index (CONTAG), Landscape Shape Index
(LSI), Landscape Division Index (DIV), Patch Richness Density (PRD), Shannon’s Evenness Index (SHEI), Shannon’s Diversity Index
(SHDI), Euclidean Nearest-Neighbor Distance (ENN), Connectance Index (CONN)].
LPI LSI GYR FRAC ENN CONTAG CONN DIV PRD SHI SHEI
Cheilosia -0.470 0.683* 0.128 0.329 0.195 0.067 0.689* 0.433 -0.604 0.098 -0.018
Merodon -0.464 0.212 0.369 0.505 -0.055 0.225 0.615 0.553 -0.137 0.355 -0.225
BDMF -0.390 0.232 0.591 0.567 0.183 0.067 0.726* 0.396 -0.707* 0.159 0.006
*p292 Popov et al.
changes, Cheilosia species richness proved to be significantly frame we considered. The strong positive correlation most li-
positively correlated to LSI (r = 0.683, p < 0.05), and CONN kely indicates that loss of connectivity in the landscape is the
(r = 0.689, p < 0.05). Additionally, BDMF was strongly and main cause of habitat quality degradation, ultimately leading
positively correlated to CONN (r = 0.726, p < 0.05), and to loss of species. However, this outcome primarily relates
negatively correlated to PRD (r = –0.707, p < 0.05). It is also to the genus Cheilosia, since a statistically significant positi-
worth noting that spatial scale influenced the response of all ve correlation was found between Cheilosia species richness
investigated ecological parameters since statistical signifi- and CONN, but not between Merodon species richness and
cance was only observed at the smaller spatial scale (2 km), CONN. The effects of landscape structure on different insect
while on 5 km scale parameters did not show statistically sig- pollinator groups vary according to species mobility and for-
nificant correlations. aging behavior (Steffan - Dewenter et al. 2002), clearly high-
lighting the response as being taxon-specific (Jovičić et al.
Discussion 2017). Given the fact that connectivity is a key concept relat-
ing to the ecological effects of environmental change, future
research should include more detailed methods for quantify-
Influence of landscape variables on hoverflies over
ing the network connectivity of landscapes mosaics, i.e., the
25 years
Harary index (Ricotta et al. 2006).
Our analysis revealed quantitative changes in landscape
structure over a 25-year period, as well as significant hover- Bioindicator role of hoverflies
fly species richness loss during this time frame. Landscape
Due to its inherent complexity, biodiversity cannot be
changes can be driven by quite distinct sets of factors (Koomen
easily measured so appropriate descriptors (surrogates, indi-
et al. 2007). SHDI, one of the most widely-used metrics in
cators) need to be selected (Schindler et al. 2012). Here, we
landscape pattern analysis, characterizes landscape composi-
tested the bioindicator role of two phytophagous hoverfly ge-
tion in terms of diversity at the landscape level. Values of
nera by utilizing the StN database and BDMF values to assess
this metric for the 2 and 5 km buffer zones, together with
habitat quality. A decrease of 9.25% for the mean value of
CONTAG values, revealed an overall decrease in dispersion
BDMF across all sites over the last 25 years indicates decre-
of the investigated sites, probably due to reduced fragmen-
ased site quality. We found that sites belonging to both the
tation. Two components contribute to calculations of SHDI:
“degraded” and “good quality” categories exhibited quality
richness (defined as the number of different patch types)
degradation. For example, two sites (1 and 5) were down-
and evenness in the distribution of areas among patch types
graded from being good quality to degraded sites. These si-
(Eiden et al. 2017). Previous studies have documented the
tes have been affected by agricultural activities, which could
potential of SHDI to explain contemporary hoverfly species
contribute to habitat disturbance and, consequently, impact
richness (Földesi et al. 2015, Jovičić et al. 2017). However,
species richness (loss). In particular, expansion of agricultural
the results of the present study showed no significant relation-
fields at the expense of forests has had a negative impact on
ship between this landscape variable and species richness, nor
species of Cheilosia. Moreover, site 5 has undergone urbani-
between SHDI and BDMF over the 25-year study time frame.
zation, which can strongly influence its capacity to support
Heterogeneous land cover types can increase hoverfly spe-
hoverfly assemblages. Our StN analysis of these two taxo-
cies richness (Büchs 2003), but if increased landscape het-
nomic groups provides insights into the relationship between
erogeneity involves an increase in the number of habitats that
the species richness of these two genera and landscape struc-
are not suitable for hoverflies, heterogeneity in itself will not
tural change. We conclude that due to its sensitivity, the genus
support hoverfly macro-habitat requirements. Another mea-
Cheilosia could be used as an effective indicator of landsca-
sure of landscape diversity used in our analysis was PRD.
pe change over long time periods. Moreover, a recent stu-
The negative correlation between PRD and BDMF confirms
dy by Radenković et al. (2017) confirms a higher sensitivity
that an understanding of biology and ecology of bioindica- of the genus Cheilosia to environmental changes; the genus
tors is of utmost importance in landscape analyses, and that Cheilosia would be more negatively affected by future cli-
the selection of landscape parameters and their interpretation mate change than Merodon on the Balkan Peninsula. Meyer
almost always depends on species preferences. The influence et al. (2009) found that land-use change differentially affects
of landscape diversity on hoverfly species richness has rarely hoverfly species depending on their specific larval feeding
been studied through the lens of historical ecology, so addi- habits as well as their microhabitats. Modified ecosystems
tional research is needed to better understand its effects. can support better Merodon species due to the availability of
LSI is a landscape shape index, values of which increase their larval host plants (Jovičić et al. 2017). On the contrary,
with increasing shape irregularity and disaggregated areas Cheilosia species are sensitive to environmental disturbance,
within the landscape. This index was positively related to especially of forests. Undisturbed forest habitats enable them
Cheilosia species richness, but did not significantly influence to have continuity of the microclimate they prefer. If the mi-
the response of the genus Merodon nor BDMF over the 25- croclimate changes, species may become endangered.
year period. It is important to underline that hoverflies are a diverse
Our correlation analysis revealed a strong relationship taxon, constituted by genera with different ecological re-
between BDMF and the CONN parameter during the time quirements (Sommaggio 1999, Rotheray and Gilbert 2011).Indicators of landscape changes 293
Extending this type of analysis to all genera in the family Isaac, J.L., J. Vanderwal, C.N. Johnson and S.E. Williams. 2009.
Syrphidae could be useful, especially if taxa with trophic Resistance and resilience: quantifying relative extinction risk
characteristics other than phytophagy are considered. The in a diverse assemblage of Australian tropical rainforest verte-
brates. Divers. Distrib. 15:280–288.
use of functional traits rather than numbers of species seems
to be more useful for assessing the conservation of habitats Jovičić, S., G. Burgio, I. Diti, D. Krašić, Z. Markov, S. Radenković
and A. Vujić. 2017. Influence of landscape structure and land
(Moretti et al. 2009, Vandewalle et al. 2010). Our research
use on Merodon and Cheilosia (Diptera: Syrphidae): contrasting
confirms StN as a useful tool for detecting differences be- responses of two genera. J. Insect Conserv. 21:53–64.
tween sites, including capturing the effect of changes in land-
Koomen, E., J. Stillwell, A. Bakema and H.J. Scholten. 2007.
scape complexity over a long period of time. Modelling Land-Use Change. Springer Netherlands. CITY
Our study confirms that spatio–temporal patterns of land- Marcos-García, M.A., A. Garcia-Lopez, M.A. Zumbado and G.E.
scape change need to be considered when planning for con- Rotheray. 2012. Sampling methods for assessing syrphid bio-
servation management activities (Senapathi et al. 2015). We diversity (Diptera: Syrphidae) in tropical forests. Environ.
conclude that shifts in hoverfly assemblages occur in those Entomol. 41:1544–52.
landscapes that have experienced the greatest change in vari- McGarigal, K., S.A. Cushman, M.C. Neel and E. Ene. 2002.
ous landscape characteristics, such as aggregation, isolation/ FRAGSTATS: Spatial Pattern Analysis Program for Categorical
Maps. Computer software program produced by the authors at
connectivity and diversity. Consequently, we have confirmed
the University of Massachusetts, Amherst. Available from: http://
the bioindicator role of hoverflies through the patterns our www.umass.edu/ landeco/research /fragstats/ fragstats.html
data have revealed. Thus, we recommend that the landscape
Meigen, J.W. 1803. Versuch einer neuen Gattungs-Eintheilung der
metrics that best describe these patterns, together with the europaischen zweiflugligen Insekten. Mag. Insektenkd. 2:259–
StN database, be used as management tools in conservation 281.
management strategies to ensure the sustainable conservation Meigen, J.W. 1822. Systematische Beschreibung der bekannten
of hoverfly diversity. europaischen zweiflugeligen Insekten. Dritter Theil. Schulz-
Wundermann, Hamm. x + 416 pp.
Acknowledgements: We kindly thank J. O’Brien for English Meyer, B., Jauker, F. and Steffan-Dewenter, I. 2009. Contrasting re-
proofreading and Dr G. Burgio for contributions while devel- source-dependent responses of hoverfly richness and density to
oping the original idea of this study. This work was supported landscape structure. Basic and Appl. Ecol. 10, 178–186.
by the Ministry of Education, Science and Technological Miličić, M., A. Vujić, T. Jurca and P. Cardoso. 2017. Designating con-
Development, Republic of Serbia, under Grant No. 173002 servation priorities for Southeast European hoverflies (Diptera:
and Grant No. 43002, the Provincial Secretariat for Science Syrphidae) based on species distribution models and species vul-
and Technological Development under Grant No. 114–457– nerability. Insect Conserv. Divers. 10, 354–366.
2173/2011–01, and H2020 project ANTARES under Grant Moretti, M., F. de Bello, S.P.M. Roberts, S.G. Potts. 2009.
No. 664387. Taxonomical vs. functional responses of bee communities to fire
in two contrasting climatic regions. J. Anim. Ecol. 78:98–108.
Moser, D., H.G. Zechmeister, C. Plutzar, N. Sauberer, T. Wrbka and
References G. Grabherr. 2002. Landscape patch shape complexity as an ef-
fective measure for plant species richness in rural landscapes.
Büchs, W. 2003. Biodiversity and agri-environmental indicators-gen- Landsc. Ecol. 17:657–669.
eral scopes and skills with special reference to the habitat level. O’Grady, J. J., D.H. Reed, B.W. Brook and R. Frankham. 2004.
Agric. Ecosyst. Environ. 98:35–78. What are the best correlates of predicted extinction risk? Biol.
Didham, R.K., J. Ghazoul, N.E. Stork and A.J. Davis. 1996. Insects Conserv. 118:513–520.
in fragmented forests: a functional approach. Trends Ecol. Evol. Pape, T., V. Blagoderov and M.B. Mostovski. 2011. Order Diptera
11:255–260. Linnaeus, 1758. In: Z.Q. Zhang (ed.), Animal Biodiversity: An
Eiden, G., M. Kayadjanian and C. Vidal. 2017. Capturing landscape Outline of Higher-level Classification and Survey of Taxonomic
structures: Tools. (retrieved September 10, 2017 from http:// Richness. Magnolia Press, Auckland, New Zealand. pp. 222–229.
ec.europa.eu/agriculture/publi/landscape/ch1.htm). Petanidou, T., A. Vujić and W.N. Ellis. 2011. Hoverfly diversity
Faith, D.P. 1992. Conservation evaluation and phylogenetic diversity. (Diptera: Syrphidae) in a Mediterranean scrub community near
Biol. Conserv. 61:1–10. Athens, Greece. Ann. Soc. Entomol. Fr. 47:168–175.
Földesi, R., A. Kovács-Hostyánszki, Á. Kőrösi, L. Somay, Z. Elek, Pimm, S.L., G.J. Russell, J.L. Gittleman and T.M. Brooks. 1995. The
V. Markó, M. Sárospataki, R. Bakos, Á. Varga, K. Nyisztor and future of biodiversity. Science 269:347–350.
A. Báldi. 2015. Relationships between wild bees, hoverflies and Rackham, O. 1998. Savanna in Europe. In: K.J. Kirby and C. Watkins
pollination success in apple orchards with different landscape (eds.), The Ecological History of European Forests. Cambridge
contexts. Agric. For. Entomol. 18:68–75. University Press, Cambridge, UK. pp. 1–24.
Foley, J.A., R. DeFries, G.P. Asner, C. Barford, G. Bonan, S.R. Radenković, S., O. Schweiger, D. Milić, A. Harpke and A. Vujić.
Carpenter, F.S. Chapin, M.T. Coe, G.C. Daily, H.K. Gibbs, 2017. Living on the edge: Forecasting the trends in abun-
J.H. Helkowski, T. Holloway, E.A. Howard, C.J. Kucharik, dance and distribution of the largest hoverfly genus (Diptera:
C. Monfreda, J.A. Patz, I.C. Prentice, N. Ramankutty and Syrphidae) on the Balkan Peninsula under future climate change.
P.K. Snyder. 2005. Global consequences of land use. Science Biol. Conserv. 212:216–229.
309:570–574. Ricotta, C., A. Stanisci, G.C. Avena and C. Blasi. 2000. Quantifying
Hunter, M.D. 2002. Landscape structure, habitat fragmentation, and the network connectivity of landscape mosaics: a graph-theoret-
the ecology of insects. Agric. For. Entomol. 4:159–166. ical approach. Community Ecol. 1:89–94.294 Popov et al.
Rotheray, G.E. and F. Gilbert. 2011. The Natural History of tion and biodiversity-ecosystem service management. Ecol. Lett.
Hoverflies. Forrest Text, Ceredigion, Wales, UK. 8:857–874.
Sarthou, J., A. Ouin, F. Arrignon, G. Barreau and B. Bouyjou. 2005. Vandewalle, M., F. De Bello, M.P. Berg, T. Bolger, S. Dolédec, F.
Landscape parameters explain the distribution and abundance Dubs, C.K. Feld, R. Harrington, P.A. Harrison, S. Lavorel, P.
of Episyrphus balteatus (Diptera: Syrphidae). Eur. J. Entomol. Martins Da Silva, M. Moretti, J. Niemelä, P. Santos, T. Attler,
102:539–545. J.P. Sousa, M.T. Sykes, A.J. Vanbergen and B.A. Woodcock.
Schindler, S., H. von Wehrden, K. Poirazidis, T. Wrbka and V. Kati. 2010. Functional traits as indicators of biodiversity response to
2012. Multiscale performance of landscape metrics as indicators land use changes across ecosystems and organisms. Biodivers.
of species richness of plants, insects and vertebrates. Ecol Indic. Conserv. 19:2921–2947.
31:41–48. Velli, A., D. Sommaggio, B. Maccagnani and G. Burgio. 2010.
Senapathi, D., L.G. Carvalheiro, J.C. Biesmeijer, C-A. Dodson, R.L. Evaluation of environment quality of a protected area in Northern
Evans, M. McKerchar, R.D. Morton, E.D. Moss, S.P.M. Roberts, Italy using Syrph the Net method. Bull. Insectology 63:217–224.
W.E. Kunin and S.G. Potts. 2015. The impact of over 80 years of Vujić, A., S. Radenković, T. Nikolić, D. Radišić, S. Trifunov, A.
land cover changes on bee and wasp pollinator communities in Andrić, Z. Markov,S. Jovičić, S. Mudri Stojnić, M. Janković, and
England. Proc. R. Soc B. 282:1–8. P. Lugonja. 2016. Prime hoverfly (Insecta: Diptera: Syrphidae)
Sommaggio, D. 1999. Syrphidae: can they be used as environmental areas (PHA) as a conservation tool in Serbia. Biol. Conserv.
bioindicators? Agric. Ecosyst. Environ. 74:343–356. 198:22–32.
Sommaggio, D. and G. Burgio. 2014. The use of Syrphidae as func- Walz, U. 2011. Landscape structure, landscape metrics and biodiver-
tional bioindicator to compare vineyards with different manage- sity. Living Rev. Landscape Res. 5:1–35.
ments. Bull. Insectology 67:147–156. With, K.A. 1997. The application of neutral landscape models in con-
Speight, M.C.D. 2008. Database of Irish Syrphidae (Diptera). servation biology. Conserv. Biol. 11:1069–1080.
Irish Wildlife Manuals, No.36, NPWS, Dept of Environment,
Heritage and Local Government, Dublin, Ireland. pp. 338.
Received October 9, 2017
Revised December 1, 2017
Speight, M.C.D. and E, Castella. 2001. An approach to interpretation Accepted December 18, 2017
of lists of insects using digitised biological information about the
species. J. Insect Conserv. 5:131–139.
Electronic Appendices
Speight, M.C.D., E. Castella, and P. Obrdlik. 2000. Use of the Syrph
the Net database 2000. Syrph the Net: The database of European
Table A1. Landscape variables (EXCEL file).
Syrphidae. Syrph the Net publications, Dublin.
Table A2. Observed species richness (Merodon and Cheilosia
Steffan-Dewenter, I., U. Munzenberg, C. Burger, C. Thies and T.
Tscharntke. 2002. Scale-dependent effects of landscape context species richness and total species richness), and BDMF values
on three pollinator guilds. Ecology 83:1421–1432. during 2 periods (1990-2006 and 2006/2014) for ten study sites
Tscharntke, T., A.M. Klein, A. Kruess, I. Steffan‐Dewenter and C. (1-10).
Thies. 2005. Landscape perspectives on agricultural intensifica- The Appendices may be downloaded from www.akademiai.com.You can also read