Epidemic host community contribution to mosquito-borne disease transmission: Ross River virus - Cambridge University Press
←
→
Page content transcription
If your browser does not render page correctly, please read the page content below
Epidemiol. Infect. (2017), 145, 656–666. © Cambridge University Press 2016
                   doi:10.1017/S0950268816002739

                   Epidemic host community contribution to mosquito-borne
                   disease transmission: Ross River virus

                   I. S. KOOLHOF*                 AND     S. CARVER
                   School of Biological Sciences, University of Tasmania, Hobart, Tasmania, Australia

                   Received 2 August 2016; Final revision 20 September 2016; Accepted 1 November 2016;
                   first published online 28 November 2016

                   SUMMARY
                   Most vector-borne diseases infect multiple host species, but disentangling the relative importance
                   of different host species to transmission can be complex. Here we study how host species’
                   abundance and competence (duration and titre of parasitaemia) influence host importance during
                   epidemic scenarios. We evaluate this theory using Ross River virus (RRV, family Togaviridae,
                   genus Alphavirus), a multi-host mosquito-borne disease with significant human health impacts
                   across Australia and Papua New Guinea. We used host contribution models to find the
                   importance of key hosts (possums, wallabies, kangaroos, horses, humans) in typical mammal
                   communities around five Australian epidemic centres. We found humans and possums
                   contributed most to epidemic RRV transmission, owing to their high abundances, generally
                   followed by macropods. This supports humans as spillover hosts, and that human–mosquito and
                   possum–mosquito transmission is predominant during epidemics. Sensitivity analyses indicate
                   these findings to be robust across epidemic centres. We emphasize the importance of considering
                   abundance and competence in identifying key hosts (during epidemics in this case), and that
                   competence alone is inadequate. Knowledge of host importance in disease transmission may help
                   to equip health agencies to bring about greater effectiveness of disease mitigation strategies.

                   Key words: Arboviruses, transmission, vector-borne disease, vectors.

                   I N T RO D U C T I O N                                                              how different host species in a community contribute to
                   The majority of pathogens, including emerging and                                   transmission is a critical frontier for comprehending,
                   resurging infectious diseases of humans, domestic ani-                              predicting and controlling infectious diseases [3–5].
                   mals and wildlife, infect multiple host species [1, 2].                             Vector-borne pathogens [e.g. West Nile virus (WNV),
                   Among a community of hosts, the contribution of                                     avian malaria, Ross River virus (RRV)] commonly res-
                   individual species to transmission can vary in a number                             ide in a range of host species [6–9]. Catholic feeding vec-
                                                                                                       tors transmit pathogens among host species that vary in
                   of important ways, including through variance in host
                   species abundances, susceptibility to infection, and                                their relative abundance and competence – the relation-
                   ability to transmit pathogens. Thus, understanding                                  ship between titre and duration of parasitaemia (parasite
                                                                                                       in the blood) [10, 11]. However, the relative importance of
                                                                                                       these factors is rarely understood, particularly compared
                                                                                                       to directly transmitted pathogens [12].
                   * Author for correspondence: Mr I. S. Koolhoff School of                               In this study, we focus on disentangling the relative
                   Biological Sciences, Private Bag 55, Hobart, Tasmania 7001,
                   Australia.
                                                                                                       importance of host species in vector-borne disease
                   (Email: koolhofi@utas.edu.au)                                                        transmission. The importance of vector abundance

Downloaded from https://www.cambridge.org/core. IP address: 46.4.80.155, on 22 Feb 2021 at 17:49:45, subject to the Cambridge Core terms of use, available at https://www.cambridge.org/core/terms.
https://doi.org/10.1017/S0950268816002739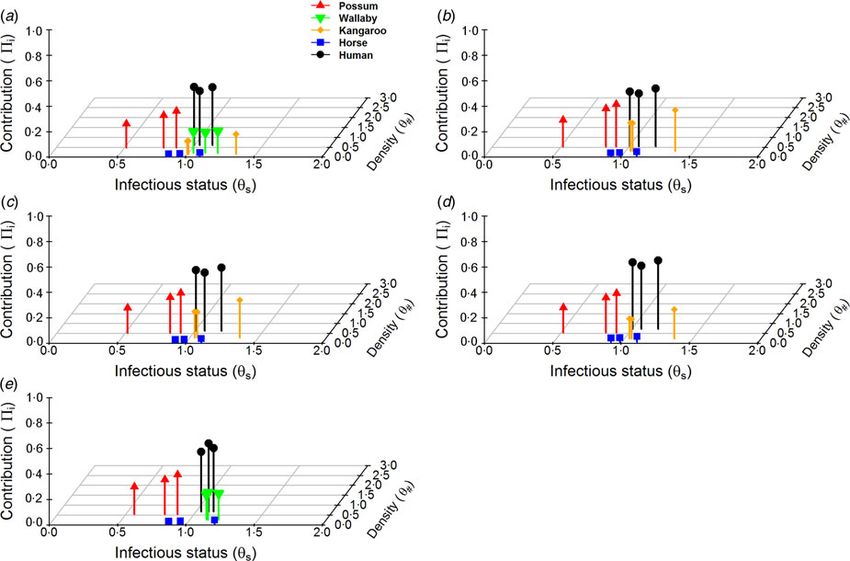
Vector-borne disease: host contributions                          657

          in disease transmission is of course indisputable, but                               host competence differs markedly between species [4,
          the role of host community composition is often                                      6, 10, 13, 28, 29]. To better understand the contribu-
          neglected [10]. Vector feeding preference can cause a                                tion of host species to RRV transmission, it is import-
          marked impact on the relative contribution of a host                                 ant to consider both varying abundances of host
          species to transmission, independent of host commu-                                  species and their varying competencies in the host
          nity structure, but evidence suggests that vector feed-                              community.
          ing strategies more commonly reflect the available                                       In this study, we simultaneously take into account
          host community [13–15]. Furthermore, there is com-                                   both host competence and abundance to investigate
          pelling evidence to suggest the importance of host                                   the contribution of hosts to potential RRV transmis-
          communities. For example, WNV and RRV differ in                                      sion. We expand on the notion of humans being a
          their prevalence in relation to variable host communi-                               spillover host for this virus, and also their role in sus-
          ties across similar climates and landscapes [16–18].                                 taining epidemics. We (i) model the contribution of key
          Urbanization and agricultural land usage has been                                    hosts to RRV transmission using host communities
          seen to lead to positive increases in the prevalence of                              that are representative of varying epidemic areas of
          WNV and are associated with changes in host com-                                     Australia; (ii) evaluate how changes in host compe-
          munities along these gradients [16]. RRV outbreaks                                   tences and abundance may alter the relative import-
          in southwestern Australia do not always occur in                                     ance/contribution in host species; and (iii) characterize
          years with high vector abundance, suggesting an                                      the general relationship host abundance and compe-
          important influence of reservoir host community on                                    tence has on host contribution to viral transmission.
          transmission dynamics and spillover to humans ([19]                                  We show that, in addition to macropod marsupials
          and references therein). Thus, the relative abundance                                and humans, brushtail possums (Trichosurus vulpecula)
          and competence of hosts in communities likely plays                                  may have a greater role in epidemic RRV transmission
          a critical role in shaping vector-borne disease trans-                               than previously recognized. Our findings support
          mission [2, 11]. To study ‘key hosts’ in vector-borne                                humans as a spillover host for RRV transmission,
          disease transmission we use an important disease of                                  and illustrate the critical, often underappreciated,
          humans which is endemic in Australia and Papua                                       importance of host abundance in attributing ‘key
          New Guinea, i.e. RRV (family Togaviridae, genus                                      host’ status to hosts of this mosquito-borne disease.
          Alphavirus).
             RRV is a mosquito-transmissible virus which
          causes epidemics, resulting in chronic fatigue and                                   METHODS
          polyarthritic-type symptoms [20]. Epidemiologically,
          RRV is the most important vector-borne disease in                                    Study regions and host communities
          Australia with 1451–9551 human clinical notifications                                 This study investigates areas where RRV is known to
          per year at an estimated annual cost of $15 million                                  cause epidemics in five Australian States/Territories:
          [4, 21, 22]. There are three major vectors for RRV                                   Queensland, New South Wales, Western Australia,
          across Australia: Culex annulirostris, Aedes vigilax,                                South Australia, and the Northern Territory
          and Aedes camptorhynchus [4, 9, 23, 24]. Vector feed-                                (Table 1). Focal study areas for each State/Territory
          ing patterns are influenced by the availability, accessi-                             are as follows: Queensland – northeast Brisbane in
          bility and abundance of host species [25], and vectors                               the level 3 statistical local areas [SLAs; Australian
          are generally thought of as host generalists [8, 26, 27].                            Bureau of Statistics (ABS)] of Chermside, Nundah,
          A range of vertebrate host species are exposed to                                    and Sandgate; New South Wales – Newcastle (SLA
          RRV, with the most competent species being marsu-                                    level 3); Western Australia – Mandurah, Mandurah
          pials [9, 24]. The primary reservoir host is often                                   South, and Green fields (SLAs level 2); South
          assumed to be macropod marsupials, owing to the                                      Australia – Murray Bridge significant urban area
          duration and titre of viraemia, but their relative status                            (SLA level 2); and Northern Territory – broadly the
          among other potential reservoir species (e.g. other                                  northern suburbs of Darwin, which includes all
          marsupial or placental mammal species) remains                                       SLAs (level 2) north of Darwin city and west of
          uncertain [9, 24]. The relative abundance of potential                               Buffalo Creek, including Lyons.
          host species that are fed upon by RRV vectors differs                                   We used five host species communities which
          in epidemic areas of Australia; this may have import-                                roughly represent those commonly reported in RRV
          ant consequences for transmission [10]. Furthermore,                                 epidemic areas across Australia. Hosts are generically

Downloaded from https://www.cambridge.org/core. IP address: 46.4.80.155, on 22 Feb 2021 at 17:49:45, subject to the Cambridge Core terms of use, available at https://www.cambridge.org/core/terms.
https://doi.org/10.1017/S0950268816002739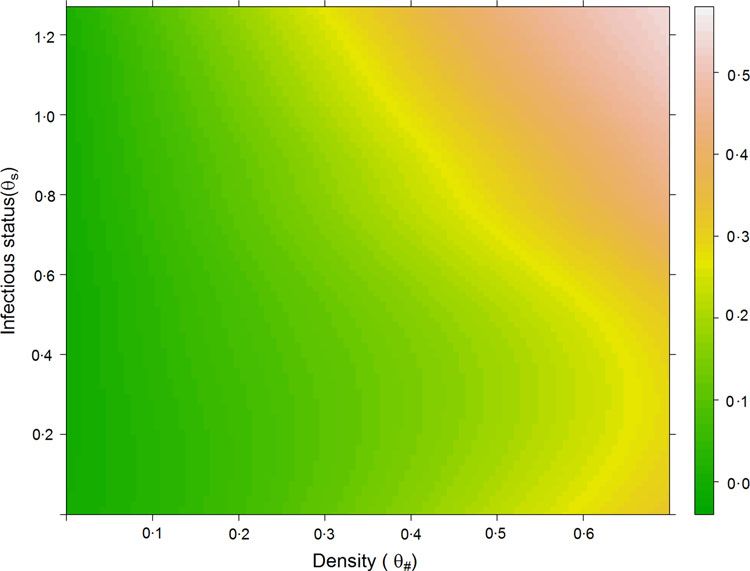
658        I. S. Koolhoff and S. Carver

                   Table 1. Host abundance and competence (viraemia and titre) across the five regions in this study

                   Host species                                 State               Density/km2                   Viraemia (days)                  Titre               Ref.

                   Eastern grey kangaroo*                       QLD                 4·72                          3·4 (2·3–6)                      6·1                 [4, 29, 37]
                   Wallaby†                                     QLD                 10·4                          3·4 (1·1–5)                      7·4                 [17, 29, 38]
                   Horse‡                                       QLD                 0·5                           3 (2–5)                          6·3                 [17, 28]
                   Possum§                                      QLD                 246·9                         2 (1–3)                          7·5                 [13, 39]
                   Human                                        QLD                 1015·1                        4 (1–6)                          6·3                 [13, 40, 41]
                   Possum§                                      NSW                 173·1                         2 (1–3)                          7·5                 [42, 43]
                   Eastern grey kangaroo*                       NSW                 19·05                         3·4 (2·3–6)                      6·1                 [4, 29, 37]
                   Horse‡                                       NSW                 0·5                           3 (2–5)                          6·3                 [28, 44]
                   Human                                        NSW                 224·9                         4 (1–6)                          6·3                 [13, 41, 45]
                   Western grey kangaroo||                      WA                  21·9                          3·4 (2·3–6)                      6·1                 [4, 29, 39]
                   Horse‡                                       WA                  0·5                           3 (2–5)                          6·3                 [17, 28]
                   Possum§                                      WA                  251·8                         2 (1–3)                          7·5                 [6, 39]
                   Human                                        WA                  923·1                         4 (1–6)                          6·3                 [13, 41, 46]
                   Red kangaroo¶                                SA                  4·31                          3·4 (2·3–6)                      6·1                 [29, 47]
                   Possum§                                      SA                  42·8                          2 (1–3)                          7·5                 [6, 17]
                   Horse‡                                       SA                  0·5                           3 (2–5)                          6·3                 [17, 28]
                   Human                                        SA                  171                           4 (1–6)                          6·3                 [13, 41, 48]
                   Horse‡                                       NT                  0·5                           3 (2–5)                          6·3                 [17, 28]
                   Possum§                                      NT                  290·5                         2 (1–3)                          7·5                 [39, 42]
                   Wallaby#                                     NT                  15                            3·4 (1·1–5)                      7·4                 [17, 29, 38]
                   Human                                        NT                  1351                          4 (1–6)                          6·3                 [13, 41]

                   Common names, genus and species and reference: * Eastern grey kangaroo (Macropus giganteus); † wallaby (based on
                   Macropus parryi); ‡ horse (Equus caballus); § possum (based on Trichosurus vulpecula); || Western grey kangaroo
                   (Macropus fliginosus); ¶ red kangaroo (Macropus rufus); # wallaby (based on Macropus agilis). Densities are representative
                   values (see Methods section) and variance in these values was considered in sensitivity analysis. Viraemia are presented as
                   reported means and their lower and upper values.

                   humans, horses (Equus caballus – a putative host of                                 climatically similar states, denoted as θ#i [see
                   RRV), kangaroos (Macropus giganteus, Macropus fuli-                                 Table 1, equation (1)]. In the following, we define
                   ginosus and Macropus rufus), possums (Trichosurus vul-                              the parameters for θ#i : Hi the target species density;
                   pecula), and wallabies (Macropus parryi and Macropus                                Pi a relative proportion and known density in the
                   agilis). We acknowledge that RRV vectors will also feed                             respective state; Pdi the known density of the propor-
                   on other vertebrate species (particularly domestic and                              tion of a target species within that state.
                   agricultural animals, and birds), but they are omitted
                   from this study owing to their general ‘dead-end’ sta-                                       Hi
                                                                                                       θ #i =      ×Pdi .                                                        (1)
                   tuses, and because their inclusion added little to model                                     Pi
                   outcomes in preliminary analyses [4, 9]. Instead, we
                   focused on the aforementioned five hosts because they                                   The human population density element to host
                   are generically characteristic of host communities in epi-                          communities was derived from the ABS. Possum
                   demic areas of Australia. Host community composition                                populations were derived from a general possum dens-
                   and density specific to each of our five study areas were                             ity per household ratio from the literature [30], and
                   calculated from a variety of sources, including pub-                                scaled to human population information gathered
                   lished literature and government datum sources (see                                 from the ABS. From the datum we were able to
                   Table 1).                                                                           approximate possum densities around these epidemic
                      Where possible, species densities are taken from                                 areas for each state [equation (2)]. Parameters for pos-
                   peer-reviewed literature and converted into a density                               sum density θp are defined as: Ri the density of
                   representing the number of an individual species/                                   humans/km2; Ki the number of people per household;
                   km2. For the abundance of those species not found                                   and Pi the amount of possums per household.
                   in the literature, approximate densities were calculated
                   using average values from the other States/Territories                                       Ri
                                                                                                       θp =        ×Pi .                                                         (2)
                   or the relative proportions of these species i in                                            Ki

Downloaded from https://www.cambridge.org/core. IP address: 46.4.80.155, on 22 Feb 2021 at 17:49:45, subject to the Cambridge Core terms of use, available at https://www.cambridge.org/core/terms.
https://doi.org/10.1017/S0950268816002739
Vector-borne disease: host contributions 659
Host competence to the remaining species [equation (5)].
The titre and viraemia of each host were taken from
Hi
the literature. In instances where data was unable to θA = . (5)
be sourced from the literature, values were based on A
taxonomically similar host species with a known
titre and viraemia [see equation (1), Table 1] M. fuli- Third, we investigated each species within each
ginosus and M. rufus titre and viraemia were consid- community to determine relative competence, finding
ered to be the same as M. giganteus. Furthermore, which species have a relatively high titre and viraemia
M. robustus titre and viraemia were calculated as the compared to the average infection contribution of
average between an M. giganteus and a M. agilis. each State/Territory, where j is the comparison of all
species. We define a state’s average infection status
as ŝ [equation (6)].
Modelling host contribution
To investigate the links of host competence and host d j tj
ŝ = . (6)
abundance effects on host contribution to viral trans- N
mission, we simulated two models which represent
host contribution = (models adapted from those devel- The average infection contribution for each State/
oped by Streicker et al. [2]). Territory was then used to find each species’ infection
First, we modelled host contribution using the host’s status within the endemic community [equation (7)].
competence (maximum, mean, and minimum literature
reported) and estimated likely density. In the following di ti
we define the following symbols: Hi is the abundance θs = . (7)
ŝ
(log10-transformed) of host species i within a given
state, di is the duration of viraemia (log10-transformed)
of host species i, ti is the titre (log10-transformed) of Each individual’s contribution/importance to trans-
host species i, j is the comparison of all other species. mission for each State/Territory was then plotted
The overall contribution of species i to a community is three-dimensionally to illustrate the difference in ani-
ni = Hiditi. Given that there are five different species (N) mal contribution in relation to their relative abun-
per state, the total community contribution can be calcu- dance and competence within each community.
Because individual hosts can show variation in the
lated by the following: n = N j=1 Hj dj tj . Thus an indivi-
dual’s contribution to a community (πi) can be duration and titre of viraemia, we evaluated sensitivity
modelled as the following: of model findings to this by assessing host importance
also at lowest detectable titre and viraemia and aver-
Hi di ti age titre and viraemia. Potential variability in knowl-
π i = N . (3)
edge of host densities could also impact model
j=1 Hj dj tj
outcomes. The density of host species we used across
Second, we modelled the relative abundance sites are representative, and can also vary over time,
(log10-transformed) of species within a community we conducted additional sensitivity analyses on this
to find which species are found in higher densities parameter to evaluate how changes in host abundance
within each States/Territories endemic community impact the relative contribution of host species to
[equation (4)]. From this we define the following transmission. Host densities were presented on a
equation: log10 scale with the original host densities marked
on sensitivity analysis plots for reference. This further
Hj helps to facilitate additional perspectives of how mos-
A =
j
, (4) quitoes may interact with the varying relative abun-
N
dances (and possible spatial structure) of hosts
where A is the average density of an individual spe- around urban fringes [i.e. humans (and often pos-
cies across the whole community. We used the vari- sums) are at higher densities in urban areas, and
able A to compare the relative density of each horses and macropods are at higher densities in
individual host species in order to find if a species around the fringes of urban areas] within each epi-
was high in abundance within a community, relative demic community.
Downloaded from https://www.cambridge.org/core. IP address: 46.4.80.155, on 22 Feb 2021 at 17:49:45, subject to the Cambridge Core terms of use, available at https://www.cambridge.org/core/terms.
https://doi.org/10.1017/S0950268816002739660 I. S. Koolhoff and S. Carver
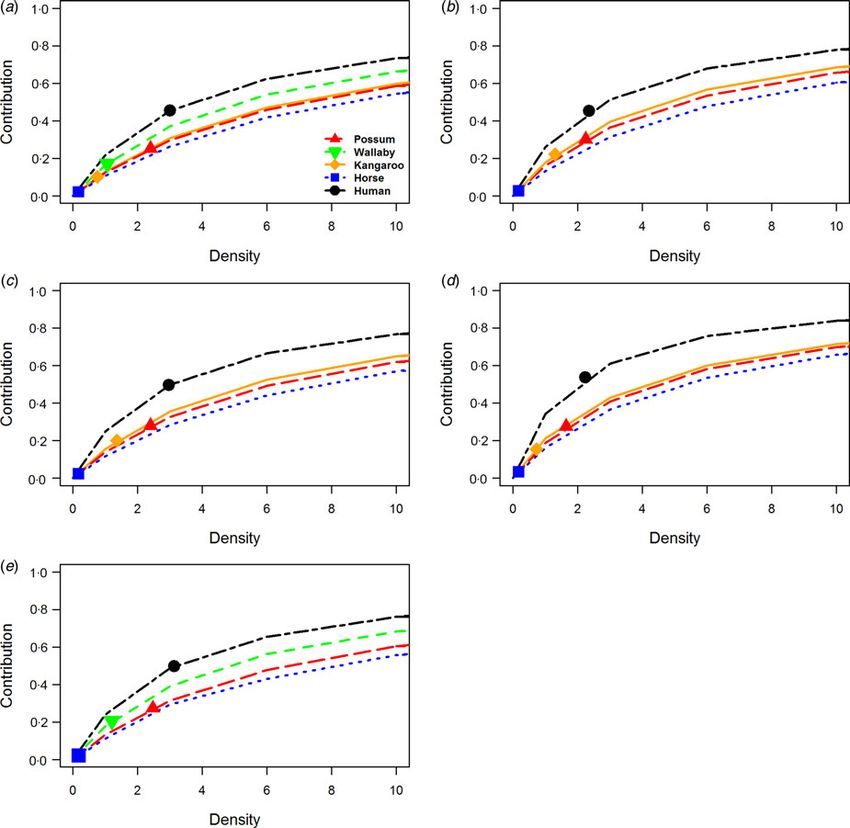
Fig. 1. Host contribution models. The relative contribution/importance of five hosts within Ross River virus epidemic
communities: (a) Queensland, (b) New South Wales, (c) Western Australia, (d) South Australia, (e) Northern Territory.
Host contribution based on the relationship between relative competence and abundance (log10 scale) status.
R E S ULTS each epidemic community (Fig. 1). These hosts were
closely followed in importance by kangaroos and wal-
Host density and competence
labies in areas where they were present (Fig. 1).
Host community competence was seen to vary between Overall, horses had a much smaller contribution to
epidemic centres (Table 1). The densities of possums RRV transmission which was consistently due to
and human across all epidemic centres were higher their relatively low abundances (Fig. 1). Across all
than all other species. The densities of kangaroos, horses hosts, contribution to RRV transmission was most
and wallabies in comparison were smaller, with horses strongly influenced by the host’s relative abundance.
having the lowest estimated densities across all areas. Our sensitivity analysis showed that while changes in
Unsurprisingly, kangaroos were the most competent a host competence does change a host’s contribution,
hosts, mostly owing to their long duration of viraemia its magnitude is minor compared to that of its abun-
(Table 1, Fig. 1). This was followed by humans having dance within a community (Fig. 1).
a long viraemic period but low titre, wallabies, having
both long viraemic periods and high titres, horses with
Sensitivity of host abundance on contribution/
moderate viraemic periods and titre, and then possums,
importance to transmission
having a short viraemic period, but the highest titre.
Because data on the density of host species across our
sites is considered representative, and can also vary
Contribution/importance of key hosts to transmission over time, we also evaluated the sensitivity of host spe-
Despite variance in host community structure in epi- cies i’s abundance (log10-transformed) on contribution
demic regions, we detected reasonable consistency in to transmission (Fig. 2). Notably, this gave a measure
which hosts were potentially most important for of the abundance change needed for a given host spe-
RRV transmission. Possums and humans were the cies i to alter its rank order among the other hosts in
most important hosts for transmission of RRV in the community.
Downloaded from https://www.cambridge.org/core. IP address: 46.4.80.155, on 22 Feb 2021 at 17:49:45, subject to the Cambridge Core terms of use, available at https://www.cambridge.org/core/terms.
https://doi.org/10.1017/S0950268816002739Vector-borne disease: host contributions 661
Fig. 2. Host sensitivity models. Sensitivity analysis of the contribution/importance of five host species in epidemic
communities: (a) Queensland, (b) New South Wales, (c) Western Australia, (d) South Australia, (e) Northern Territory.
Host species change in contribution due to change in (log10-scaled) abundance relative to other host species.
Among the sites, possum species densities required absolute densities of hosts, our estimates of the rank
more than two orders of magnitude to match human order of importance, relative to humans, is robust.
contributions to RRV transmission given the remain-
ing species’ densities stayed the same. The remaining
species – wallabies, kangaroos, and horses – require The relationship between host abundance and
vastly unrealistic values up to and exceeding 10 orders competence on contribution/importance
of magnitude to contribute similar importance to Combining the information among sites and hosts in
RRV transmission during epidemics. However, when this study, we determined general relationships between
excluding humans, the host species may compete host abundance and competence on contribution to
against each other with only minor increases in their transmission [Fig. 3: contribution ∼log10(relative abun-
densities needed to overtake one another in dance)*0·137 (S.E. = 0·007) + competence*0·083 (S.E. =
their importance to transmission during epidemics. 0·20), r2 = 0·875]. Intuitively, the contribution of a
This demonstrates that, even with uncertainty in the host in a community increases with higher abundance
Downloaded from https://www.cambridge.org/core. IP address: 46.4.80.155, on 22 Feb 2021 at 17:49:45, subject to the Cambridge Core terms of use, available at https://www.cambridge.org/core/terms.
https://doi.org/10.1017/S0950268816002739662 I. S. Koolhoff and S. Carver
Fig. 3. Contribution association heat map. Combined contribution to transmission of all hosts affected by infectious
status (upper, mean, and lower competence) and abundance (density): log10-scaled host densities.
and higher competence. However, it is notable that to RRV transmission as kangaroos, and horses were
host abundance appeared to have a more dominant consistently minor contributors to transmission
effect on host importance to transmission than that of owing to their low abundance within the communities.
competence. Thus, these results indicate that within epidemic areas,
macropods may play a lesser role as a ‘key host’ for
RRV during epidemics. Instead, transmission during
DISCUSSION epidemics in these areas may be dominated by mos-
In this study, we sought to elucidate the relative quito–human and mosquito–possum interactions.
importance of host species in a community on Furthermore, we show that when considering a
mosquito-borne disease transmission – focusing on host’s infectious status and competence, high host
RRV in epidemic centres of Australia. We considered abundance can swamp the relative contribution of a
the epidemiologically important parameters of host host species to RRV transmission during an epidemic.
competence and abundance [2, 11], assuming catholic While our results suggests that humans and pos-
feeding vector(s). RRV transmission is regulated by sums are potential ‘key hosts’ for RRV in epidemic
interactions between vectors, reservoir host compe- centres, we also acknowledge that humans do not
tence, and the relative abundance of hosts within the sustain RRV transmission [10, 31]. Indeed evidence
communities, and this varies across Australia [4, 9]. suggests there can be short-lived human–mosquito–
We found that within communities human and pos- human transmission cycles, but these do not persist
sum hosts have the greatest potential to contribute to become endemic [8]. Important distinctions here
to viral transmission during epidemics based on their are that of endemic and epidemic host communities,
relative competence and abundance, regardless of geo- as well as ‘key hosts’ vs. sustained transmission. We
graphical location. Despite having the greatest compe- focussed on epidemic centres of RRV transmission
tence, the lowest abundance of kangaroos resulted in owing to the epidemiological importance, and also
their lower potential contribution to epidemic trans- the greater availability of host and disease informa-
mission, compared to human and possum hosts. tion, relative to RRV transmission in non-epidemic
Wallabies had broadly similar potential to contribute areas. Our modelling contributes new insights into
Downloaded from https://www.cambridge.org/core. IP address: 46.4.80.155, on 22 Feb 2021 at 17:49:45, subject to the Cambridge Core terms of use, available at https://www.cambridge.org/core/terms.
https://doi.org/10.1017/S0950268816002739Vector-borne disease: host contributions 663
the ‘key hosts’ in a community during epidemics of macropod marsupials, while living further from sub-
mosquito-borne disease, but this should not be con- urban areas, live relatively shorter lives than horses
fused with endemic transmission, which is associated and breed at younger ages. This allows for their off-
with persistent transmission cycles. If anything, the spring to enter epidemic host communities as suscep-
disparity between what are generally considered the tible hosts capable of viral transmission. While our
putative reservoir hosts of RRV (macropods), and models do not explicitly capture these aspects of
the ‘key hosts’ in epidemic communities identified herd immunity, our results nevertheless still show
here (humans and possums), may suggest that horses playing a very minor role in epidemic transmis-
endemic RRV transmission is maintained at larger sion, albeit through the mechanism of low abundance.
scales, which are not yet well understood. It is therefore possible that the importance of horses in
Representing the contribution of host species in dif- RRV transmission may be even less than our models
fering scenarios (changes in abundance and compe- predict.
tence) has enabled us to keep the rank-order of host An often discussed limitation to comprehending the
abundance the same, but facilitate additional perspec- role of non-human hosts in the transmission of RRV
tives of how mosquitoes may interact with the varying is a lack of knowledge regarding their abundance,
relative abundances (and possible spatial structure) of both at spatial and temporal scales [19, 33]. This limi-
hosts within each epidemic community. For example, tation has been acknowledged for decades [4, 8, 9, 17,
humans (and often possums) are at higher densities in 19]. For example, the lack of literature surrounding
urban areas than macropods. Similarly, horses and rodents’ spatial distributions and abundances led to
macropods are at higher densities around the fringes their omission from this study, in spite of their poten-
of urban areas than humans. Ultimately, we do not tial ability to contribute to RRV transmission [34].
know the functional impact of a host’s spatial distri- For this study we targeted the knowledge gap of
bution around these epidemic areas on relative host host contribution and have (at least partially) over-
importance to RRV transmission. Our models suggest come this limitation. Here we made the assumption
that human, possum, and kangaroo hosts require the that there was random mixing of mosquitoes among
least change in abundance to markedly alter their con- host species with mosquitoes being host generalists
tribution to viral transmission. We suspect host contri- feeding on all hosts according to their relative abun-
butions may vary over time based on fluctuations in dance. To this end, we have made substantive efforts
vector and hosts abundances. Additionally, herd to identify representative densities of likely RRV
immunity in hosts likely plays a role in transmission hosts around epidemic areas of Australia, and
and spillover occurrence into human populations accounted for uncertainty in their estimates through
[10, 32]. our sensitivity analyses. Furthermore, modelling host
Herd immunity was not considered in the models competence across the range host viral activity seen
presented here. However, herd immunity plays a in each respective animal has enabled us to quantify
vital role in the number of competent hosts within the ‘key hosts’ during RRV epidemics. This highlights
communities capable of supplying vectors with a the importance of a host’s abundance within a com-
viable bloodmeal needed for viral transmission [19]. munity and its contribution to transmission during
In particular, potential reservoir hosts differ in life- epidemics. Such insights have mostly been speculative
span and reproductive output. This translates into dif- in the past. We hope that the information we have
ference in the emergence of new available competent generated on host abundances among some of
hosts entering epidemic host communities through Australia’s most important epidemic locations will
time and difference among host reservoir immunities contribute positively to further research that targets
[10]. The role of herd immunity is more apparent in the gaps in host ecology with regard to the epidemi-
viral transmission and host contribution when consid- ology of this disease.
ering the host’s spatial location and density to We believe the ‘key host’ role we identified for humans
humans. For instance, while humans may be in closer in RRV transmission is analogous to an amplification
spatial proximity to horses in suburban areas, the rela- effect [12], following viral spillover events. Human dens-
tive long lifespan of horses may mean that their herd ities are markedly higher than those of other hosts, and
immunity remains at a higher level, relative to hosts while human hosts retain a low titre, their viraemia dur-
with shorter lifespan, thus limiting their role in RRV ation is long [13] relative to other hosts in our study com-
transmission into human populations. In contrast, munities. Consequently, our interpretations of relative
Downloaded from https://www.cambridge.org/core. IP address: 46.4.80.155, on 22 Feb 2021 at 17:49:45, subject to the Cambridge Core terms of use, available at https://www.cambridge.org/core/terms.
https://doi.org/10.1017/S0950268816002739664 I. S. Koolhoff and S. Carver
host importance are likely robust. These results demon- centres around Australia that are also applicable to
strate that changes in host abundances needed for other other national areas. For diseases that have the ability
host species to become as important in epidemic RRV to spillover into human populations, determining key
transmission are mostly unrealistic. It is also important hosts in the transmission cycle is vital in mitigating
to acknowledge perceptions of the RRV reservoir host epidemics [31]. In the transmission of RRV, host
as macropods; predominantly due to their high compe- abundance and competence are key indicators of the
tence [9, 35]. Our results suggest macropods potentially relative contributions hosts have in transmission
play a lesser role during epidemics, and instead (in con- within an epidemic community. From our findings,
trast to the literature) possums may have a greatly we enhance understanding of the transmission of
enhanced contribution, owing to their competence, vector-borne diseases and the importance of consider-
high abundance and urban associations with humans. ing both host competence and their relative abun-
This result is supported by other modelling studies [14]. dance within epidemic communities. Our results
This of course does not suggest that macropods are not support the notion that during a spillover event of
reservoirs of RRV transmission, but that their role may RRV into human populations, humans are able to
be more focused around enzootic and epizootic phases maintain viral transmission [15]. At least for short per-
of transmission, than epidemic. iods, our study suggests macropod marsupials have a
This study provides valuable insight on the interac- lesser role in epidemic transmission than previously
tions between host competence and host abundance in thought, while possums superseded the role of macro-
epidemic communities. However, results from this pods in transmission during epidemics. Furthermore,
study do have limitations. Vector characteristics we document that changes in host competence is not
were not accounted for in our models and were as important to RRV transmission as that of host
beyond the scope of this study. We assumed that abundance during epidemics. Relative host import-
there was no vector feeding preference across all ance to RRV transmission may in the future help to
hosts. While available evidence suggests the dominant equip health agencies with more in-depth knowledge
RRV vectors are catholic (at least within mammals), to bring about greater effectiveness in mitigation strat-
some host preferences may exist [26, 36]. Empirical egies aimed at reducing human RRV cases. This
and theoretical studies on vector feeding preferences potentially includes host immunization, if a vaccine
would be a valuable extension to understanding is ever made widely available [21]. For hosts which
RRV transmission in epidemic communities. are long-lived and have long reproductive outputs,
Furthermore, our models did not consider vector such as horses, immunization may form a valuable
abundance or changes in seasonal conditions, nor aspect in reducing the amount of competent hosts
exposure times, as human hosts are not as frequently available for transmission. For hosts which are short-
in contact with vectors compared to other host coun- lived and have higher reproductive turnover, herd
terparts. Potentially, this may suggest possums have immunity through vaccination would prove to be a
an even greater relative role in the epidemiology of more challenging undertaking for effective control.
RRV than indicated here. Host interaction and mix- Further research into epidemic communities may
ing was also assumed to be random and constant on also look at vector feeding preferences, more detailed
both a spatial and temporal scale. Although these fac- host communities, and variance in host exposure to
tors may alter some aspects of the host contribution, it vectors.
was first vital to find the effect species abundance and
competence has on viral transmission. From our mod-
els, further analysis can be performed using these sug- AC K N OWL E D G E M E NT S
gested variables. This research was partially supported by funding from
the Western Australia Government Funding Initiative
for Mosquito Management in Western Australia, and
CO N CLU S IO N S the UTAS Research Enhancements Grant Scheme to
Disease transmission is a dynamic interplay involving Scott Carver.
a network of hosts varying in abundance and compe-
tence [12]. In this study we set out to disentangle host
importance within typical epidemic host communities D E C L A R AT I O N O F I N T E R E S T
in the transmission of RRV in specific population None.
Downloaded from https://www.cambridge.org/core. IP address: 46.4.80.155, on 22 Feb 2021 at 17:49:45, subject to the Cambridge Core terms of use, available at https://www.cambridge.org/core/terms.
https://doi.org/10.1017/S0950268816002739Vector-borne disease: host contributions 665
R E FE RE NC E S 17. Carver S, et al. Dryland salinity and the ecology of Ross
River virus: the ecological underpinnings of the potential
1. Jones KE, et al. Global trends in emerging infectious for transmission. Vector-Borne and Zoonotic Diseases
diseases. Nature 2008; 451: 990–993. 2009; 9: 611–622.
2. Streicker DG, Fenton A, Pedersen AB. Differential 18. Ezenwa VO, et al. Land cover variation and West Nile
sources of host species heterogeneity influence the trans- virus prevalence: patterns, processes, and implications
mission and control of multihost parasites. Ecology for disease control. Vector-Borne and Zoonotic Diseases
Letters 2013; 16: 975–984. 2007; 7: 173–180.
3. Becker DJ, Streicker DG, Altizer S. Linking anthropo- 19. Carver S, et al. Environmental monitoring to enhance
genic resources to wildlife-pathogen dynamics: a review comprehension and control of infectious diseases.
and meta-analysis. Ecology Letters 2015; 18: 483–495. Journal of Environmental Monitoring. 2010; 12: 2048–
4. Harley D, Sleigh A, Ritchie S. Ross River virus trans- 2055.
mission, infection, and disease: a cross-disciplinary 20. Marshall I, Miles J. Ross River virus and epidemic
review. Clinical Microbiology Reviews 2001; 14: 909– polyarthritis. Current Topics in Vector Research 1984;
932. 2: 31–56.
5. Manore CA, et al. A network-patch methodology for 21. Aaskov J, Fokine A, Liu W. Ross River virus evolution:
adapting agent-based models for directly transmitted implications for vaccine development. Future Virology
disease to mosquito-borne disease. Journal of Biological 2012; 7: 173–178.
Dynamics 2015; 9: 52–72. 22. Australia Governmenal Department of Health. Notifi-
6. Boyd A, Kay BH. Solving the urban puzzle of Ross cations for all diseases by State & Territory and year
River and Barmah Forest viruses. Arbrovirus Research 2016 (http://www9.health.gov.au/cda/source/rpt_2_sel.
in Australia 2001; 8: 14–22. cfm). Accessed 19 September 2016.
7. Kilpatrick AM, et al. Host heterogeneity dominates 23. Ballard JWO, Marshall ID. An investigation of the
West Nile virus transmission. Proceedings of the Royal potential of Aedes–Camptorhynchus (THOM) as a
Society of London, Series B: Biological Sciences 2006; vector of Ross River virus. Australian Journal of
273: 2327–2333. Experimental Biology and Medical Science 1986; 64:
8. Lindsay M, et al. Western Australian arbovirus surveil- 197–200.
lance and research program, Annual Report: 1997–1998. 24. Monath TP. The Arboviruses: Epidemiology and
Arbovirus Surveillance and Research Laboratory and the Ecology. CRC Press Inc., 1988.
Western Australian Centre for Pathology and Medical 25. Kay BH, Boreham PFL, Williams GM. Host preferences
Research. Western Australia Government, 1998. and feeding patterns of mosquitos (Diptera, Culicidae)
9. Russell RC. Ross River virus: ecology and distribution. at Kowanyama, Cape York Peninsula, Northern
Annual Review of Entomology 2002; 47: 1–31. Queensland. Bulletin of Entomological Research 1979;
10. Carver S, et al. Influence of hosts on the ecology of 69: 441–457.
arboviral transmission: potential mechanisms influen- 26. Johansen CA, Power SL, Broom AK. Determination of
cing dengue, Murray valley encephalitis, and Ross mosquito (Diptera: Culicidae) bloodmeal sources in
River virus in Australia. Vector-Borne and Zoonotic Western Australia: implications for arbovirus transmis-
Diseases 2009; 9: 51–64. sion. Journal of Medical Entomology 2009; 46: 1167–
11. Kilpatrick AM, et al. West Nile virus epidemics in 1175.
North America are driven by shifts in mosquito feeding 27. Lee DJ, Clinton KJ, Ogower AK. The blood sources of
behavior. PLoS Biology 2006; 4: 606–610. some Australian mosquitoes. Australian Journal of
12. Keesing F, Holt RD, Ostfeld RS. Effects of species Biological Sciences 1954; 7: 282–301.
diversity on disease risk. Ecology Letters 2006; 9: 485– 28. Kay BH, et al. The experimental infection of horses with
498. Murray Valley encephalitis and Ross River viruses.
13. Boyd AM, Kay BH. Assessment of the potential of dogs Australian Veterinary Journal 1987; 64: 52–55.
and cats as urban reservoirs of Ross River and Barmah 29. Kay B, et al. Experimental infection of vertebrates with
Forest viruses. Australian Veterinary Journal 2002; 80: Murray Valley encephalitis and Ross River viruses.
83–86. Arbovirus Research in Australia, Proceedings Symposium,
14. Choi YH, et al. Modelling the transmission dynamics of 1986.
Ross River virus in Southwestern Australia. Journal of 30. Kay BH, et al. Mosquito feeding patterns and natural
Mathematics Applied in Medicine and Biology 2002; infection of vertebrates with Ross River and Barmah
19: 61–74. Forest viruses in Brisbane, Australia. American
15. Zeilinger AR, Daugherty MP. Vector preference and Journal of Tropical Medicine and Hygiene 2007; 76:
host defense against infection interact to determine dis- 417–423.
ease dynamics. Oikos 2014; 123: 613–622. 31. Lindsay M, et al. Ross River and Barmah Forest viruses
16. Bowden SE, Magori K, Drake JM. Regional differences in Western Australia, 2000/01–2003/04: contrasting pat-
in the association between land cover and West Nile terns of disease activity. Arbovirus Research in Australia
Virus disease incidence in humans in the United 2005; 9: 194–201.
States. American Journal of Tropical Medicine and 32. Potter A, et al. The seroprevalence and factors asso-
Hygiene 2011; 84: 234–238. ciated with Ross River virus infection in Western grey
Downloaded from https://www.cambridge.org/core. IP address: 46.4.80.155, on 22 Feb 2021 at 17:49:45, subject to the Cambridge Core terms of use, available at https://www.cambridge.org/core/terms.
https://doi.org/10.1017/S0950268816002739666 I. S. Koolhoff and S. Carver
kangaroos (Macropus fuliginosus) in Western Australia. 42. Boyd AM, et al. Experimental infection of Australian
Vector-Borne and Zoonotic Diseases 2014; 14: 740–745. brushtail possums, Trichosurus vulpecula (Phalangeridae:
33. Kutt AS, et al. Variation in terrestrial mammal abun- Marsupialia), with Ross River and Barmah Forest
dance on pastoral and conservation land tenures in viruses by use of a natural mosquito vector system.
north-eastern Australian tropical savannas. Animal American Journal of Tropical Medicine and Hygiene
Conservation 2012; 15: 416–426. 2001; 65: 777–782.
34. Carver S, et al. House mouse abundance and Ross 43. Kerle JA, Kimmorley C, Old JM. An inland population
River virus notifications in Victoria, Australia. of the common ringtail possum (Pseudocheirus peregri-
International Journal of Infectious Diseases 2008; 12: nus) at Black Rock Ridge, New South Wales: a prelim-
528–533. inary ecological assessment. Australian Mammalogy
35. Kay B, Aaskov J. Ross River virus (epidemic polyarthri- 2013; 35: 236–240.
tis). The Arboviruses: Epidemiology and Ecology 1989; 4: 44. Vernes K, Freeman M, Nesbitt B. Estimating the density
93–112. of free-ranging wild horses in rugged gorges using a
36. Apperson CS, et al. Host feeding patterns of established photographic mark-recapture technique. Wildlife
and potential mosquito vectors of West Nile virus in the Research 2009; 36: 361–367.
eastern United States. Vector-Borne and Zoonotic 45. Australia Bureau of Statistics. National Regional Profile:
Diseases 2004; 4: 71–82. New South Wales Australian Government (http://www.
37. Southwell CJ, Cairns SC. Abundance of large macro- abs.gov.au/AUSSTATS/abs@nrp.nsf/Latestproducts/
pods in the eastern highlands of Australia. Wildlife 1Population/People12007-2011?opendocument&tabname=
Society Bulletin 1997; 25: 125–132. Summary&prodno=1&issue=2007-2011). Accessed 4
38. Southwell C, et al. Abundance and harvest rate of the April 2014.
whiptail wallaby in southeastern Queensland, Australia. 46. Australia Bureau of Statistics. National Regional Profile:
Wildlife Society Bulletin 1995; 23: 726–732. Western Australia: Australian Government (http://www.
39. Carver S. Resistance of mammal assemblage structure abs.gov.au/AUSSTATS/abs@nrp.nsf/Latestproducts/
to dryland salinity in a fragmented landscape. Journal LGA5Population/People12007-2011?opendocument&
of the Royal Society of Western Australia 2010; 93: tabname=Summary&prodno=LGA5&issue=2007-2011).
119–128. Accessed 4 April 2014.
40. Australia Bureau of Statistics. National Regional Profile: 47. Cairns SC, Grigg GC. Population-dynamics of red kan-
Queensland Australian Government (http://www.abs. garoos (Macropus rufus) in relation to rainfall in the
gov.au/AUSSTATS/abs@nrp.nsf/Latestproducts/LGA3 South Australian pastoral zone. Journal of Applied
Population/People12007-2011?opendocument&tabname= Ecology 1993; 30: 444–458.
Summary&prodno=LGA3&issue=2007-2011). Accessed 48. Australia Bureau of Statistics. National Regional Profile:
4 April 2014. South Australia: Australian Government (http://www.
41. Rosen L, Gubler DJ, Bennett PH. Epidemic polyarthri- abs.gov.au/AUSSTATS/abs@nrp.nsf/Latestproducts/
tis (Ross River) virus infection in the Cook Islands. LGA4Population/People12007-2011?opendocument&
American Journal of Tropical Medicine and Hygiene tabname=Summary&prodno=LGA4&issue=2007-2011.).
1981; 30: 1294–1302. Accessed 4 April 2014.
Downloaded from https://www.cambridge.org/core. IP address: 46.4.80.155, on 22 Feb 2021 at 17:49:45, subject to the Cambridge Core terms of use, available at https://www.cambridge.org/core/terms.
https://doi.org/10.1017/S0950268816002739You can also read