Summarised audited results for the year ended 31 March 2017 - South Africa
←
→
Page content transcription
If your browser does not render page correctly, please read the page content below
NS
                                  RIZO
                               HO
                           W
                         NE

Summarised audited results for
the year ended 31 March 2017
Highlights

CORPORATE PROFILE
Vukile is a high quality, low-risk retail REIT. Its core strength in active asset management
drives its strong operational performance. It has an entrepreneurial approach to deal making
and a conservative approach to financial management and balance sheet structure, as well
as deep capital markets expertise. Listed on the JSE and NSX, its proven management
track record shows active commitment to good corporate governance and sector leadership.
From its strong South African base, Vukile is well positioned to expand its business offshore.
Vukile has consistently delivered long-term sustainable returns to shareholders, providing a
21.8% compound annual growth rate since listing in 2004.

Successful
transformation
into a focused retail REIT

                                                  7.1% growth
                                                  in annual dividends

Well positioned
for further international expansions
Continued
                                       strong
                                       retail trading metrics

                                                                Strong
                                                                balance
                                                                sheet
                                                                with a gearing ratio of 23%

Corporate rating
of “A” with a positive outlook and “AA+” on senior
secured bonds
Commentary

1.      NATURE OF OPERATIONS
        The group is a long-term investor in a retail-focused property portfolio with strong contractual cash flows for sustainability
        and capital appreciation.

2.      SIGNIFICANT EVENTS AND TRANSACTIONS
        During this reporting period, the following significant transactions were effected which resulted in Vukile transforming
        into a retail REIT as follows:
        1. The sale of the sovereign portfolio for R1.18 billion at 31 August 2016;
        2. The purchase of Synergy Income Fund Limited’s (Synergy) R2.5 billion retail portfolio in exchange for the bulk of
           Vukile’s office and industrial portfolio for a similar value;
        3. Acquisition of remaining 50% of Pinecrest Shopping Centre for R407 million.
        4. The acquisition of a 25% undivided share in Springs Mall for R260 million. The mall opened in March 2017.
        5. The completion of a R230 million (50%) revamp and extension of East Rand Mall.
        6. The €13 million acquisition of 86.89% of Castellana Properties SOCIMI SA (Castellana), a Spanish REIT.
        7. A further £10.7 million investment in Atlantic Leaf Properties Limited (Atlantic Leaf), increasing Vukile’s shareholding
           to 29.6%.

3.      SUMMARY OF FINANCIAL PERFORMANCE
        The directors of Vukile are pleased to report that the dividend for the six months ended 31 March 2017 has increased
        by 7.2% to 89.1025 cents per share, despite a yield drag following the sale of the sovereign portfolio at 31 August 2016
        at a 12% yield. The proceeds of the sale were utilised to repay debt (R678 million) and invested in the money market
        (R503 million) at lower yields, while management has been evaluating opportunities to deploy the proceeds internationally.
        The dividends for the full year rose by 7.1% to 156.75 cents per share.

        The group’s net profit after tax for the year ended 31 March 2017 amounted to R1.5 billion (March 2016: R1.6 billion).
        The current results reflect a loss of control of Synergy of R277 million, which amount does not affect distributable
        earnings.

        The group’s net profit available for distribution amounted to R1.12 billion for the year ended 31 March 2017, which
        represents an increase of 12.2% over the comparable period – refer note 1 to the Annual Financial Statements.

        The proposed total dividend is made up as follows:

                                                                                                                                       Cents
                                                                                                                    Rm         %    per share
         First
        J                                                                                                        467.2      42.8      67.65
         Second(1)
        J                                                                                                        625.4      57.2      89.10
        Total                                                                                                    1 092.6    100.0     156.75
        (1)
                Based on shares in issue at 31 March 2017.

        An additional distribution of R19.7 million was paid in June 2016 following a R400 million share issuance in April 2016.
        The shareholders who participated in the issuance were entitled to receive the March 2016 second half distribution.

        Dividend per share is the key measure to be used for trading statement purposes.

                                                                                                                  2017      2016         %
        Key financial measures                                                                                   March     March     change
        Dividends per share (cents)                                                                              156.75    146.35         7.1
        Earnings (Rm)                                                                                             1 499     1 586        (5.5)
        Net asset value per share (cents)                                                                         1 868     1 842         1.4
        Loan to value ratio (%)(I)                                                                                 29.2      31.9         8.6
        Loan to value ratio net of cash (%)(II)                                                                    22.6      26.9       16.0
        Gearing ratio (%)(III)                                                                                     23.0      29.5       22.0
        (I)
                Based on directors’ valuations of the group’s portfolio at 31 March 2017.
        (II)
                Based on (I) above less cash net of cash held on deposit from tenants.
        (III)
                The gearing ratio is calculated by dividing total interest-bearing borrowings by total assets.

02 Vukile summarised audited results for the year ended 31 March 2017
4.   GROUP PROPERTY PORTFOLIO OVERVIEW(1)
     The Southern African property portfolio at 31 March 2017 consisted of 67 properties with a total market value of
     R13.1 billion (excluding the 20% non-controlling interest in Moruleng Mall) and gross lettable area of 936 459m², with
     an average value of R196 million per property.

     The geographical and sectoral distribution of the group’s portfolio is indicated in the tables below. The portfolio is well-
     represented in most of the South African provinces and Namibia. Some 75% of the gross income is derived from
     Gauteng, KwaZulu-Natal, Namibia and Western Cape.

     Geographic profile
                                                                                                                                   Total
                                                                                                                                portfolio
     % of gross income                                                                                                                %
     Gauteng                                                                                                                          37
     KwaZulu-Natal                                                                                                                    21
     Namibia                                                                                                                           9
     Western Cape                                                                                                                      8
     North West                                                                                                                        6
     Free State                                                                                                                        6
     Limpopo                                                                                                                           5
     Mpumalanga                                                                                                                        5
     Eastern Cape                                                                                                                      3

     Based on market value, 91% of the group portfolio is in the retail sector, followed by 4% in the office, 3% in the
     industrial, 1% in the motor-related sector and 1% in the residential sector.

     The tenant profile is listed in the table below:
     Tenant profile
                                                                                                                      Total
                                                                                                                   portfolio       Retail
     % of GLA                                                                                                            %            %
     Large national and listed tenants and major franchises                                                              65           72
     National and listed tenants, franchised and medium to large professional firms                                      11            9
     Other                                                                                                               24           19

     The retail portfolio’s exposure to national, listed and franchised tenants is 81% in total.

     Vukile has low tenant concentration risk with the top 10 tenants accounting for 40.4% of total rent and 31.0% of total
     GLA. Based on rent the Steinhoff group is the single largest tenant, with 7.2% of total rent (6.2% of total GLA), with
     Shoprite the second largest at 5.6% of total rent (8.6% of total GLA).

     The top 10 properties, all of which are retail assets, have 89.2% exposure to national, listed and franchised tenants and
     represent 44.4% of the total portfolio market value and 30.7% of the total portfolio GLA.

     (1)
           All of the above information excludes the two properties owned by Castellana. Information on these two properties is set out in
           paragraph 3(v).

                                                                      Vukile summarised audited results for the year ended 31 March 2017 03
Commentary continued

        Top 10 properties by value
                                                                                                Directors’
                                                                                                valuation
                                                                                                       at
                                                                                       Rentable 31 March
                                                                                           area     2017                     % Valuation
        Property                                                              Location       m2       Rm               of total     R/m2
        Boksburg East Rand Mall*                                            Gauteng          34 712         1 277           9.8      36 794
        Durban Phoenix Plaza                                          KwaZulu-Natal          24 351           791           6.0      32 500
        Pinetown Pine Crest                                           KwaZulu-Natal          40 087           786           6.0      19 603
        Soweto Dobsonville Mall                                             Gauteng          23 236           513           3.9      22 060
        Gugulethu Square                                               Western Cape          25 322           480           3.7      18 944
        Queenstown Nonesi Mall                                         Eastern Cape          28 147           421           3.2      14 940
        Moruleng Mall#                                                   North West          25 137           394           3.0      15 658
        Oshakati Shopping Centre                                            Namibia          24 632           390           3.0      15 834
        Phuthaditjhaba Setsing Crescent                                   Free State         21 538           385           2.9      17 860
        Randburg Square                                                     Gauteng          40 767           380           2.9       9 331
        Total                                                                               287 929         5 817          44.4      20 204
        * Represents an undivided 50% share in this property.
        #
          Represents an 80% share in the company.

5.      VALUATION OF PORTFOLIO
        The accounting policies of the group require that the directors value the entire portfolio every six months at fair market
        value. Approximately one-half of the portfolio is valued every six months, on a rotational basis, by registered independent
        third-party valuers. The directors have valued the group’s property portfolio at R13.1 billion(1) as at 31 March 2017. This
        is R2.5 billion or 16.0% lower than the valuation as at 31 March 2016 due to the Gemgrow transaction and the sale of
        the sovereign portfolio. The market value of the stable portfolio increased by 7.3%. The calculated recurring forward
        yield for the portfolio is 8.6%.

        During the year all properties were valued by external valuers and the valuations by Quadrant Properties (Pty) Ltd and
        Knight Frank (Pty) Ltd are in line with the directors’ valuations.

        (1)
              The Southern African property portfolio overview takes into account Moruleng Mall at 80%, whereas in the financial statements the
              group property value reflects 100% of Clidet No 1011, which owns Moruleng Mall, and also excludes the two properties held in
              Castellana.

6.      PROPERTY PORTFOLIO PERFORMANCE
                                                                                                           March         March
        Financial performance for the stable portfolio (excluding recent                                    2017          2016           %
        acquisitions and sales)                                                                              Rm            Rm        change
        Property revenue                                                                                  1 087.4      1 012.9           7.4
        Recurring net property expenses                                                                    (181.5)       (188.4)         3.7
        Net property income                                                                                 905.9        824.5           9.9
        Property net expense ratios (%)                                                                       16.7         18.6         10.3

        New leases and renewals in excess of 180 000m² with a contract value of R1.27 billion were concluded during the year
        to date. Some 80% of leases to be renewed during the 12 months ended 31 March 2017 were renewed or are in the
        process of being renewed.

04 Vukile summarised audited results for the year ended 31 March 2017
Details of large contracts concluded:
                                                                                                   Contract        Lease
                                                                                                      value      duration
Tenant                                         Property                                                 Rm         years
Game Stores                                    Pinetown Pine Crest                                        60.9           9
OK Bazaars                                     Randburg Square                                            56.3          10
Spar                                           Elim Hubyeni Shopping Centre                               53.8          10
Spar                                           Hartbeespoort Sediba Shopping Centre                       42.2          10
World Food Programme South Africa              Sandton Sunninghill Sunhill Park                           27.1           5
Barloworld South Africa                        Cape Town Bellville Barons                                 24.8          10
ADT Security                                   Midrand Ulwazi Building                                    20.6          10
Spar                                           Makhado Nzhelele Valley Shopping Centre                    20.0           9
Dis-Chem                                       Germiston Meadowdale Mall                                  16.1          10
Jet Stores                                     Durban Phoenix Plaza                                       14.1           5

The group lease expiry profile table reflects that 22% of the leases are due for renewal in the 2018 financial year.
Approximately 39% of leases are due to expire in 2021 and beyond (up from 33% beyond 2020 in the prior year).

                                                                                                                  Beyond
                                                              March        March         March        March        March
                                                 Vacant        2018         2019          2020         2021         2021
Group lease expiry % of GLA                          %           %            %             %            %            %
GLA                                                                22           21            14            8           31
Cumulative as at March 2017                           4.3          26           47            61           69          100
Cumulative as at March 2016                           3.9          47           67            78           85          100

Vacancies
At 31 March 2017 the portfolio’s vacancy (measured as a percentage of gross lettable area) was 4.3% compared to
3.9% at 31 March 2016. The retail portfolio vacancies based on GLA increased from 3.5% to 3.8%.

The vacancy per sector (measured as a percentage of gross lettable area) is indicated in the table below:

                                                                                          31 March
                                                                      31 March                 2017
                                                                          2017            including
                                                     31 March      development         development               31 March
                                                         2017          vacancy             vacancy                   2016
Vacancies (% of GLA)                                        %                %                   %                     %
Retail                                                    3.8               0.6                     4.4                 3.5
Offices                                                    8.4                –                     8.4                 5.0
Industrial                                                 7.2                –                     7.2                 4.3
Motor related                                                –             23.9                    23.9                   –
Sovereign                                                                                                               4.2
Hospital                                                                                                                  –
Total                                                       4.3                 0.7                 5.0                 3.9

At 31 March 2017, the portfolio’s vacancy (measured as a percentage of gross rental) decreased to 4.2% compared to
5.0% at 31 March 2016.

                                                        Vukile summarised audited results for the year ended 31 March 2017 05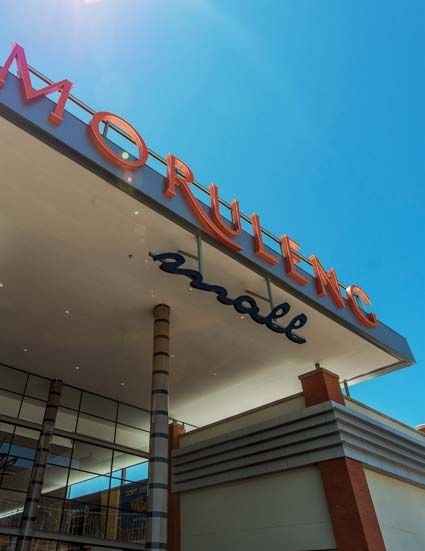
Commentary continued

                                                                                                 31 March
                                                                                  31 March            2017
                                                                                      2017       including
                                                                    31 March   development    development          31 March
                                                                        2017       vacancy        vacancy              2016
        Vacancies (% of gross rental)                                     %             %               %                %
        Retail                                                           3.6            0.5                 4.1           4.0
        Offices                                                         12.6              –                12.6           9.6
        Industrial                                                       7.2              –                 7.2           5.8
        Motor related                                                      –            9.7                 9.7             –
        Sovereign                                                                                                         3.6
        Total                                                            4.2            0.6                 4.8           5.0

        GLA summary                                                                                                  GLA m²
        Balance at 1 April 2016                                                                                    1 427 591
        GLA adjustments                                                                                                 (147)
        Disposals                                                                                                   (513 156)
        Acquisitions and extensions                                                                                   22 171
        Balance at 31 March 2017                                                                                    936 459

        Vacancy summary                                                                              Area m²               %
        Balance at 31 March 2016                                                                      55 139              3.9
        Less: Properties sold since 31 March 2016                                                    (23 681)            (4.6)
        Remaining portfolio balance at 31 March 2016                                                   31 458             3.4
        Leases expired or terminated early                                                           206 242
        Renewal of expired leases                                                                   (112 103)
        Contracts to be renewed                                                                       (26 789)
        Tenants vacated                                                                               (66 308)
        Development vacancy                                                                             (7 034)
        New letting of vacant space                                                                    14 701
        Balance at 31 March 2017                                                                      40 167              4.3

        Base rentals (excluding recoveries)
        The weighted average monthly base rental rates per sector, between 31 March 2016 and 31 March 2017, are set out
        in the table below:

                                                                                    March              March      Escalations
        Weighted average base rentals (R/m²) excluding recoveries                    2017               2016               %
        Retail                                                                      122.88            114.61              7.2
        Offices                                                                      90.25             94.56             (4.6)
        Industrial                                                                   51.96             44.65            16.4
        Motor related                                                               135.46            121.91            11.1
        Sovereign                                                                                     101.50
        Hospital                                                                                      106.55
        Total                                                                       115.42             96.71            19.3

        The increased average rental rates on the total portfolio is due to the focused retail exposure.

        The average contractual rental escalation of 7.4% is slightly lower than the previous year (7.6%).

        The average escalation on expiry rentals on the total portfolio of 6.7% is positive against the backdrop of a difficult
        trading environment. Positive reversions were achieved across all sectors with retail at 6.9%, offices at 5.0% and
        industrial at 4.1%.

06 Vukile summarised audited results for the year ended 31 March 2017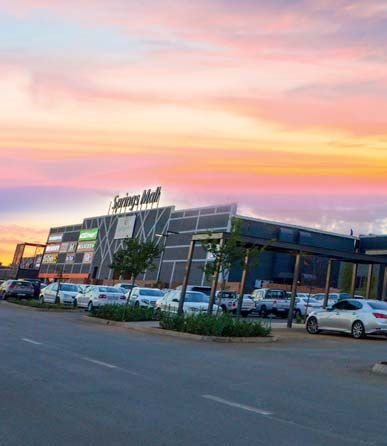
Expense categories and ratios
     The top four expense categories contribute 82% of the total expenses. These are: government services (46%), rates
     and taxes (17%), cleaning and security (11%) and property management fees (8%).

     The group continuously evaluates methods of containing costs in the portfolio. The stable portfolio’s recurring net
     costs-to-income ratios have improved from 18.6% in March 2016 to 16.7% in March 2017.

7.   DEVELOPMENTS, ACQUISITIONS AND SALES
     Upgrades/redevelopments – R873 million
     As part of the ongoing strategy to improve the quality of the existing portfolio, the following projects have been
     completed or are in progress.

     East Rand Mall
     East Rand Mall (in which the company owns a 50% undivided share with Redefine Properties Limited) has been
     upgraded and extended at a total cost of R460 million, of which Vukile’s share is R230 million. The project was
     completed by January 2017 and the projected yield on the total capex is 5.3%.

     East Rand Mall, regarded as one of the top regional malls in South Africa, had a GLA of 63 460m², which was increased
     to c.70 000m². The main entrances, malls, some shop fronts, ceilings and toilets have been upgraded, while some
     areas have been reconfigured to allow better utilisation of the available space. New generators and a new PV cell solar
     installation have been installed to provide full backup power to the centre during power outages.

     The extension of 6 540m² incorporates a relocated entrance four and a youth-oriented mall anchored by a Mr Price
     emporium, consisting of its apparel, sport and home outlets comprising about 3 700m² and Cotton-On (1 250m²).
     International retailer H&M (2 485m²) started trading in a reconfigured existing section of the centre in December 2016.

     Together with the adjacent East Point (previously East Rand Galleria), which has also been upgraded, shoppers can
     now experience a dominant super-regional shopping centre with a GLA of about 120 000m².

     Durban: The Workshop
     The upgrade of R75 million to The Workshop in Durban was completed in February 2017.

     The project included the upgrade of the various ablution facilities, the reconfiguration and upgrade of the food court,
     the replacement of all the shop fronts and mall tiles, the installation of new ceilings in selected areas, installing energy
     efficient lighting in the mall areas and an increase of natural light, the installation of a new glass-enclosed passenger lift,
     painting of the interior steel features, the exterior and the roof and a redesign of the centre logo.

     More than 30 new tenants have commenced trading in the centre since the upgrade started, including Pep Stores,
     Dunns, Ackermans, McDonald’s, KFC, Pie City, Gingers International, Heart and Sole Fish, Hero Pies & Hot Dogs, Ice
     Cream Express, Fish Corner, Michael Brothers, Maharaj Pub & Grill, Edgars Connect, Spec Savers, FNB and Bidvest
     Bank.

     Bellville: Barons VW building
     The Bellville Barons VW building is situated at the Durban Road intersection with the N1 highway.

     The first phase of the reconfiguration of the vacant space into a Barloworld Ford dealership was completed by August
     2016. The first phase consists of the workshop and services areas. The second phase, the new and second-hand car
     show rooms and offices, commenced in January 2017 when Toys-R-Us vacated and will be completed by end July
     2017.

     The total capex is R35 million. A 10-year lease has been concluded with Barloworld Auto. A yield of 15.1%, net of
     costs, is anticipated.

                                                                 Vukile summarised audited results for the year ended 31 March 2017 07
Commentary continued

        Phuthaditjhaba: Setsing Crescent
        Setsing Crescent in Phuthaditjhaba was acquired with the Synergy transaction. The extension and upgrade of the
        centre at a total cost of R338 million and a projected net yield of 8,5% in the first year after completion has been
        approved. Flanagan & Gerard will be appointed as development managers for the project.

        Setsing Crescent, with a current GLA of about 22 000m², is the second biggest shopping centre in Phuthaditjhaba.

        The centre is anchored by a Super Spar, Game, Cashbuild, Clicks, all five major banks and a very strong national
        fashion component including Woolworths, Foschini, Ackermans and Truworths. The proposed extension will increase
        the GLA to c.34 000m² and the new tenants will include Pick n Pay as a second major food anchor. Most of the
        remainder of the new area will be let to national fashion retailers. Additional parking and an undercover taxi rank will also
        be provided.

        Building work is scheduled to start in June 2017 for completion by end September 2018.

        Dobsonville Mall: extension and partial upgrade
        Dobsonville Mall, situated in northern Soweto, is currently being redeveloped, expanding its existing retail GLA of
        20 307m² by 6 738m², thereby increasing the total retail GLA to 27 045m². A capex amount of R114 million was
        approved for the demolition of the office block (previously situated on the northern section of the site), the extension
        of the shopping mall, the upgrade of the entrances, limited internal improvements and the creation of a food court
        area. The projected net yield is 9.5%.

        Pick n Pay anchors the northern extension of the mall with a 2 500m² supermarket scheduled to open for trade in late
        August 2017. Additionally, the expanded area is 90% let comprising stores for Clicks, Foschini, Pick n Pay Liquor,
        PQ Clothing, PEP Home among other ancillary retailers.

        The mall continues to trade well attracting regular requests from prospective tenants to lease premises.

        Randburg Square
        Vukile’s conversion of its 8 000m² Randburg Square offices into 180 contemporary, compact residential apartments
        has created a new vibrant urban living option in the heart of Randburg. The project was completed on 31 October
        2016 at a cost of R81 million. With its quality compact living at affordable rentals, which range from R4 200 for a
        bachelor flat to R6 500 for a two-bedroom unit, Randburg Square residences has experienced full occupancy since
        early December 2016.

        Current Vukile projects
        A summary of major acquisitions and development projects approved and incurred to 31 March 2017 is set out below:

                                                                                                               Paid to              Budget
                                                                                                             31 March         April 2017 to
                                                                                         Approved                2017         March 2018
        Approved projects                                          Completion               R000                 R000                 R000
        Durban: The Workshop                                28 February 2017                75 000              73 637               1 363
        Boksburg: East Rand Mall                               31 January 17               230 000             206 093              23 907
        Durban: Phoenix Plaza                                31 August 2017                 24 500               7 981              16 519
        Bellville: Barons Ford                                  30 July 2017                35 400              20 077              15 323
        Dobsonville Centre Extension                         31 August 2017                114 000              54 461              59 539
        Thohoyandou: Thavhani Mall(I)                        31 August 2017                350 076                   –             350 076
        Springs Mall                                          16 March 2017                260 000             260 000                   –
        Phuthaditjhaba: Setsing Crescent(II)                31 October 2018                338 000                   –             167 887
        Randburg Residential (inclusive of VAT)             30 October 2016                 81 000              77 449               3 551
                                                                                        1 507 976              699 698             638 165
        (I)
             The financing for Thavhani Mall has already been raised and is invested in a R350 million two-year deposit earning 8.4% per annum,
             pending completion of this mall. The other projects will be financed out of the proceeds from property sales and existing bank
             facilities.
        (II)
             Further payments will be made after 31 March 2018.

08 Vukile summarised audited results for the year ended 31 March 2017
Acquisitions – R3.1 billion
Springs Mall
Vukile has acquired a 25% stake in the 48 224m² Springs Mall for R260 million. The centre was developed and is
managed by Blue Crane Eco Mall (Pty) Ltd, in which Flanagan & Gerard is a shareholder.
Springs Mall opened on 16 March 2017 creating a superb new retail offering that was sorely lacking in the town. The
opening was a huge success with some 160 000 people visiting the mall during the first seven days of trading.
At opening, the mall was fully let and anchored by Pick n Pay, Checkers, Woolworths and Edgars, while negotiations
are continuing with Game to also lease premises in the centre.
The initial yield of 8% is guaranteed by the developers.
The property was prefunded and is accretive from day one.
Pine Crest Shopping Centre
Vukile acquired the remaining 50% share of Pine Crest Shopping Centre, which is situated in Pinetown, KwaZulu-Natal.
The centre is a 40 087m² regional shopping centre with an average footfall of 930 000 per month. Pine Crest has served
the community for over 25 years and offers a quality retail shopping experience with over 90 stores, including many of
the biggest clothing brands in the country. Anchor tenants include Game, Pick n Pay, Woolworths and a new Dis-Chem
which will be introduced in July 2017. The 50% stake was purchased for R407 million at an initial yield of 8.6% and
transfer was effected in March 2017.
Synergy portfolio
The Synergy retail portfolio of R2.4 billion was acquired as part of the Synergy, Vukile, Arrowhead transaction, whereby
Vukile acquired the Synergy retail portfolio in exchange for the bulk of its office and industrial portfolio. Details of the
portfolio that was acquired are as follows:
Purchase
price
Rm
Properties acquired from Synergy 2 474,6
Atlantis City Shopping Centre Retail 302,1
Elim Hubyeni Shopping Centre Retail 127,5
Emalahleni Highland Mews Retail 224,0
Ermelo Game Centre Retail 53,8
Gugulethu Square Retail 415,0
Hammanskraal Renbro Shopping Centre Retail 160,4
Hartbeespoort Sediba Shopping Centre Retail 121,5
Hillcrest Richdens Shopping Centre Retail 137,4
KwaMashu Shopping Centre Retail 103,3
Makhado Nzhelele Valley Shopping Centre Retail 55,9
Phuthaditjhaba Setsing Crescent Retail 328,0
Roodepoort Ruimsig Shopping Centre Retail 119,4
Ulundi King Senzangakona Shopping Centre Retail 262,3
Welgedacht Van Riebeeckshof Shopping Centre Retail 64,0
Vukile summarised audited results for the year ended 31 March 2017 09Commentary continued
Property sales concluded during the year – R4.1 billion
In line with the group’s strategy to focus on retail assets the following properties were disposed of during the year in
addition to the Synergy/Vukile exchange transaction referred to above:
Sales Yield
R000 price % Dates of sale
Bloemfontein Fedsure House 89 700 8.6 31 August 2016
Pretoria Arcadia Suncardia 265 600 10.0 31 August 2016
Pretoria De Bruyn Park 305 100 9.3 31 August 2016
Pretoria Koedoe Arcade 129 700 12.2 31 August 2016
Pretoria Navarre Building 391 200 16.1 31 August 2016
Cape Town Bellville Louis Leipoldt 384 732 8.0 3 February 2017
Cape Town Parow De Tijger Day Clinic 32 672 8.0 14 February 2017
Cape Town Parow De Tijger Office Park 39 933 11.8 14 February 2017
1 638 637 11.0
The following portfolio consisting of mainly offices and industrial properties was sold to Synergy (renamed to Gemgrow)
in exchange for its retail portfolio. The effective date of the transaction was 1 October 2016 and the details are as
follows:
Sales
price
Rm
Properties sold to Gemgrow 2 432,0
Cape Town Bellville Suntyger Offices 63,6
Cape Town Bellville Tijger Park Offices 241,3
Cape Town Parow Industrial Park Industrial 77,7
Durban Valley View Industrial Park Industrial 138,1
East London Vincent Office Park Offices 86,0
Germiston Meadowdale R24 Industrial 177,8
Johannesburg Isle of Houghton Offices 283,0
Johannesburg Parktown 55 Empire Road Offices 50,8
Midrand IBG Offices 71,1
Pinetown Westmead Kyalami Industrial Park Industrial 89,8
Pretoria Hatfield Festival Street Offices Offices 55,0
Pretoria High Court Chambers Offices 143,9
Pretoria Lynnwood Excel Park Offices 27,9
Pretoria Lynnwood Sanlynn Offices 145,0
Pretoria Lynnwood Sunwood Park Offices 66,0
Pretoria Silverton 22 Axle Street Industrial 11,3
Pretoria Silverton 294 Battery Street Industrial 23,6
Pretoria Silverton 301 Battery Street Industrial 18,5
Pretoria Silverton 309 Battery Street Industrial 20,9
Pretoria Silverton 330 Alwyn Street Industrial 4,7
Pretoria Silverton 34 Bearing Crescent Industrial 26,2
Randburg Trevallyn Industrial Park Industrial 144,0
Randburg Tungsten Industrial Park Industrial 55,4
Roodepoort Robertville Industrial Park Industrial 92,9
Sandton Bryanston Grosvenor Shopping Centre Retail 58,1
Sandton Bryanston St Andrews Complex Offices 86,9
Sandton Hyde Park 50 Sixth Road Offices 54,4
Sandton Rivonia 36 Homestead Road Offices 32,0
Sandton Sunninghill Place Offices 85,9
The proceeds from property sales have been used to repay debt, as well as provide funding for potential accretive
acquisitions, both locally and internationally.
10 Vukile summarised audited results for the year ended 31 March 20178. BORROWINGS
The group’s finance strategy is to minimise funding costs and refinance risk. The business objectives that are necessary
to implement this strategy can be summarised as follows:
Strategy 2017 2016
Diversify funders to at least three providers Five funders Five funders
Diversify funding structures to incorporate, where appropriate: % of total % of total
Bank debt 63 69
Secured bonds 21 19
Commercial paper/unsecured bonds 16 12
100 100
Spread expiry terms of all interest-bearing debt to c.25% per annum Partly achieved Achieved
86.4%
Hedge or fix more than 75% of interest-bearing debt 95.1%(II) hedged(II)
Achieved through increase in
access facilities repayable
Maximise interest income and limit negative carry without break costs
(II)
Vukile and its subsidiaries – excludes development debt and commercial paper.
Ratings
The Global Credit Rating Company (Pty) Ltd (GCR) has recently affirmed an “A” corporate rating with a positive outlook
and an “AA+” (RSA) rating on Vukile’s senior secured bonds.
Debt refinancing during the year ended 31 March 2017
Bond
J refinancing
• R200 million corporate bond was repaid in May 2016
• R85 million of commercial paper was repaid during the year under review
• R387 million of commercial paper was refinanced during the year.
Bank
J refinancing
Repayments
• R163.3 million bank debt was repaid in April 2016
• R617 million Absa debt was repaid during the year
• R160 million Standard Bank debt was paid in September 2016.
Vukile summarised audited results for the year ended 31 March 2017 11Commentary continued
New loans
• £10.7 million (R180 million) Absa loan was raised in November 2016 to subscribe for an Atlantic Leaf equity raise
Loan amount Rate Expiry date
£1.35 million Libor + 2.45% 31 October 2021
£1.35 million Libor + 2.25% 31 October 2019
£4.0 million Hedged 2.99% 31 October 2019
£4.0 million Hedged 3.40% 31 October 2021
• €13 million (R186 million) Standard Bank loan was raised to finance an acquisition of an 86.89% shareholding in
Castellana
Loan amount Rate Expiry date
€6.5 million Eurobor + 2.38% 20 December 2020
€6.5 million Eurobor + 2.33% 20 December 2019
• R100 million Nedbank loan was raised to finance capex
Loan amount Rate Expiry date
R100 million Hedged 9.55% 30 January 2020
Increase
J in draw down of existing facilities to fund capital expenditure
• RMB – R59 million
• Standard Bank – R122 million.
Equity
J issuance and dividend reinvestment (DRIP)
• Vukile issued 23 668 639 shares under an accelerated bookbuild on 21 April 2016 at R16.90 per share amounting
to R400 million.
• Shares issued under an election to reinvest cash dividends in return for shares are summarised as follows:
º 21 June 2016 – 19 307 492 shares (56%) at R16.15901 amounting to R312 million
º 21 December 2016 – 11 242 114 shares (42%) at R17.19 per share amounting to R193 million.
Encha
J equity tap structure
The existing Encha equity tap structure has been very successfully utilised to grow Vukile’s empowerment shareholding.
Given that the facilities expire in August 2017 and the success achieved, Vukile will propose to extend the existing
facility for a further year in order to access the unutilised portion of the facilities of R500 million and further grow its
empowerment credentials.
Debt repayment profile
The table below sets out the various tranches of debt payable by the group over the following 11 years:
Total
2025 gross
2018 2019 2020 2021 2022 2023 2024 to 2027 2028 debt
R000 R000 R000 R000 R000 R000 R000 R000 R000 R000
1 086 936 1 405 919 629 700 524 860 96 730 6 620 156 620 19 836 99 264 4 026 485
27.0% 34.9% 15.6% 13.0% 2.4% 0.2% 3.9% 0.5% 2.5% 100.0%
12 Vukile summarised audited results for the year ended 31 March 20179. INTEREST RATE HEDGING
At year-end, net debt, excluding development loans and commercial paper, amounted to R3.74 billion. Swaps totalling
R3.56 billion have been concluded which equates to 95.1% of debt.
The swap expiry profile per financial year is set out below:
Swap expiry profile per financial year
31 March 31 March 31 March 31 March 31 March 31 March
2018 2019 2020 2021 2022 2023 Total
R000 R000 R000 R000 R000 R000 R000
181 667 647 208 260 916 1 233 254 836 583 401 000 3 560 628
5.1% 18.2% 7.3% 34.6% 23.5% 11.3% 100%
This table above reflects that 77% of swaps expire March 2020 and beyond.
The current swaps in place represent 3.4 years cover.
The company’s borrowing capacity is unlimited in terms of its Memorandum of Incorporation (MOI). The group’s loan to
value ratio at 31 March 2017 based on the directors’ valuations of the property portfolio was 29.2% (March 2016:
31.9%) compared to the bank’s covenants of 50%, the DMTN covenants of 40% in respect of those properties
mortgaged as security under the DMTN programme and 45% in respect of total group debt as a percentage of the
value of total group investment properties. The group has unutilised bank facilities of R471 million at 31 March 2017.
10. INTERNATIONAL EXPANSION
In the year ahead Vukile will look to increase its international exposure to developed Europe by pursuing both the
UK and Spanish markets. The UK exposure will be driven through its strategic 29.56% shareholding in Atlantic Leaf.
The Spanish economy is currently providing one of the most attractive growth rates in the European Union and is
showing a steadily improving economic outlook as evidenced by its recent credit upgrade. Consumption expenditure
is rising and unemployment rates are falling. Tourism continues its upward trajectory. Against this backdrop, Vukile will
look to increase its exposure to Spain through its majority shareholding in Castellana and is currently actively reviewing
a retail portfolio.
11. PROSPECTS
Vukile is very well positioned as a defensive, conservatively geared and managed retail REIT able to navigate an
increasingly fragile economic and political environment in South Africa. As stated previously, the local focus will continue
to be around accretive expansion and development opportunities within its own portfolio and, where possible, through
acquisitions.
The group has a strong balance sheet with approximately R1.5 billion of resources available following the sale of its
sovereign portfolio and other non-core assets. The available cash is earmarked for international expansion and
Vukile is currently actively evaluating an opportunity in Spain to diversify its earnings stream and enhance its high-
quality portfolio. The timing of the investment will impact on the growth in distributions in the financial year ending
31 March 2018.
If the current opportunities being explored are concluded within the anticipated timeline, Vukile expects to deliver
growth in dividends of between 7% and 8% for the year ahead while stronger long-term growth will be underpinned by
its well-positioned South African retail REIT platform and increased offshore exposure.
The forecast growth in dividends is based on the assumption that the macro-economic environment does not deteriorate
further and no major corporate failures will occur. Forecast rental income is based on contractual escalations and
market-related renewals. This forecast has not been reviewed or reported on by the company’s auditors.
Vukile summarised audited results for the year ended 31 March 2017 13Commentary continued
12. DECLARATION OF A CASH DIVIDEND WITH THE ELECTION TO REINVEST THE CASH
DISTRIBUTION IN RETURN FOR VUKILE SHARES
Notice is hereby given of a gross dividend amounting to 89.10250 cents per share, out of distributable income, for the
six-month period to 31 March 2017.
Shareholders will be entitled to elect (in respect of all or part of their holding) to reinvest the cash distribution of
89.10250 cents per share, in return for shares (the share reinvestment alternative), failing which they will receive the
cash dividend in respect of (all or part of) their holdings.
A circular providing further information in respect of the cash dividend and the share reinvestment alternative will be
posted to shareholders on or about 26 May 2017.
Shareholders who have dematerialised their shares are required to notify their duly appointed Central Securities
Depository Participant (CSDP) or broker of their election in the manner and time stipulated in the custody agreement
governing the relationship between the shareholder and their CSDP or broker.
Tax implications
Vukile was granted REIT status by the JSE Limited with effect from 1 April 2013 in line with the REIT structure
as provided for in the Income Tax Act, No 58 of 1962, as amended (the Income Tax Act) and section 13 of the
JSE Listings Requirements.
The REIT structure is a tax regime that allows a REIT to deduct qualifying dividends paid to investors, in determining its
taxable income.
The cash dividend of 89.10250 cents per share meets the requirements of a “qualifying distribution” for the purposes
of section 25BB of the Income Tax Act (a qualifying distribution) with the result that:
JDividends received by resident Vukile shareholders must be included in the gross income of such shareholders (as a
non-exempt dividend in terms of section 10(1)(k)(i)(aa) of the Income Tax Act), with the effect that the dividends are
taxable as income in the hands of the Vukile shareholder. These dividends are however exempt from dividends
withholding tax, provided that the South African resident shareholders provided the following forms to their CSDP or
broker, as the case may be, in respect of uncertificated shares, or the company, in respect of certificated shares:
• A declaration that the distribution is exempt from dividends tax
• A written undertaking to inform the CSDP, broker or the company, as the case may be, should the circumstances
affecting the exemption change or the beneficial owner cease to be the beneficial owner
both in the form prescribed by the Commissioner for the South African Revenue Service. Shareholders are advised
to contact their CSDP, broker or the company, as the case may be, to arrange for the abovementioned documents
to be submitted prior to payment of the distribution, if such documents have not already been submitted.
JDividends received by non-resident Vukile shareholders will not be taxable as income and instead will be treated as
ordinary dividends but which are exempt in terms of the usual dividend exemptions per section 10(1)(k) of the Income
Tax Act. It should be noted that until 31 December 2013 dividends received by non-residents were not subject to
dividends withholding tax. From 2016, any dividends are subject to dividends withholding tax. On 22 February 2017
the dividend withholding tax rate increased from 15% to 20%, unless the rate is reduced in terms of any applicable
agreement for the avoidance of double taxation (DTA) between South Africa and the country of residence of the
shareholder. Assuming dividends withholding tax will be withheld at a rate of 20%, the net distribution amount due to
non-resident shareholders is 71.28200 cents per share. A reduced dividend withholding rate in terms of the applicable
DTA, may only be relied upon if the non-resident holder has provided the following forms to their CSDP or broker, as
the case may be, in respect of uncertificated shares, or the company, in respect of certificated shares:
• A declaration that the dividend is subject to a reduced rate as a result of the application of a DTA
• A written undertaking to inform their CSDP, broker or the company, as the case may be, should the circumstances
affecting the reduced rate change or the beneficial owner cease to be the beneficial owner
both in the form prescribed by the Commissioner for the South African Revenue Service. Non-resident holders are
advised to contact their CSDP, broker or the company, as the case may be, to arrange for the abovementioned
documents to be submitted prior to payment of the distribution if such documents have not already been
submitted, if applicable.
14 Vukile summarised audited results for the year ended 31 March 2017Shareholders who are South African residents are advised that in electing to participate in the share reinvestment
alternative, pre-taxation funds are utilised for the reinvestment purposes and that taxation will be due on the total cash
dividend amount of 89.10250 cents per share.
Shareholders are further advised that:
Jthe issued capital of Vukile is 701 885 532 shares of one cent each at 22 May 2017
JVukile’s tax reference number is 9331/617/14/3.
This cash dividend or share reinvestment alternative may have tax implications for resident as well as non-resident
shareholders. Shareholders are therefore encouraged to consult their tax and/or professional advisers should they be
in any doubt as to the appropriate action to take.
Summary of the salient dates relating to the cash dividend and share reinvestment alternative are as follows:
2017
Circular and form of election posted to shareholders Friday, 26 May
Finalisation information including the ratio and price per share published on SENS Monday, 12 June
Last day to trade in order to participate in the election to receive the share reinvestment
alternative or to receive a cash dividend (LDT) Tuesday, 20 June
Share trade ex distribution Wednesday, 21 June
Listing of maximum possible number of shares under the share reinvestment alternative Friday, 23 June
Last day to elect to receive the share reinvestment alternative or to receive a cash dividend
(no late forms of election will be accepted) at 12:00 (SA time) Friday, 23 June
Record date for the election to receive the share reinvestment alternative or to receive a
cash dividend (record date) Friday, 23 June
Results of cash dividend and share reinvestment alternative published on SENS Monday, 26 June
Cash distribution cheques posted to certificated shareholders on or about Monday, 26 June
Accounts credited by CSDP or broker to dematerialised holders with the cash dividend
payment Monday, 26 June
Certificates posted to certificated shareholders on or about Wednesday, 28 June
Accounts updated with new shares (if applicable) by CSDP or broker to dematerialised
shareholders Wednesday, 28 June
Adjustment to shares listed on or about Friday, 30 June
Notes:
1. Shareholders electing the share reinvestment alternative are alerted to the fact that the new shares will be listed on
LDT + 3 and that these new shares can only be traded on LDT +3, due to the fact that settlement of the shares will
be three days after record date, which differs from the conventional one day after record date settlement process.
2. Shares may not be dematerialised or rematerialised between Tuesday, 20 June 2017 and Friday, 23 June 2017, both
days inclusive.
3. The above dates and times are subject to change. Any changes will be released on SENS.
Vukile summarised audited results for the year ended 31 March 2017 15Commentary continued
13. BASIS OF PREPARATION
The summarised audited consolidated financial statements for the year ended 31 March 2017, and comparative
information, have been prepared in accordance with and containing the information required by International Financial
Reporting Standards (IFRS), International Accounting Standard (IAS) 34 Interim Financial Reporting, the SAICA
Financial Reporting Guides as issued by the Accounting Practices Committee and Financial Reporting Announcements
as issued by the Financial Reporting Standards Council, the JSE Listings Requirements and relevant sections of the
South African Companies Act. Except for the amendments adopted as set out below, all accounting policies applied
by the group in the preparation of these consolidated financial statements are consistent with those applied by the
group in its consolidated financial statements as at and for the year ended 31 March 2016. The group has adopted
the following amendments to standards which were effective for the first time for the financial period commencing
1 April 2016:
J Amendments to IFRS 10 – Consolidated Financial Statements
J Amendments to IFRS 11 – Joint Arrangements
J Amendments to IAS 1 – Presentation of Financial Statements
J Amendments to IAS 16 – Property, Plant, and Equipment
J Amendments to IAS 28 – Investments in Associates
J Amendments to IAS 38 – Intangible Assets.
There was no material impact identified on the financial statements based on management’s assessment of these
amendments.
These statements, which comprise the statement of financial position at 31 March 2017 and the statement of
comprehensive income, statement of changes in equity and statement of cash flows for the 12 months then ended is
extracted from audited information, but is itself not audited. The annual financial statements were audited by
Grant Thornton, who expressed an unmodified opinion thereon. The auditor’s report does not necessarily cover all of
the information included in this announcement. Shareholders are therefore advised that, in order to obtain a full
understanding of the nature of the auditor’s work, they should obtain a copy of the audit report together with the
accompanying financial information from the registered office of the company situated at Ground Floor, One-On-Ninth,
Corner Glenhove Road and 9th Street, Melrose Estate.
The directors take full responsibility for the preparation of this report and that the financial information has been correctly
extracted from the underlying financial statements.
This report was compiled under the supervision of Michael John Potts CA(SA), the financial director of the company.
The directors are not aware of any matters or circumstances arising subsequent to 31 March 2017 that require any
additional disclosure or adjustment to the financial statements and which are not disclosed in this announcement.
On behalf of the board
AD Botha LG Rapp
Chairman Chief executive officer
Melrose Estate
23 May 2017
16 Vukile summarised audited results for the year ended 31 March 2017VUKILE PROPERTY FUND LIMITED
(Incorporated in the Republic of South Africa)
(Registration number 2002/027194/06)
JSE share code: VKE ISIN: ZAE000056370 NSX share code: VKN (granted REIT status with the JSE)
(Vukile or the group)
JSE sponsor: Java Capital
NSX sponsor: IJG Group, Windhoek, Namibia
Executive directors: LG Rapp (chief executive), MJ Potts (financial director), HC Lopion (executive director: asset
management), GS Moseneke
Non-executive directors: AD Botha (chairman), PS Moyanga, SF Booysen, RD Mokate, H Ntene, NG Payne, HM Serebro
There have been no changes to the board of directors since the release of the previous results announcement.
Registered office: Ground Floor One-on-Ninth, Corner Glenhove Road and Ninth Street, Melrose Estate, 2196
Company secretary: J Neethling
Transfer secretaries: Link Market Services South Africa (Pty) Ltd, Braamfontein, Johannesburg
Investor and media relations: Marketing Concepts, 10th Floor, Fredman Towers, 13 Fredman Drive, Sandton,
Johannesburg, South Africa. Tel: +27 11 783 0700, Fax: +27 11 783 3702
Availability of information – the results presentation will be made available at 12:00 on 24 May 2017, on the company’s
website at www.vukile.co.za
24 May 2017
Vukile summarised audited results for the year ended 31 March 2017 17Summarised consolidated statement of financial position
at 31 March 2017
2017 2016
GROUP R000 R000
ASSETS
Non-current assets 15 850 308 15 525 681
Investment properties 13 168 339 13 302 386
Investment properties 13 497 445 13 737 892
Straight-line rental income adjustment (329 106) (435 506)
Other non-current assets 2 681 969 2 223 295
Straight-line rental income asset 329 106 435 506
Investment in associate 780 347 760 049
Equity investments 1 366 239 328 247
Investment properties under development 51 191 87 033
Furniture, fittings, computer equipment and other intangible assets 14 049 2 127
Available-for-sale financial asset 23 855 19 842
Goodwill 63 009 158 372
Derivative financial instruments 1 722 41 230
Deferred taxation assets 14 341 2 779
Long-term cash deposit – 350 000
Long-term loans granted 38 110 38 110
Current assets 1 589 768 831 794
Trade and other receivables 256 405 246 873
Short-term derivative financial instruments 1 752 1 245
Current taxation assets 1 666 1 217
Cash and cash equivalents 1 329 945 582 459
Investment properties held for sale 76 632 1 997 744
Total assets 17 516 708 18 355 219
EQUITY AND RESERVES
Equity attributable to owners of the parent 13 111 425 11 932 574
Non-controlling interest 73 367 556 681
Non-current liabilities 2 964 638 4 114 331
Other interest-bearing borrowings 2 937 590 4 098 319
Derivative financial instruments 26 115 5 269
Deferred taxation liabilities 933 10 743
Current liabilities 1 367 278 1 751 633
Trade and other payables 354 370 439 937
Borrowings 1 002 581 1 309 687
Current taxation liabilities 8 892 2 009
Shareholders for dividend 1 435 –
Total equity and liabilities 17 516 708 18 355 219
Net asset value (cents per share) 1 868 1 842
18 Vukile summarised audited results for the year ended 31 March 2017Summarised consolidated statement of profit and loss
for the year ended 31 March 2017
2017 2016
GROUP R000 R000
Property revenue 1 964 202 2 096 400
Straight-line rental income accrual (161 077) 243 221
Gross property revenue 1 803 125 2 339 621
Property expenses (717 970) (780 584)
Net profit from property operations 1 085 155 1 559 037
Net income from asset management business – 2 074
Corporate and administrative expenses (96 155) (84 288)
Investment and other income 198 523 99 337
Operating profit before finance costs 1 187 523 1 576 160
Finance costs (362 074) (394 301)
Profit before capital items 825 449 1 181 859
Profit/(loss) on sale of investment properties 25 250 (31 883)
Profit on sale of furniture, fittings and equipment 92 –
Fair value gain/(loss) on listed property securities 105 739 (98 425)
Fair value movement of derivative financial instruments (6 251) (1 342)
Profit on sale of subsidiary 54 813 –
Foreign exchange profit 83 679 26 825
Loss of control on subsidiary (276 781) –
Profit on sale of listed property securities – 547
Other capital items (971) –
Gain on bargain purchase price – 1 053
Goodwill written off on sale of properties by a subsidiary (3 889) (4 951)
Costs of acquisition of business combination (66) (1 230)
Profit before fair value adjustments 807 064 1 072 453
Fair value adjustments 693 521 560 049
Gross change in fair value of investment properties 532 444 803 270
Straight-line rental income adjustment 161 077 (243 221)
Profit before equity accounted investment 1 500 585 1 632 502
Profit share of associate 45 251 19 423
Profit before taxation 1 545 836 1 651 925
Taxation (9 286) (9 076)
Profit for the year 1 536 550 1 642 849
Profit attributable to:
Owners of the parent 1 499 420 1 586 079
Non-controlling interests 37 130 56 770
Other comprehensive (loss)/income
Items that will be reclassified subsequently to profit or loss
Currency loss on translation of investment in foreign entities (157 781) (7 377)
Cash flow hedges
– Current period (losses)/gains (net of tax) (42 547) 40 673
– Reclassification to profit and loss (net of tax) 3 224 –
Available-for-sale financial assets – current year loss (15 206) (21 498)
Other comprehensive (loss)/income for the year (212 310) 11 798
Total comprehensive income for the year 1 324 240 1 654 647
Total comprehensive income attributable to:
Owners of the parent 1 287 981 1 597 664
Non-controlling interest 36 259 56 983
Basic and diluted earnings per share (cents)(1) 217.93 249.55
Weighted average number of shares in issue 688 024 118 635 569 998
Number of shares in issue 701 885 532 647 667 287
Vukile has no dilutionary shares in issue.
Vukile summarised audited results for the year ended 31 March 2017 19Reconciliation of earnings to headline earnings
for the year ended 31 March 2017
2017 2016
Group Cents per Group Cents per
R000 share R000 share
Attributable profit to owners of the parent 1 499 420 217.93 1 586 079 249.55
Earnings 1 499 420 217.93 1 586 079 249.55
Change in fair value of investment properties (net of
allocation to non-controlling interest) (676 899) (98.38) (546 188) (85.94)
Gain on bargain purchase – – (1 053) (0.17)
Write-off of goodwill on sale of properties sold by a
subsidiary 3 889 0.56 4 951 0.78
(Profit)/loss on sale of investment properties (25 250) (3.67) 31 883 5.02
Profit on sale of furniture, fittings, computer equipment
and other (92) (0.01) – –
Profit on sale of subsidiary (54 813) (7.97) – –
Loss of control of subsidiary 276 781 40.23 – –
Profit on sale of listed securities – – (547) (0.08)
Fair value earnings of associate-adjusted headline earnings 16 804 2.44 (7 353) (1.16)
Headline earnings of shares 1 039 840 151.13 1 067 772 168.00
Weighted average number of shares in issue 688 024 118 635 569 998
Summarised consolidated statement of cash flow
for the year ended 31 March 2017
2017 2016
Group Group
R000 R000
Cash flow from operating activities 1 104 588 1 282 446
Cash flow from investing activities 429 231 (2 124 331)
Cash flow from financing activities (1 135 957) 1 300 455
Net increase in cash and cash equivalents 397 862 458 570
Foreign currency movement in cash (376) –
Cash and cash equivalents at the beginning of the year 932 459 473 889
Cash and cash equivalents at the end of the year 1 329 945 932 459
Major items included in the above
Cash flow from operating activities
Profit before tax 1 545 836 1 651 925
Adjustments (378 051) (402 521)
Cash flow from investing activities
Acquisition of and improvements to investment properties (3 466 306) (1 578 544)
Investment in associate (180 677) (758 570)
Net proceeds on sale of investment properties 4 113 776 327 356
Cash flow from financing activities
Issue of shares 902 251 1 347 944
Dividends paid (1 049 031) (937 494)
Finance costs (355 764) (389 522)
Interest-bearing borrowings (repaid)/advanced (622 473) 1 280 901
20 Vukile summarised audited results for the year ended 31 March 2017Summarised consolidated statement of changes in equity
for the year ended 31 March 2017
Share capital Non- Shareholders’ Non-
and share distributable Retained interest controlling
R000 premium reserves earnings Total interest Total
GROUP
Balance at 31 March 2015 5 672 340 3 683 386 474 920 9 830 646 516 317 10 346 963
Issue of shares 1 396 223 – – 1 396 223 – 1 396 223
Dividend distribution – – (901 643) (901 643) (35 851) (937 494)
7 068 563 3 683 386 (426 723) 10 325 226 480 466 10 805 692
Profit for the year – – 1 586 079 1 586 079 56 770 1 642 849
Change in fair value of
investment properties – 803 270 (803 270) – – –
Change in fair value of
investments attributable to
non-controlling interest – (13 860) 13 860 – – –
Share-based remuneration – 15 770 – 15 770 – 15 770
Deferred taxation on change
in fair value of derivatives – (10 417) – (10 417) – (10 417)
Transfer from non-
distributable reserve – (8 409) 8 409 – – –
Cost of conversion of
debentures to stated capital
by subsidiary – (710) – (710) (389) (1 099)
Gain from change in
shareholding in subsidiary – 5 041 – 5 041 (5 863) (822)
Non-controlling interest
arising on business
combination acquired – – – – 25 484 25 484
Revaluation of investments – (98 425) 98 425 – – –
Other comprehensive
income – 11 585 – 11 585 213 11 798
Balance at 31 March 2016 7 068 563 4 387 231 476 780 11 932 574 556 681 12 489 255
Issue of capital 902 251 – – 902 251 – 902 251
Dividend distribution – – (1 025 270) (1 025 270) (25 196) (1 050 466)
7 970 814 4 387 231 (548 490) 11 809 555 531 485 12 341 040
Profit for the year – – 1 499 420 1 499 420 37 130 1 536 550
Change in fair value of
investment properties – 532 444 (532 444) – – –
Change in fair value of
investments attributable to
non-controlling interest – (16 622) 16 622 – – –
Share-based remuneration – 17 413 – 17 413 – 17 413
Deferred taxation on change
in fair value of derivatives – 1 750 – 1 750 – 1 750
Transfer to non-distributable
reserve – 104 024 (103 315) 709 – 709
Non-controlling interest
arising on business
combination acquired – – – – 26 855 26 855
Share issue expenses of a
subsidiary – (7 111) – (7 111) (3 829) (10 940)
Loss of control of subsidiary – (231 623) 232 751 1 128 (517 403) (516 275)
Revaluation of investments – 105 739 (105 739) – – –
Other comprehensive loss – (211 439) – (211 439) (871) (212 310)
Balance at 31 March 2017 7 970 814 4 681 806 458 805 13 111 425 73 367 13 184 792
Vukile summarised audited results for the year ended 31 March 2017 21Summarised operating segment reporting
The revenues and profits generated by the group’s operating segments and segment assets are summarised in the table
below.
During the year to 31 March 2017, there has been no change from prior periods in the measurement methods used to
determine operating segments and reported segment profits.
Operating segments analysis
for the year ended 31 March 2017
Retail – Retail –
Vukile Synergy Offices Industrial
GROUP R000 R000 R000 R000
Group income for the year ended 31 March 2017
Property revenue 971 669 130 497 161 734 88 742
Straight-line rental income accrual (104 301) (14 084) (18 348) (9 588)
867 368 116 413 143 386 79 154
Property expenses (net of recoveries) (168 820) (22 086) (20 501) (14 938)
Profit from property and other operations 698 548 94 327 122 885 64 216
Group statement of financial position at
31 March 2017
ASSETS
Investment properties 11 993 956 420 476 477 580
Add: Lease commissions
Goodwill 48 218
Investment properties held for sale 76 632
12 042 174 497 108 477 580
Add: Excluded items
Investment property under development
Equity investments
Investment in associate
Furniture, fittings, computer equipment and other
intangible assets
Available-for-sale financial asset
Derivative financial instruments
Loans receivable
Deferred taxation assets
Trade and other receivables
Taxation refundable
Cash and cash equivalents
Total assets
EQUITY AND LIABILITIES
Stated capital 7 053 483 292 343 280 859
Interest-bearing borrowings 3 486 712 144 512 138 836
10 540 195 436 855 419 695
Add: Excluded items
Other components of equity and retained earnings
Non-controlling interest
Derivative financial instruments
Deferred taxation liabilities
Trade and other payables
Current taxation liabilities
Shareholder for dividend
Total equity and liabilities
22 Vukile summarised audited results for the year ended 31 March 2017Foreign
Motor business Total
Residential Sovereign Hospital related Total combination group
R000 R000 R000 R000 R000 R000 R000
6 013 56 704 26 785 12 070 1 454 214 7 131 1 461 345
(518) (9 293) (3 420) (1 525) (161 077) – (161 077)
5 495 47 411 23 365 10 545 1 293 137 7 131 1 300 268
(2 022) 14 829 (462) (335) (214 335) (778) (215 113)
3 473 62 240 22 903 10 210 1 078 802 6 353 1 085 155
78 961 155 951 13 126 924 350 254 13 477 178
20 267 20 267
13 147 191 13 497 445
48 218 14 791 63 009
76 632 76 632
78 961 155 951 13 272 041 365 045 13 637 086
51 191
1 366 239
780 347
14 049
23 855
3 474
38 110
14 341
256 405
1 666
1 329 945
17 516 708
46 436 91 713 7 764 834 205 980 7 970 814
22 954 45 336 3 838 350 101 821 3 940 171
69 390 137 049 11 603 184 307 801 11 910 985
5 140 611
73 367
26 115
933
354 370
8 892
1 435
17 516 708
Vukile summarised audited results for the year ended 31 March 2017 23Summarised operating segment reporting continued
Operating segments analysis
for the year ended 31 March 2016
Retail – Retail –
Vukile Synergy Offices Industrial
GROUP R000 R000 R000 R000
Group income for the year ended 31 March 2016
Property revenue 755 239 250 024 270 331 133 659
Straight-line rental income accrual 114 687 39 266 40 799 20 367
869 926 289 290 311 130 154 026
Property expenses (net of recoveries) (134 785) (37 598) (49 608) (23 474)
Profit from property and other operations 735 141 251 692 261 522 130 552
Group statement of financial position at
31 March 2016
ASSETS
Investment properties 7 914 475 2 441 576 1 848 992 1 283 406
Add: Lease commissions
Goodwill 48 218 3 889
Investment properties held for sale 254 439 429 305
8 217 132 2 441 576 2 278 297 1 287 295
Add: Excluded items
Investment property under development
Equity investments
Investment in associate
Furniture, fittings and computer equipment
Available-for-sale financial asset
Derivative financial instruments
Loans receivable
Long-term cash deposit
Deferred taxation assets
Trade and other receivables
Taxation refundable
Cash and cash equivalents
Total assets
EQUITY AND LIABILITIES
Stated capital 3 679 264 1 099 682 1 026 142 578 047
Interest-bearing borrowings 2 814 925 841 343 785 082 442 249
6 494 189 1 941 025 1 811 224 1 020 296
Add: Excluded items
Other components of equity and retained earnings
Non-controlling interest
Derivative financial instruments
Deferred taxation liabilities
Trade and other payables
Current taxation liabilities
Total equity and liabilities
24 Vukile summarised audited results for the year ended 31 March 2017You can also read