Closing the Gap Prime Minister's Report 2015 - Department of the Prime Minister and Cabinet
←
→
Page content transcription
If your browser does not render page correctly, please read the page content below
Closing the Gap
Prime Minister’s Report
2015
© Commonwealth of Australia 2015
ISBN 978-1-925237-25-2 (Hardcopy)
ISBN 978-1-925237-26-9 (PDF)
ISBN 978-1-925237-27-6 (Word)

Ownership of intellectual property rights in this publication
Unless otherwise noted, copyright (and any other intellectual
property rights, if any) in this publication is owned by
the Commonwealth of Australia (referred to below as the
Commonwealth).
Creative Commons licence
With the exception of the Coat of Arms, this publication is
licensed under a Creative Commons Attribution 3.0 Australia
Licence.

Creative Commons Attribution 3.0 Australia Licence is a
standard form license agreement that allows you to copy,
distribute, transmit and adapt this publication provided that
you attribute the work. A summary of the licence terms is
available from http://creativecommons.org/licenses/by/3.0/
au/deed.en. The full licence terms are available from http://
creativecommons.org/licenses/by/3.0/au/legalcode.
The Commonwealth’s preference is that you attribute this
publication (and any material sourced from it) using the
following wording:
Source: Licensed from the Commonwealth of Australia under
a Creative Commons Attribution 3.0 Australia Licence.
The Commonwealth of Australia does not necessarily endorse
the content of this publication.
Use of the Coat of Arms
The terms under which the Coat of Arms can be used are set
out on the Department of the Prime Minister and Cabinet
website (see http://www.dpmc.gov.au/guidelines/).
Please be aware that this report may contain images of
Aboriginal and Torres Strait Islander people who have passed
away.
Introduction

 “It’s hard to be literate and                 The Government is now one year into its         the Closing the Gap targets and help to
                                               plan to address what have been intractable      address the most intractable difficulties in
numerate without attending                     issues around Indigenous disadvantage and       eliminating Indigenous disadvantage.
school; it’s hard to find work                 fundamentally change the way Indigenous
                                                                                               The other key priority for the Government is
                                               policies and programmes are delivered.
without a basic education;                     Reducing the levels of red tape and             to recognise Indigenous Australians in the
and it’s hard to live well                     administration is important, but our main       Constitution. A referendum should be held
                                                                                               as soon as possible once we are comfortable
without a job.”                                focus is on achieving results.
                                                                                               that we have a proposal with the best
                                               Achieving results requires more than just       chance of success. I hope that it might
I made this comment in the Australian
                                               government effort. I acknowledge and thank      happen on the 50th anniversary of the 1967
Parliament one year ago. It goes a long
                                               the communities, private sector and             referendum, on 27 May 2017. That would
way to explaining why the Government
                                               non-government sector for their work in         be a richly symbolic time to complete our
has spent the past 12 months focusing
                                               helping Aboriginal and Torres Strait Islander   Constitution.
our efforts in Indigenous Affairs on getting
                                               peoples achieve their full potential to live
children to school, adults into jobs and
                                               a good life. Andrew Forrest was asked for
making communities safer.
                                               his advice and has highlighted a broad
This is the seventh Closing the Gap Report     range of issues in his independent review of
produced since targets were set by the         employment and training.
Council of Australian Governments (COAG)
                                               The Government has received practical
in 2008. Despite good intention and
                                               advice from the Indigenous Advisory
considerable investment by successive
                                               Council, chaired by Warren Mundine, on          The Hon Tony Abbott MP
governments, the disparity in outcomes
                                               the three priority areas of getting children    Prime Minister of Australia
remains. Although there has been some
                                               to school, adults into jobs and making
improvement in education and health
                                               communities safer which are fundamental
outcomes for Indigenous Australians, in
                                               to improving the lives of Aboriginal and
many areas progress has been far too slow.
                                               Torres Strait Islander individuals, families
It is profoundly disappointing that most
                                               and communities. Focusing on these
Closing the Gap targets are not on track to
                                               priorities will produce real progress against
be met.

                                                                                                               Closing the Gap Report 2015    1
Overview of the Government’s priorities for
Indigenous Affairs
                                                                                                        This Government wants to work with
                                                                                                        Indigenous Australians and communities
                                                                                                        to make real improvements in their lives.
                                                                                                        We will do this while recognising the
                                                                                                        special place of Aboriginal and Torres Strait
                                                                                                        Islander peoples in our national story.

                                                                                                        The Commonwealth’s Indigenous Affairs
                                                                                                        agenda is aimed at building on previous
                                                                                                        work – but with a greater focus on
                                                                                                        areas that have been shown to improve
                                                                                                        outcomes for Aboriginal and Torres Strait
                                                                                                        Islander peoples.

                                                                                                        There are three priority areas that have
                                                                                                        been proven to have a positive effect on
                                                                                                        the lives of Aboriginal and Torres Strait
                                                                                                        Islander peoples:

                                                                                                        • getting children to school to provide the
                                                                                                          best chance of enjoying success in school
                                                                                                          and later in life

                                                                                                        • getting adults into work to ensure
                                                                                                          Indigenous Australians participate in the
                                                                                                          modern economy

                                                                                                        • making Indigenous communities safer
The Prime Minister is Welcomed to Country as part of his visit to the Buku-Larrnggay Mulka Art Centre     for people to live, work and raise their
in Yirrkala, Northern Territory. AAP image/Tracey Nearmy.                                                 families.

2    Closing the Gap Report 2015
Any work in these priority areas must be
underpinned by improving the health
and wellbeing of individuals, families and
communities. That is why the Government is
developing an Implementation Plan for the
National Aboriginal and Torres Strait Islander
Health Plan 2013‑23.

The past year was one of developing
practical reforms so we have a solid platform
from which to deliver improvements. To
this end, the Government has received
advice from the Prime Minister’s Indigenous
Advisory Council, chaired by Mr Warren
Mundine, on practical ways to improve
educational outcomes and school
attendance, employment and economic
development, and community safety.

The Prime Minister, along with senior
ministers and government officials, spent
almost a week in September 2014 running
the Government from North East Arnhem
Land. This visit was at the invitation of the
highly respected Aboriginal and ceremonial       Recognise staff and volunteers on the Queensland leg of the Journey to Recognition.
leader of the Gumatj clan, Mr Galarrwuy
Yunupingu AM. The visit provided a
valuable opportunity for the Government to
experience first‑hand the challenges facing
Aboriginal and Torres Strait Islander peoples
living in remote communities while focusing
the nation’s attention on important issues
affecting Indigenous Australians.

This work has provided the foundation for
the year ahead. This year will be one focused
on action that will over time accelerate
progress against the Closing the Gap targets,
including the new target of closing the
school attendance gap within five years.

                                                                                                                    Closing the Gap Report 2015   3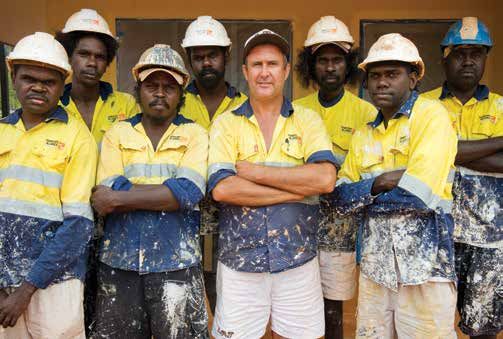
Remote School Attendance Officers from Borroloola, Northern Territory with Bush TV film crew.

4    Closing the Gap Report 2015
Closing the Gap targets

Progress against the targets
Key findings:

Target                                                      Target year   Progress       Results
Close the gap in life expectancy within a generation        2031          Not on track   Limited progress.

Halve the gap in mortality rates for Indigenous children    2018          On track       Long term progress.
under five within a decade

Ensure access for all Indigenous four-year-olds in remote   2013          Not met        In 2013, 85 per cent of Indigenous
communities to early childhood education                                                 four-year-olds were enrolled compared
                                                                                         to the target of 95 per cent.

Close the gap between Indigenous and non-Indigenous         2018                         New target, baseline 2014.
school attendance within five years

Halve the gap in reading, writing and numeracy              2018          Not on track   There has been no overall
achievements for Indigenous students                                                     improvement in Indigenous reading
                                                                                         and numeracy since 2008.

Halve the gap for Indigenous Australians aged 20-24 in      2020          On track       The gap is narrowing in Year 12 or
Year 12 attainment or equivalent attainment rates                                        equivalent attainment.

Halve the gap in employment outcomes between                2018          Not on track   There was a decline in employment
Indigenous and non-Indigenous Australians                                                outcomes since the 2008 baseline.

                                                                                                     Closing the Gap Report 2015   5
Target
                                                                                                     Close the life expectancy
                                                                                                     gap within a generation (by
                                                                                                     2031) ‑ Limited progress
                                                                                                    From 1998 to 2013, overall Indigenous death
                                                                                                    rates have declined significantly (by
                                                                                                    16 per cent) and there has been a significant
                                                                                                    decline in the gap (by 15 per cent). However,
                                                                                Target              no significant change was detected between
                                                                                Close the life expectancy
                                                                                                    the 2006gap
                                                                                                              baseline and 2013, and rates are
                                                                                                    not on track to meet the target.

Edna Skeen and Julie Johnson at the young mums and bubs group, Halls Creek, Western Australia.

6    Closing the Gap Report 2015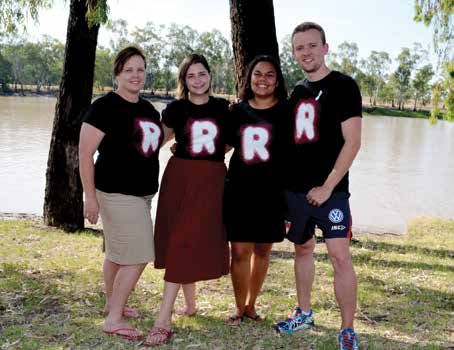
Figure 1 shows that the current rate of                                        Life expectancy estimates for Aboriginal          From 1998 to 2012, Indigenous death
 progress will have to gather considerable                                      and Torres Strait Islander peoples are            rates from chronic disease have declined
 pace if the target is to be met by 2031.                                       only published every five years. Updated          significantly (by 19 per cent) and there has
                                                                                estimates are expected to be published by         been a significant decline in the gap (by
 The most recent life expectancy figures were                                   the Australian Bureau of Statistics in 2018. In   14 per cent). However, since 2006 the gap
 published in late 2013 and featured in last                                    the interim, overall death rates are used to      widened for cancer mortality and there
 year’s report. In 2010–12, Indigenous life                                     assess progress in closing the gap.               has been no improvement for diabetes or
 expectancy was estimated to be 69.1 years                                                                                        external causes of death such as suicide and
 for males and 73.7 years for females. The gap                                  Between 2008 and 2012, chronic disease            transport accidents.
 in life expectancy between Indigenous and                                      (including circulatory disease, cancer,
 non-Indigenous Australians was 10.6 years                                      diabetes, kidney and respiratory diseases)        Improvements in life expectancy will be
 for males and 9.5 years for females. Between                                   accounted for 70 per cent of Indigenous           supported by real progress in education,
 2005-07 and 2010-12, there has been a small                                    deaths. Chronic disease also accounted            employment, housing, income, safety and
 reduction in the gap of 0.8 years for males                                    for 81 per cent of the gap in death rates         preventing health risk behaviours.
 and 0.1 years for females.                                                     between Indigenous and non-Indigenous
                                                                                Australians.

  Figure 1:
  Overall mortality rates by Indigenous status: NSW, QLD, WA, SA and the NT combined
  1998‑2031.

                     1,400

                     1,200
Deaths per 100,000

                     1,000

                      800

                      600

                      400

                      200

                        0
                        19 8
                        20 9
                        20 0
                        20 1
                        20 2
                        20 3
                        20 4
                        20 5
                        20 6
                        20 7
                        20 8
                        20 9
                        20 0
                        20 1
                        20 2
                        20 3
                        20 4
                        20 5
                        20 6
                        20 7
                        20 8
                        20 9
                        20 2
                        20 0
                        20 3
                        20 1
                        20 4
                        20 5
                        20 6
                        20 7
                        20 8
                        20 9
                        20 0
                        20 1
                        20 2
                           33
                           9
                           9
                           0
                           0
                           0
                           0
                           0
                           0
                           0
                           0
                           0
                           0
                           1
                           1
                           1
                           1
                           1
                           1
                           1
                           1
                           1
                           1
                           2
                           2
                           2
                           2
                           2
                           2
                           2
                           2
                           2
                           2
                           3
                           3
                           3
                        19

                             Year

                      Indigenous rate                            Non-Indigenous rate                Target Indigenous rate
                      Projected non-Indigenous rate              Indigenous variability bands       Target
                      Indigenous data-points

                      Source: ABS and AIHW analysis of National Mortality Database

                                                                                                                                                 Closing the Gap Report 2015   7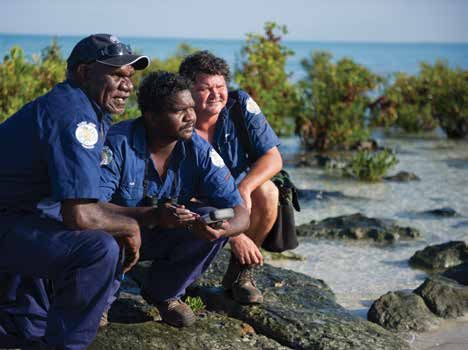
Target
                                                                                                    Halving the gap in mortality
                                                                                                    rates for Indigenous children
                                                                                                    under five within a decade
                                                                                                    (by 2018) ‑ Long term
                                                                                                    progress
                                                                                                  The Indigenous child death rate declined
                                                                                    Target        by 31 per cent, outpacing the decline in
                                                                                    Child mortality rates
                                                                                                  non‑Indigenous   child deaths between
                                                                                                  1998 and 2013. This has led to a significant
                                                                                                  (35 per cent) narrowing of the gap in child
                                                                                                  death rates between Indigenous and
                                                                                                  non‑Indigenous children over this period.

Ronita Bradshaw and Le’Zakquarrn Edgar, mothers and babies group, Ardyaloon Community,
Dampier Peninsular, Western Australia.

8    Closing the Gap Report 2015
The latest Indigenous child mortality rate Figure 2: Child mortality rates by Indigenous status, NSW, QLD, WA, SA and the NT
for 2013 is above the trajectory point for combined, 1998‑2018
the target (see Figure 2). An unusually large
500
number of Indigenous young infant deaths
that occurred in 2012 were registered in 450
2013.1 This means that Indigenous mortality 400
Deaths per 100,000
rates based on registered deaths are likely 350
to be understated in 2012 and overstated in
300
2013. When you average the rates for 2012
and 2013 the resulting number is within the 250
required trajectory. The sharp increase in 200
2013 is also affected by the volatility in small 150
numbers. The previous trends show large
100
variation year to year. We should not read
too much into a result for one year and it is 50
worth noting that the target has been on 0
track every year except 2013.
98
99
00
01
02
03
04
05
06
07
08
09
10
11
12
13
14
15
16
17
18
19
19
20
20
20
20
20
20
20
20
20
20
20
20
20
20
20
20
20
20
20
While the decline in Indigenous child deaths Year
has slowed in 2013, the target remains
Indigenous rate Non-Indigenous rate Target Indigenous rate
achievable by 2018.
Projected non-Indigenous rate Indigenous variability bands Target
Maintaining a positive trend towards lower Indigenous data-points
child mortality requires a continued focus
on preventative care and child and maternal Source: ABS and AIHW analysis of National Mortality Database
health services. It also means addressing
broader factors such as socio‑economic
status, education, smoking during
pregnancy, infant breastfeeding, adequate
diet and exercise.
1
To allow for timely reporting, this target is monitored
using the year a death is registered rather than the year
it occurred (as it takes a few years for all deaths to be
registered). Counting deaths registered each year is a
reasonable proxy for monitoring annual death rates as the
proportion of deaths that occurred in the current year and
were registered in the current year versus the next year are
usually fairly stable.
Closing the Gap Report 2015 9Target
Ensuring all Indigenous
four‑year‑olds in remote
communities have access to
early childhood education
within five years (by 2013) ‑
Not met
The target was not met. To reach this
target, a 95 per cent enrolment for
Indigenous four‑year‑old children in remote
communities by 2013 had to be achieved.
The target was 95 per cent, rather than
100 per cent enrolment, as early childhood
education is not compulsory. Target
Early childhood education
In 2013, 85 per cent of Indigenous Winema Wilson and Amarah Bidingala, Families as First Teachers group, Galiwin’ku Community,
four‑year‑olds in remote communities Northern Territory.
were enrolled compared to the required
benchmark of 95 per cent.2 Assessments) than Indigenous students who
had not attended preschool at all (Bortoli
Quality early childhood education is critical and Thomson 2010).
to ensure young children have opportunities
for early childhood development and The Australian Government has extended
preparation for their later schooling. Early the National Partnership Agreement
childhood is a time of growth in physical on Universal Access to Early Childhood
health and wellbeing, language and Education to 2015. All jurisdictions have
cognitive skills, social skills and general committed to achieving 95 per cent of
knowledge. Aboriginal and Torres Strait Islander children
enrolled in the year before school in quality
Nurturing early environments at home, early childhood education during the
in the community and through early extension period. Data for 2014 are not yet
childhood education provide opportunities available.
for children to develop and thrive and
make good transitions to school and work.
Indigenous students who had attended 2
The last Closing the Gap report included a result of 88
per cent enrolment for 2012. However, the 2012 figure
preschool for more than one year scored, was based on ABS population projections from the 2006
on average, 69 points higher academically census. The apparent decline from 2012 to 2013 reflects
a higher estimate of the Indigenous population for this
(in the Programme for International Student target based on 2011 census data.
10 Closing the Gap Report 2015Target
Close the gap between
Indigenous and
non‑Indigenous school
attendance within five years
(by 2018) ‑ New target
In May 2014, COAG agreed to a new target
to close the gap between Indigenous and
non‑Indigenous school attendance within
five years (by 2018).
There is a strong link between school
attendance and student performance. The
report Student Attendance and Educational
Outcomes: Every Day Counts found that in
all analyses average academic achievement
on the National Assessment Program –
Target
Literacy and Numeracy (NAPLAN) tests
School attendance
declined with any absence from school,
and continued to decline as absence rates Amy Coyne, North Albany Senior High School, Western Australia.
increased. The report also showed that for
more disadvantaged students, achievement
declines rapidly with increasing levels of
absence (Hancock et al. 2013).
Closing the Gap Report 2015 11Dr Nicholas Biddle, Fellow at the Centre What does the currently Figure 3: Year 5 and 10 government
for Aboriginal Economic Policy Research at school attendance, states and territories,
available data show? 2013
the Australian National University, recently
undertook an analysis of the gap in school The gap in school attendance rates
performance between Indigenous and between Indigenous and non-Indigenous Year 5 Attendance
non-Indigenous 15-year-olds. Dr Biddle students widens as children age and tends 100
concluded that all things being equal, to be significantly greater in remote and
90
approximately 20 per cent of the gap in very remote areas. In 2013, Indigenous
80
performance between Indigenous and attendance rates in government schools
were lower than non-Indigenous rates for 70
non-Indigenous 15-year-olds is explained
by relatively poor school attendance each jurisdiction and all grades from Year 1 60
among Indigenous students (Biddle 2014). to Year 10.4 50
There is no doubt that school attendance 40
The Northern Territory had the largest
has a strong impact on school results for 30
attendance gaps, ranging from
Indigenous students. This in turn affects 20
21-22 percentage points in the primary
educational attainment and employment
school years (Years 1-6), to 31 percentage 10
prospects.
points in Year 10. 0%
In December 2013, COAG agreed to NSW VIC QLD WA SA TAS ACT NT
Little progress has been made in recent
increase the level of transparency around
years. The Overcoming Indigenous Indigenous Non-Indigenous
school attendance. It was decided to Year 10 Attendance
Disadvantage Report for 2014 shows stable
publish attendance data twice per year by
Year 5 attendance rates for Indigenous 100
schools for all students, split by Indigeneity
students and declines in Year 10 attendance 90
(subject to privacy thresholds).3 Previously,
rates from 2007 to 2013 for government
attendance figures for schools were only 80
schools (SCRGSP 2014). No clear trend was
published without a split by Indigeneity 70
evident for Independent or Catholic schools.
once a year on the My School website. 60
The COAG Reform Council also concluded
COAG also agreed to the publication of
that there had been no overall improvement 50
the proportion of Indigenous and
in Aboriginal and Torres Strait Islander 40
non-Indigenous students attending school
students school attendance rates from 2008 30
more than 90 per cent of the time for each
to 2012 (CRC 2013). 20
school from 2015.
10
0%
NSW VIC QLD WA SA TAS ACT NT
Indigenous Non-Indigenous
3
Data for Semester 1 was released in December 2014 and from 2015 data will be published twice yearly for Semester 1 and
Term 3. Source: Australian Curriculum, Assessment and Reporting
Authority as reported by SCRGSP (2014)
4
In 2013 different definitions and methodologies were used by jurisdictions to collect attendance data. From the 2014 school
year onwards, nationally comparable student attendance data will be collected, as set out in the National Standards for
Student Attendance Data Reporting (including NSW government schools from 2015) (from Australian Curriculum Assessment
and Reporting Authority, http://www.acara.edu.au/reporting/reporting.html).
12 Closing the Gap Report 2015New data released in December 2014 show Figure 4: Proportion of schools with an
that the Indigenous attendance rate was attendance rate of at least 90 per cent,
already 90 per cent or above in 2,046 Indigenous and non‑Indigenous students,
(44 per cent) of the 4,605 schools for by geolocation, 2014
which an Indigenous attendance rate
100
was published.5 The proportion of schools
90
achieving the 90 per cent benchmark for
80
Indigenous attendance in 2014 varies sharply
by remoteness: 48 per cent of schools in 70
metropolitan areas, 44 per cent in provincial; 60
21 per cent in remote and only 14 per cent 50
in very remote areas.6 There is also variation 40
between states and territories; ranging from 30
Tasmania where 62 per cent of schools have 20
at least 90 per cent Indigenous attendance,
10
to the Northern Territory where only
0%
10 per cent of schools met the benchmark. Metro Provincial Remote Very Australia
remote
Future Closing the Gap reports will assess
progress against the target to close the Indigenous Non-Indigenous
school attendance gap (2014 is the baseline
Source: Australian Curriculum, Assessment and Reporting
year for the new target). Authority
5
For privacy reasons, attendance rates were not published by Indigeneity where there were less than six Indigenous or
non-Indigenous students at the school.
6
These figures relate to school level data and so do not take into account regional variations in the size of schools and the
number of Indigenous enrolments per school.
Closing the Gap Report 2015 13Target The gap for this target is measured as the
difference between the proportion of
Figure 5: Indigenous students reaching
National Minimum Standards (NMS) for
Halve the gap for Indigenous Indigenous and non‑Indigenous students at Year 7 reading by remoteness 2008 to
or above the National Minimum Standards in 2014
children in reading, writing reading and numeracy at Years 3, 5, 7 and 9.
and numeracy within a Writing results from 2011 onwards cannot be
100
90
decade (by 2018) ‑ No overall directly compared to the writing results from
80
previous years, and so have been excluded.7
progress 70
In 2014, results in two of the eight areas 60
There has been no improvement in this (Year 7 reading and Year 9 numeracy) were
50
target using the outcomes of the annual consistent with the required trajectory
40
NAPLAN tests. points at the national level. In the other six
areas, 2014 results were below the required 30
Between 2008 and 2014, the proportion of trajectory points, which means that progress 20
Aboriginal and Torres Strait Islander students will need to accelerate for this target to be 10
at or above the National Minimum Standards met. 0%
in reading and numeracy has shown Metro Provincial Remote Very Australia
no statistically significant improvement NAPLAN results for Indigenous students vary remote
nationally in any of the eight measures (Years sharply by remoteness area. For example, 2008 2014
3, 5, 7 and 9 in reading and numeracy). in 2014, 85.7 per cent of all Indigenous
In Year 5 reading a large apparent rise students in metropolitan areas met or Source: Australian Curriculum, Assessment and
Reporting Authority
occurred in the proportion of Indigenous exceeded the National Minimum Standards
students meeting national minimum for Year 7 reading compared to only 34.9 per
standards from 2012 to 2013 (from 64.7 to cent of Indigenous students in very remote
83.3 per cent). However this proportion fell areas. As results for non‑Indigenous students
back to 70.3 per cent in 2014. show less variation by remoteness area, the
gap is much wider in very remote areas than
it is in metropolitan areas.
7
Prior to 2011, measurement of this target also used the NAPLAN writing test. In 2011, the writing test for all year levels was
altered from an assessment of Narrative writing to Persuasive writing. This change in the writing test has created a break in the
data series over time.
14 Closing the Gap Report 2015Results also vary by state and territory. The On the other hand significant declines were
Northern Territory has the lowest proportion found for Indigenous students over this
of Indigenous students achieving National period in four of the 64 results:
Minimum Standards across each Year
level (for reading and numeracy). Figure 6 • Australian Capital Territory in Year 7
illustrates this using Year 7 reading results. reading (from 94 per cent in 2008 to 83
per cent in 2014)
Since 2008 there has been limited progress
at the state and territory level. Between 2008 • New South Wales in Year 3 numeracy
and 2014, the proportion of Indigenous (from 89 per cent to 85 per cent)
students at or above the National • Victoria in Year 3 numeracy (from
Minimum Standards has shown significant 93 per cent to 89 per cent)
improvement in six of the possible 64 results
(numeracy and reading across four Year • Tasmania in Year 9 reading (from
levels in eight jurisdictions) including in: 91 per cent to 83 per cent).
• Q
ueensland in Year 3 reading (from 66 The Northern Territory had no significant
per cent in 2008 to 80 per cent in 2014), changes in any of these results for
Year 5 reading (from 63 per cent to 75 per Indigenous students. Sarah Firebrace and Amber Foster doing their
cent) and Year 3 numeracy (from 76 per homework, Haywood, Victoria.
cent to 82 per cent)
• Western Australia in Year 7 reading (from
63 per cent to 72 per cent) and Year 9 Figure 6: Indigenous students reaching National Minimum Standards (NMS) for
numeracy (from 66 per cent to Year 7 reading by state and territory, 2008 to 2014
74 per cent)
100
• South Australia in Year 7 reading (from 90
70 per cent to 80 per cent).
80
70
60
50
40
30
20
10
0%
NSW VIC QLD WA SA TAS ACT NT Aust
2008 2014
Source: Australian Curriculum, Assessment and Reporting Authority
Closing the Gap Report 2015 15After returning to school as mature-aged students, Tiwi women Natasha Puautjimi and Edwina Portaminni gained employment as assistant teachers at Xavier Catholic College Wurrumiyanga, Northern Territory. 16 Closing the Gap Report 2015
Target
                                                                                              Year 12 attainment

Target
Halve the gap for Indigenous                     Figure 7: Proportion of Indigenous
                                                 20‑24‑year‑olds with Year 12 attainment
Australians aged 20‑24                           or equivalent, by remoteness, 2008 to
in Year 12 attainment or                         2012‑13
equivalent attainment rates                       80
(by 2020) ‑ On track                              70

This target is on track. Nationally, the          60
proportion of Indigenous 20‑24-year-olds          50
who had achieved Year 12 or equivalent
                                                  40
increased from 45.4 per cent in 2008 to
58.5 per cent in 2012‑13. Between 2008            30
and 2012‑13, the gap narrowed by 11.6
                                                  20
percentage points (from 39.6 percentage
points in 2008 to 28 percentage points in         10
2012‑13). For non‑Indigenous Australians,        0%
the proportion rose slightly (85.0 per cent in             Major     Inner    Outer    Remote          Very
2008 to 86.5 per cent in 2012).                            cities    regional regional                 remote

Results vary significantly by remoteness for                2008            2012-13

Indigenous young people, ranging from 65.5
                                                 Source: Indigenous data are from the Australian Aboriginal
per cent in outer regional areas to 36.8 per     and Torres Strait Islander Health Survey 2012-13 and the
cent in very remote areas.                       National Aboriginal and Torres Strait Islander Social Survey
                                                 2008. Non-Indigenous data are from the Survey of Education
                                                 and Work.

                                                                                                                   Closing the Gap Report 2015   17
Target
Halve the gap in
employment outcomes
between Indigenous and
non‑Indigenous Australians
within a decade (by 2018) ‑
No progress
It is clear that since 2008, no progress has
been made against the target to halve
the gap in employment outcomes within
a decade (by 2018). The proportion of
Aboriginal and Torres Strait Islander peoples
aged 15‑64 years who are employed fell
Target from 53.8 per cent in 2008 to 47.5 per cent in
Employment outcomes 2012‑13.8
In addition to the fall in Indigenous
employment, the proportion of
non‑Indigenous Australians who are
Indigenous Painting Team, Galiwin’ku Community, Northern Territory. employed rose from 75.0 per cent to
75.6 per cent. Consequently, between
2008 and 2012‑13 there has been an
increase of 6.9 percentage points in the
employment gap between Indigenous and
non‑Indigenous working age people (up
from 21.2 to 28.1 percentage points).
8
In June 2014, employment data from the Australian
Aboriginal and Torres Strait Islander Health Survey was
finalised. Preliminary figures for 2012‑13 published in last
year’s report show that the proportion fell to 47.8 per cent.
18 Closing the Gap Report 2015Some care is required in assessing progress Indigenous employment rates vary sharply
on this target. Participants in Community by remoteness area. Inner‑regional areas and
Development Employment Projects (CDEP) major cities have the highest Indigenous
have historically been classified in the ABS employment rates for those aged 15–64
statistics as being employed. However years at 49.9 per cent and 49.8 per cent
policy changes to cease non‑remote respectively. By comparison very remote
CDEP and introduce the Remote Jobs and areas have the lowest at 42.2 per cent. Only
Communities Programme in remote areas 30.4 per cent of Indigenous Australians
resulted in a large fall in the number of CDEP aged 15‑64 years in very remote areas were
participants during this period. The decline employed in a mainstream (non‑CDEP)
in CDEP participants from 2008 to 2012‑13 job in 2012‑13. The Indigenous non‑CDEP
accounted for 60 per cent of the decline in employment rate in the major cities fell
the Indigenous employment rate over this from 58.6 per cent in 2008 to 49.8 per cent
period.9 in 2012‑13 and this fall was statistically
significant.
Figure 8: Proportion of Indigenous Australians aged 15-64 years employed in
non-CDEP and CDEP jobs, by remoteness, 2008 to 2012-13
Kayla Baksh, Rumbalara Aboriginal Co-operative,
60 Mooroopna, Victoria.
50
40
30
20
10
0%
Major cities Inner regional Outer regional Remote Very remote Australia
2008 - CDEP 2012-13 - CDEP
2008 - Non-CDEP 2012-13 - Non-CDEP
Source: Indigenous data are from the Australian Aboriginal and Torres Strait Islander Health Survey 2012-13 and the National
Aboriginal and Torres Strait Islander Social Survey 2008. Non-Indigenous data are from the Survey of Education and Work.
9
The Indigenous mainstream (non‑CDEP) employment rate also fell from 48.2 per cent in 2008 to 45.6 per cent in 2012–13,
however, this fall was not statistically significant.
Closing the Gap Report 2015 19Focus on priorities
The Government is determined to
close the gap between Indigenous and
non‑Indigenous Australians.
The disadvantage suffered by Indigenous
Australians is unacceptable. We must
continue to work together and build on
previous efforts to close the gap.
Constitutional recognition is critical to fully
acknowledge the heritage of our nation.
Education, employment and safer
communities are key drivers in improving
outcomes for Aboriginal and Torres Strait
Islander peoples; and no improvement is
complete or sustainable without better
health and wellbeing.
The Prime Minister meeting with Mr Galarrwuy Yunupingu AM, ceremonial leader of the Gumatj clan.
20 Closing the Gap Report 2015Schooling ‑ Getting the most out of education
The education of Aboriginal and Torres
Strait Islander children is everybody’s
business. Parents, carers, communities
and governments must see themselves as
partners in this crucial initiative. Improving
education outcomes starts with good early
childhood development, effective parenting
and strategies to ensure kids are ready for
school.
Going to school and being at school every
day gives children the best start in life.
Making that happen for Aboriginal and
Torres Strait Islander children is one of the
Government’s top priorities.
A decent school education provides children
with the opportunities for higher education
and employment; with flow‑on benefits for
health, social and emotional wellbeing and
improved living standards.
We are committed to breaking the cycle of
non‑attendance and ensuring parents and
carers take responsibility for educating their
children. Joeisha Maher, Belinda Mallard and Hakeem Davey at One Arm Point Remote Community School,
Ardyaloon Community, Dampier Peninsular, Western Australia.
We know that 20 per cent of the gap in
school performance is attributed to poor
school attendance (Biddle 2014). In very
remote parts of the Northern Territory less
than a quarter of Indigenous students
(23 per cent) attend school 80 per cent or
more of the time (Office of the Children’s
Commissioner NT 2014).
Closing the Gap Report 2015 21The Government’s Remote School Improved schooling In addition, COAG is looking at ways to get
Attendance Strategy (RSAS) engages schools, more highly accomplished principals and
families and community organisations to To improve educational outcomes for teachers into regional and remote schools.
ensure children go to school every day. Aboriginal and Torres Strait Islander children,
they need to attend school and be engaged To give them the best chance to learn,
In Term 3, 2014, there was a 13 per cent rise in their own learning. children also need to be healthy, safe, rested
in the number of children attending school and well‑nourished. Health services need to
across 29 Northern Territory Government Indigenous students are estimated to be be actively involved in working with families
RSAS schools and an 8 per cent rise in the behind non‑Indigenous students by the and schools to help children be school and
number of children attending the equivalent of about two‑and‑half‑years learning ready.
11 Queensland Government RSAS schools, of schooling in the tested area of literacy
compared with Term 3, 2013. (Thomson et al. 2013). Without adequate Vision impairment and hearing loss can
literacy and numeracy skills, Aboriginal and affect children’s ability to learn, leading to
While there was variation in performance Torres Strait Islander children and young delayed educational development, and can
and some schools did not show much people will find it harder to take advantage also prevent people from participating in
improvement, some schools experienced of opportunities that present themselves education and work. The Government is
particularly large increases in the attendance later in life. working with states and territories in the
rate over this period. For example fight against trachoma and we have made
Numbulwar School (17 percentage points The Government is investing in activities that real progress. The trachoma prevalence rate
increase), Ngukurr School (15 percentage help kids get the most from schooling and in children aged 5‑9 years was 14 per cent
points increase), Camooweal State School education, such as: in 2009 and 4 per cent in 2013 in selected
(16 percentage points increase) and • the Flexible Literacy for Remote Primary at‑risk communities. Australia is on track to
Pormpuraaw State School (10 percentage Schools Programme, which promotes the eliminate trachoma by 2020.
points increase). Ten Northern Territory use of successful teaching approaches
schools saw attendance rise by five The Healthy Ears ‑ Better Hearing, Better
to almost 40 primary schools in remote Listening Programme is improving access to
percentage points or more over this period.10 locations, with an emphasis on direct or health professionals to prevent and treat ear
All Australian governments through COAG explicit instruction disease. In 2013‑14, around 7,500 children
have agreed to further actions to improve • 3,000 Clontarf student academy accessed services in 89 locations across the
school attendance for Aboriginal and placements that will improve school nation.
Torres Strait Islander students, and work on engagement, education, life skills and
school‑level strategies is progressing. employment prospects.
10
No schools in the Northern Territory had a decline in student attendance of more than 5 percentage points over this period.
22 Closing the Gap Report 2015Education to employment Good progress is being made in higher
education. Over the decade to 2013,
Increasing Aboriginal and Torres Strait Indigenous enrolments at higher education
Islander peoples’ participation in further institutions have increased by 53 per cent
training and education resulting in to 13,723 (Department of Education and
employment is critical to Indigenous Training 2014). In 2011, Indigenous females
economic development. Because we know aged 20‑64 years were twice as likely as
the value of mentoring, we also need Indigenous males to have a Bachelor
to increase the number of Indigenous qualification or above (SCRGSP 2014).
professionals and tradespeople who will
be role models for the next generation of All universities have targets in place for
Aboriginal and Torres Strait Islander students. increasing Indigenous staff and student
numbers. But there is still much to be done.
The Government is funding pilot It is important that universities are engaged
programmes which provide practical at the highest level to improve higher
support to young people, including young education outcomes for Aboriginal and
Indigenous Australians, in regional areas and Torres Strait Islander peoples.
areas where youth unemployment is high.
These include $38 million for the Training
for Employment Scholarships pilot which
will provide 7,500 scholarships in 2015 to
assist employers to provide job‑specific
training for new employees; and the new
Youth Employment Pathways pilot. In 2015,
the Youth Employment Pathways pilot will Charlie Perkins Scholars Vincent Backhaus (2013)
offer 3,000 young Australians assistance and Lilly Brown (2012) at Lilly’s graduation from
the University of Cambridge. Both had previously
to start on the path to their chosen career been Scholars on the Aurora Indigenous Scholars
by returning to school, starting vocational International Study Tour.
education and training or moving into the
workforce.
Closing the Gap Report 2015 23Focus on jobs ‑ Adults into work
Getting more adults into work will mean
a better future for Aboriginal and Torres
Strait Islander peoples. Participation in
employment increases wellbeing and
living standards for individuals, families and
communities. Jobs give people financial
independence, control over their lives
and the ability to provide for their families’
futures.
That is why the Government commissioned
Mr Andrew Forrest to review Indigenous
training and employment programmes. In
his report, Creating Parity ‑ the Forrest Review,
he recommended a range of new ways to
significantly boost Indigenous employment.
A good education, and vocational training
that relates to real jobs, are key to improving
employment outcomes for Aboriginal and
Torres Strait Islander peoples. Helping adults
Participants from the Yarn’n VTEC Trainee Assistants in Nursing programme, run through the Sydney
Vocational Training and Employment Centre. and young people to move successfully
from school, higher education and training,
into stable and meaningful work has been
the focus of the Government’s reforms in
employment.
Under the Indigenous Advancement
Strategy Jobs, Land and Economy
programme, there were 8,271 Indigenous
job seeker commencements into
employment in the six months from
July to December 2014. In the 2013‑14
financial year, under the Commonwealth’s
previous Indigenous‑focused employment
programmes, there were 14,538 Indigenous
job seeker commencements into
employment and 10,721 commencements
into education and training.
24 Closing the Gap Report 2015We also want to end sit‑down welfare The Government will continue to work with
in remote Australia. There will no longer state and territory governments to further
be training for training’s sake; that’s why improve the vocational, workplace and
we have reformed the Remote Jobs and entrepreneurial skills of Aboriginal and Torres
Communities Programme (RJCP). This Strait Islander peoples.
includes:
The Government has committed up to
• the introduction of Work for the Dole in $45 million for Indigenous‑specific
remote areas, five days per week, Vocational Training and Employment
12 months per year Centres (VTECs), which will train up to
5,000 Indigenous Australians for specific
• the establishment of new businesses. jobs. As at January 2015, 28 VTECS have been
As part of these reforms, the Government established and providers contracted to
will also invest $25 million annually so that deliver up to 5,470 jobs.
local enterprises can be created. These new Christopher Palmer, Kelvin Kopp, Stefan Smith,
The Government is introducing a new Desmond Young, Jason McMillian, Leon Davis,
intermediate labour markets will provide employment services system across Australia Keith Gorey and Ashley Smith, Community
work experience and jobs in remote Development Employment Project firefighting
from 1 July 2015 to promote stronger programme, Santa Teresa, Northern Territory.
communities. workforce participation by all Australians and
To ensure we get this right, we will help more job seekers move from welfare to
discuss the reformed programme on a work.
community‑by‑community basis right up to We also recognise the strong connection
and beyond its introduction in June 2015. between health and workforce participation,
This is to ensure Work for the Dole activities as poor health and disability, including
meet the needs of individual communities. unmanaged chronic disease and mental
Work for the Dole is not the end point. health issues, can be a barrier to work and
We must also provide pathways to real employment.
employment if we are to halve the gap in
employment outcomes between Indigenous
and non‑Indigenous Australians by 2018.
More Aboriginal and Torres Strait Islander
peoples must gain and retain employment,
and more young people need to make a
successful transition from school to work.
Closing the Gap Report 2015 25Strengthening business opportunities
and communities
The Government will continue to work with
individuals, communities and businesses
to build stronger Indigenous organisations
and find practical ways to foster economic
prosperity at the individual, family and
community level.
All Australians should have the opportunity
to own their own home and run their own
business. Increased access to safe, fair and
affordable loans and financial services can
enable individuals to accumulate assets and
increase their economic mobility.
Greater flexibility in how Aboriginal and
Torres Strait Islander peoples choose to use
the land they own and live on, can help
to create stronger and more independent
futures for people living in communities on
Indigenous land.
The Government continues to support
Indigenous businesses, including through
Indigenous Business Australia (IBA) which
provides new and existing Indigenous
Bardi Jawi Rangers Christopher Sampi, Kevin Dougal and Mark Shadforth at Ardyaloon Community,
business owners access to expert advice Dampier Peninsular, Western Australia.
and business finance. IBA is also increasing
its focus on helping Indigenous landowners
to build wealth and maximise economic
outcomes from their land and native title
rights. This includes new investment options
for Indigenous groups and developing
Indigenous investment principles that meet
international best practice.
26 Closing the Gap Report 2015Safe communities
The third priority area of focus alongside
education and employment is making
communities safer.
All Australians have the right to live in safe
communities where they can raise healthy
families, participate in education and
employment and contribute to society.
It is important that Aboriginal and Torres
Strait Islander peoples enjoy similar levels of
physical, emotional and social wellbeing as
that enjoyed by other Australians.
Aboriginal and Torres Strait Islander peoples
are more likely to experience violence, child
abuse and neglect. Evidence shows that key
drivers of violence are alcohol and drugs,
inadequate education and unemployment.
The National Plan to Reduce Violence against
Women and their Children 2010‑2022 (the
National Plan) recognises that Aboriginal
and Torres Strait Islander women experience
much higher levels of violence than
non‑Indigenous women. In 2012‑13,
Jacqueline Brennan and Savannah Turner, Kalano Community Night Patrol, Katherine, Northern Territory.
Indigenous women were 34.2 times more
likely than non‑Indigenous women to be
hospitalised for family violence‑related Responsibility for ensuring community safety
assault (SCRGSP 2014). primarily rests with the states and territories,
and the Commonwealth is committed to
The National Plan’s Second Action Plan working with them and holding them to
was agreed by Commonwealth, state and account in making Indigenous communities
territory governments and launched by the safer for people to live, work and raise their
Prime Minister in June 2014. The Second families.
Action Plan will help Aboriginal and Torres
Strait Islander women and their children
by increasing engagement, strengthening
primary prevention, expanding social
marketing campaigns to reach young
people, and funding research.
Closing the Gap Report 2015 27There are a number of ways we are working
with states and territories to build safer
communities, including supporting the
policing of remote communities and
reducing reoffending.
The rate of Indigenous imprisonment is
higher than at any time in the past decade.
The Government is funding projects that
support the rehabilitation of prisoners and
reduce the likelihood of future offending.
In 2013‑14, the Commonwealth funded
nine projects that supported more than
800 prisoners, including more than 320
people released from prison. Fewer than 80
reoffended and returned to prison.
The Government is also committed to
reducing harm from alcohol and substance
abuse, which is also a significant driver of
offending, and to support local communities Leitisha Jackson, Sandra Allwright, David Watego and Robert Palmer at the Wurli-Wurlinjang Health
Service in Katherine, Northern Territory.
working with state and territory
governments to identify solutions that lead
to real outcomes. The Government is helping to reduce petrol
sniffing in areas where it is a problem by
The Government is providing additional replacing regular unleaded fuel with low
investment to combat the harm caused aromatic unleaded fuel. In 2014, a new bulk
by alcohol abuse in the Northern Territory, storage facility for low aromatic unleaded
as well as $68 million this year nationally fuel was established in Darwin to support
to continue residential rehabilitation, the expanded rollout of the fuel to northern
counselling, referral, transitional aftercare Australia.
and sobering up shelters. A key priority for
Government is raising awareness of the Safe communities are part of a positive cycle.
harm associated with consuming alcohol They offer security and empowerment,
while pregnant. The Commonwealth has encourage wellbeing and resilience and
made significant investments to reduce the instil a sense of individual and community
impact of Foetal Alcohol Spectrum Disorder pride. That leads to better mental health
on affected individuals and families, and outcomes, decreased alcohol and other drug
support clinicians to better diagnose the use, and diminished violence. This makes
condition. communities safer, which is fundamental
to ensuring those who live and work there
enjoy success in education and employment.
28 Closing the Gap Report 2015Importance of health and wellbeing
It is important that we continue to focus
on improving health outcomes, reducing
harm from risky behaviours and supporting
families and communities to manage their
health. Good health is a major contributor
to improvements in education, employment
and community safety.
Indigenous Australians continue to
experience poorer health outcomes
at higher rates and younger ages than
non‑Indigenous Australians. Aboriginal and
Torres Strait Islander peoples experience
higher rates of disability, chronic disease,
alcohol and other drug use, mental health
conditions and suicide.
The Government is committed to delivering
effective and efficient health services
for Aboriginal and Torres Strait Islander
peoples, through community controlled
health services and health services for all
Australians.
On 1 July 2014, the Government established
the Indigenous Australians’ Health
Programme. This consolidated four existing
funding streams to provide greater flexibility
Dion Pareroultja, Nathaniel Coulthard and Aaron Sharpe at the Hermannsburg Sports Day in Ntalia
to focus on local health needs, ensuring the Community, Northern Territory.
money gets to where it is needed most. This
programme and the National Aboriginal
and Torres Strait Islander Health Plan
complement the Indigenous Advancement
Strategy. Together they recognise the
importance of Aboriginal and Torres Strait
Islander culture as a resource and foundation
for health and wellbeing.
Closing the Gap Report 2015 29Recognising we still have a way to go, the Connection to land, culture, spirituality,
Australian Government has made significant ancestry, family and community are all
investments in the areas of child and important to the social and emotional
maternal health services and chronic disease wellbeing of Aboriginal and Torres Strait
prevention and management. This includes Islander peoples. Poor social and emotional
the expansion of key activities under Better wellbeing reduces the likelihood of
Start to Life to improve access to child people going to school, getting jobs or
and maternal health services and provide accessing health services. It also increases
targeted support to Aboriginal and Torres the likelihood of having alcohol and other
Strait Islander families in areas of identified substance abuse problems.
need.
In 2014‑15, the Government is providing
Real progress is being made in some areas $39.5 million to support counselling, family
like circulatory disease, the most common tracing and reunion support for Aboriginal
cause of death for Aboriginal and Torres and Torres Strait Islander peoples, including
Strait Islander peoples, with mortality members of the Stolen Generations and
rates declining by 40 per cent since 1998. their families.
Tobacco Action Worker Jethro Calma-Holt, Smoking rates among Aboriginal and Torres
Wodonga, Victoria. Strait Islander peoples have declined 7 Continued investment in health,
percentage points since 2002, and we are mental health and social and emotional
continuing our efforts to reduce the rate wellbeing will contribute to education
further. and employment outcomes, and safer
communities for Aboriginal and Torres Strait
Positive measures such as the Islander peoples.
Commonwealth Community Stores
Licensing Scheme, which has licensed
around 100 community stores across the
Northern Territory, also support good health
and nutrition for children and families by
ensuring access to high quality, affordable
and safe food, drinks and grocery items in
remote communities.
30 Closing the Gap Report 2015Constitutional recognition
Michael O’Loughlin and Recognise This ambassadors at the National Centre of Indigenous
Excellence, Sydney, New South Wales.
Recognising Indigenous Australians in our The Government is acting on the The Government will continue the national
Constitution will acknowledge our shared recommendations of the Review Panel and conversation about the importance of
history and the value we place on Australia’s is working with the states and territories constitutional recognition and what form
Aboriginal and Torres Strait Islander heritage. to encourage their formal declaration of it should take. All proposals will need to be
The commitment to hold a referendum support for constitutional recognition. We well communicated to, and understood by,
to recognise Indigenous Australians in are also providing additional funding for the Australian people so that the one we
the Constitution is bipartisan and broadly public awareness activities to encourage choose to put forward to a referendum has
supported by the states and territories. all Australians to be part of the national the best chance of succeeding.
conversation on constitutional recognition.
It would be richly symbolic if the referendum
could be held on 27 May 2017, the Parliament has established the Joint Select
50th anniversary of the 1967 referendum. Committee on Constitutional Recognition of
Aboriginal and Torres Strait Islander Peoples
In 2014, the Government established the to build a strong multi‑partisan consensus
Act of Recognition Review Panel under the on particular referendum proposals and, it is
Aboriginal and Torres Strait Islander Peoples our hope, ensure a successful referendum.
Recognition Act 2013 to assess Australia’s The Joint Select Committee held public
readiness for a referendum on Indigenous consultations around Australia throughout
constitutional recognition. The Review 2014, and will deliver its final report to
Panel’s final report was tabled in Parliament Parliament by 30 June 2015.
on 19 September 2014.
Closing the Gap Report 2015 31References
Biddle, N 2014, Developing a Behavioural SCRGSP (Steering Committee for the Review
Model of School Attendance: Policy of Government Service Provision) 2014,
implications for Indigenous children and youth, Overcoming Indigenous Disadvantage: Key
Working Paper No. 94, Centre for Aboriginal indicators 2014, Canberra.
Economic Policy Research, Australian
National University, Canberra. Thomson S, De Bortoli L, Buckley S 2013,
Programme for International Student
Bortoli, LJ & Thomson, S 2010, Contextual Assessment (PISA) 2012: How Australia
Factors that Influence the Achievement measures up, Australian Council for
of Australia’s Indigenous Students: Results Educational Research, Victoria.
from Programme for International Student
Assessment (PISA) 2000‑2006, Australian
Council for Education Research cited in
SCRGSP 2011, Overcoming Indigenous
Disadvantage: Key Indicators 2011, Canberra.
CRC (Council of Australian Governments’
Reform Council) 2013, Education in Australia
2012: five years of performance, Sydney.
Department of Education and Training 2014,
2013 Appendix 2 – Equity Groups: Higher
education equity groups tables for the 2013
full year, available at: http://docs.education.
gov.au/documents/2013-appendix-2-equity-
groups
Hancock, KJ, Shepherd, CCJ, Lawrence, D,
& Zubrick, SR 2013, Student Attendance and
Educational Outcomes: Every Day Counts.
Report for the Department of Education,
Employment and Workplace Relations,
Canberra.
Office of the Children’s Commissioner NT
2014 unpublished data from the Northern
Territory Department of Education.
32 Closing the Gap Report 2015About the artwork This artwork design was created to symbolise the Government’s commitment to creating a better future for Indigenous Australians. The design is of an empowered individual who represents the improving wellbeing of Indigenous communities, through increased education, work, community safety and constitutional recognition. An array of dotted rings encourage the empowered individual. These rings represent the Government’s coordinated agenda to achieve these outcomes that will ultimately culminate in higher standards of living for all Indigenous Australians. This original artwork design was created by Marcus Lee. Marcus Lee Design is a creative design agency accredited by Supply Nation. The design has been adapted for indigenous.gov.au, showcasing news stories and information for Aboriginal and Torres Strait Islander peoples.
You can also read