INVESTOR PRESENTATION - 4 November 2019 - Eramet

Page created by Lynn Stevenson
 
CONTINUE READING
INVESTOR PRESENTATION - 4 November 2019 - Eramet
INVESTOR PRESENTATION

4 November 2019
INVESTOR PRESENTATION - 4 November 2019 - Eramet
Disclaimer

This presentation does not constitute an offer to sell or the solicitation of an offer to buy any securities, nor shall there be
any offer or sale of these securities in any jurisdiction in which such offer, solicitation or sale would be unlawful under the
securities laws of any such jurisdiction.
The securities to be offered have not been registered under the U.S. Securities Act of 1933, as amended (the “Securities
Act”) and may not be offered or sold in the United States absent registration or unless pursuant to an applicable
exemption from the registration requirements of the Securities Act and any other applicable securities laws. The securities
will be offered outside the United States pursuant to Regulation S under the Securities Act pursuant to an exemption from
registration. There is no assurance that the offering will be completed or, if completed, as to the terms on which it is
completed.
This presentation is not a prospectus for the purposes of the Regulation (EU) 2017/1129, as amended.
PRIIPS Regulation / Prohibition of sales to EEA retail investors: The securities referred to herein are not intended to be
offered, sold or otherwise made available to and should not be offered, sold, or otherwise made available to any retail
investors in the European Economic Area (the "EEA"). For these purposes, a retail investor means a person who is one
(or more) of: (i) a retail client as defined in point (11) of Article 4(1) of Directive 2014/65/EU (as amended, "MiFID II"); or
(ii) a customer within the meaning of Directive 2016/97/EU, where that customer would not qualify as a professional client
as defined in point (10) of Article 4(1) of MiFID II. Consequently, no key information document required by Regulation
(EU) No 1286/2014 (as amended, the "PRIIPs Regulation") for offering or selling the securities referred to herein or
otherwise making them available to retail investors in the EEA has been prepared and therefore offering or selling the
securities referred to herein or otherwise making them available to any retail investor in the EEA may be unlawful under
the PRIIPs Regulation.
MiFID II product governance / Professional investors and ECPs only target market: The target market assessment in
respect of the securities referred to herein has led to the conclusion that the target market of the securities referred to
herein is eligible counterparties and professional clients only (each as defined in MiFID II).

2
INVESTOR PRESENTATION - 4 November 2019 - Eramet
Summary

    1–   Introduction to Eramet

    2–   Solid business fundamentals: focus on the Group’s assets and markets

    3–   A company geared to deliver value-accretive growth through the cycle

    4–   Focused strategy and targeted growth plans

    5–   Conclusion

         Appendix

3
INVESTOR PRESENTATION - 4 November 2019 - Eramet
Introduction to Eramet
INVESTOR PRESENTATION - 4 November 2019 - Eramet
A global and diversified mining and metallurgical leader
    ERAMET IN NUMBERS IN 2018                                          SALES BREAKDOWN BETWEEN 2 MAIN DIVISIONS
                                                                              Diversified and balanced business model
      €3.8bn sales                        22% EBITDA margin
                                                                          High                                  Mining and
      13,000 employees                    €581m operating income          Performance                               Metals
                                                                          Alloys Division                         Division
      Presence in 20 countries                                            27 %                                        73 %
                                          €2.5bn financial liquidity

      €1,216m market cap.                 38% gearing                   Mineral Sands BU    €3.8bn of sales
      at 31-Oct 2019                                                    6%                      in 2018
                                                                                                              Manganese BU
                                                                                                                      48%
                                                                           Nickel BU
                                                                           19%

    UNDISPUTED LEADERSHIP POSITION                                     COVERING THE ENTIRE VALUE CHAIN

                                                                                                                   Extractive
          #2 largest producer of high-grade Mn ore                     Exploration               Mining            metallurgy

          #1 producer of high-grade ferronickel

          #5 largest producer of titanium raw materials

          #2 largest producer of Mn alloys                                                                         Elaboration
                                                                        Recycling            Transformation        metallurgy
          #1 producer of refined alloys

          #2 largest producer of high-power closed-die forged parts

    GLOBAL LEADER ACROSS ALL AREAS OF THE EXTRACTIVE METALLURGY VALUE CHAIN WITH WORLD-CLASS ASSETS

5
INVESTOR PRESENTATION - 4 November 2019 - Eramet
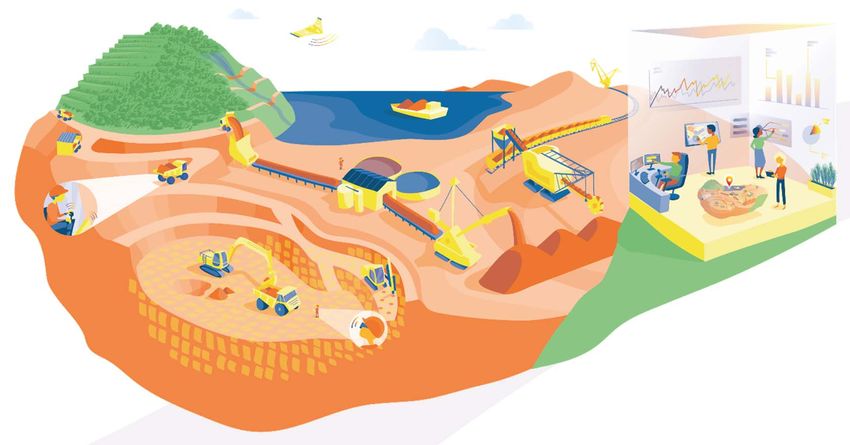
World-class mining assets:
long life, first quartile cash cost and scalable
                           Gabon: 269 Mt resources, >40 years remaining life
                                                                                                   All weather cash generative
                               >     High-grade oxide commercial ore                                  Cycle proof cash generation
                               >     Fully de-risked activity: operated for 50 years                  Long life, 1st quartile production

                                                                                                   Two game changers
                           New Caledonia: 190 Mt resources
                                                                                                      1st quartile mining operations
                               >     SLN mines: high-grade ore and very significant resources
                                                                                                      Rescue plan starting to deliver
                               >     Fully de-risked activity: operated for 130 years
                                                                                                      Indonesian ban: a game changer

                                                                                                   Leveraging massive potential
                           Indonesia – Weda Bay: 635 Mt resources1
                                                                                                      1st quartile mining operations
                               >     One of the largest nickel oxidized deposits in the world on
                                                                                                      2nd quartile NPI production
                                     Halmahera island

                                                                                                   Diversification
                           Senegal: 25.7 Mt resources (HMC2), >30 years
                                                                                                      Late-cycle commodities
                               >      Zircon and ilmenite production
                               >      Successful operations ramp up since 2014

                      Under study                                                                  Growth and diversification
                           Argentina: 9.9 Mt drainable resources (LCE3), >50 years                    Energy storage and increased
                                                                                                      needs for batteries
                               >      Key features: Long life, low cost, scalable project

    Notes:
    1 9 Mt Nickel content (held at 43% by Eramet)
    2 Heavy Minerals Concentrate (HM sands content)
6   3 LCE: Lithium Carbonate Equivalent
INVESTOR PRESENTATION - 4 November 2019 - Eramet
A long-term strategy supported by a strong shareholding
structure

    SHAREHOLDING STRUCTURE AS OF JUNE 30TH, 2019                             ADDITIONAL FLEXIBILITY GRANTED BY SHAREHOLDERS

                                                                             Family and state-owned group
                                           APE (French State)
                                                                                > French State: shareholder for 40 years (25.6%)
Sorame + CEIR                           25,6%
 (Duval family)     36,9%                                                       > Duval family: shareholder since 1999 (36.9%)

                                                            BRGM**           Shareholding stability
                                                1,3%
                                                                                > Concert party agreement signed between the two
                                                                                  main shareholders since 1999

                                                                                > Long-term investment approach aligned with group
                                               32,1%                              strategy and business environment
                             4,0%                      Other float
                                                                             Time tested shareholding commitment
                         STCPI*
                                                                                > 2016: French state: 8-year maturity €200m loan to
                                                                                  SLN
* STCPI (Société Territoriale Calédonienne de Participation Industrielle):
► Entity owned by the New Caledonian provinces
                                                                                > 2016: €100m ODIRNAN subscribed at >80% by the
** BRGM (Bureau de Recherches Géologiques et Minières):                           French state and the Duval family
► The French Geological Survey Office                                             > Equity conversion if needed

    INTIMATE SUPPORT FROM TWO LONG TERM SHAREHOLDERS; STRONG ANCHOR TO THE FRENCH PUBLIC SECTOR

7
INVESTOR PRESENTATION - 4 November 2019 - Eramet
An experienced leadership with an established track-record

    EXECUTIVE COMMITEE                                                                                        PROVEN MANAGEMENT TRACK-RECORD

                                                                                                               1  Christel BORIES granted the "Prix des 100
                                                                                                                       jours" award

     Christel BORIES                         Kléber SILVA                  Jérôme FABRE
                                                                                                               2
     Chairman and CEO                Deputy CEO in charge of            Deputy CEO in charge of                       Thomas DEVEDJIAN is awarded the “Prix de la
                                      the Mining and Metals              the High Performance
                                                                                                                       Transformation”
                                             Division                        Alloys Division

                                                                                                               3
                                                                                                                      Winner Of The BFM Business “Prize for Digital
                                                                                                                       Acceleration in the Industry 4.0 category“ and
                                                                                                                       in the category “Meilleur Projet d’Acceleration
                                                                                                                       Digitale 2019”
                                        Michel CARNEC                   Virginie de CHASSEY
    Thomas DEVEDJIAN
                                     Executive Vice President          Executive Vice President,
Deputy CEO in charge of
                                    Human Resources, Health,             Communication and
  Finances and Digital
                                      Safety, and Security1            Sustainable Development

                Philippe GUNDERMANN                     Jean de L’HERMITE
                  Executive Vice President              Group General Counsel
                  Strategy, Innovation and
8                    Investor Relations                                             1   Appointment of Anne-Marie Le Maignan effective January 1, 2020
INVESTOR PRESENTATION - 4 November 2019 - Eramet
An increasingly more committed, contributive and recognized
corporate citizen

    1                             Societal engagement aligned with strategic vision
                        A 2018-2023 CSR roadmap to structure and set the pace for our action plans
                        Compliant with the United Nations’ Sustainable Development Goals

    2                             Contribute to the communities in which sites are implemented
                        First risk of the Mining and Metals sector: license to operate. Eramet’s DNA has always been to associate the main
                        countries and territories where it operates
                        Beyond mining operation, contribute to the local development and preserve the environment

    3                             Ranked 3rd out of 43 mining and metals corporates for its CSR performance by Vigeo-Eiris

                        “Advanced” performance level
                        Eramet’s best performance since first participating in 2011
    ESG overall score evolution

                                                                           66
          (out of 100)

                                                             48
                                        44        45

                                       2013      2015       2017         2018

9
INVESTOR PRESENTATION - 4 November 2019 - Eramet
Key credit strengths

     1
         Strategy focused on cash generation and diversification (metals, markets and               • Developing additional cash generative
         countries)                                                                                   assets

     2
         Strategy supported by world-class mining deposits of high grade ore and long               • Focus on 1st quartile mining assets with
         life resources                                                                               remaining life >30 years

     3                                                                                              • Supportive end-markets
         Solid long-term growth prospects in all Eramet main end-markets:
                                                                                                    • Structural growth with well-identified
         carbon steel, stainless steel, ilmenite/zircon, lithium batteries, aeronautics
                                                                                                      drivers
     4
         Numerous operational action plans to enhance profitability at SLN and A&D                  • Reorganizational actions at A&D
         Proven management track record in successful new projects: TiZir, Weda Bay                 • Strong LT demand for TiZir products

     5
         Upcoming asset development program to further enhance market positioning                   • Comilog 2020
         and continue to diversify the Group’s business model                                       • Lithium project in Argentina

     6                                                                                              • Track record in swiftly preserving cash
         Strict financial policy and solid balance sheet relying on:
                                                                                                      during cycle throughs
            Strong liquidity profile
                                                                                                    • Cut in dividends over 2013 - 2016
            Prudent growth strategy with a strict decision-making policy for projects              • Capex reduction over 2013 - 2016
            Flexibility to significantly reduce industrial capex when required                     • Strong deleveraging post 2015
            Moderate distribution policy with ability to adapt dividend to the group’s situation     (excluding acquisitions)

     7                                                                                              • 2016: French State loan to SLN and
         Support from long-term shareholders; strong anchor to the French public sector               ODIRNAN issuance (>80% held by the
                                                                                                      French State and Duval family)
     8
                                                                                                    • 3rd/43 mining companies on CSR
         Recognized commitment towards energy transition, with excellent CSR metrics                  performance

10
Solid business fundamentals: focus on the
Group’s assets and markets
Two main divisions; five business units

                                                                                             Global Sales Network
                                                                                             and Group Innovation,
                                                   Mining and Metals                                                                 High Performance
                                                                                           Research and Development
                                                        Division                                                                      Alloys Division

                                                                                             Li                           Forged/Rolled
                                                                                                                            Products               High Speed Steels
                                                                                                                       & Closed-die Forged            & Recycling
                    Manganese            Mineral Sands                  Nickel                     Lithium                    Parts                       BU
                       BU                     BU                         BU                       (under study)        BUs (Aubert & Duval)            (Erasteel)

                    Sales: €1,857m          Sales: €212m             Sales: €738m                                                        Sales: €1,020m

               Construction,
Applications

                                        Ceramics, chemicals,     Stainless steel
               automotive sectors and   refractory, foundry      production and nickel      Aircrafts manufacturing,   Aerospace, land           Aerospace, high speed
               chemistry batteries,                              based alloys               electric vehicles and      turbines, oil, defense    steels , tooling, and
               fertilizers and paint    Also used for pigments                              energy storage             and recycling             recycling
               pigment                  and titanium metal       Also used for batteries

               12
Mining and Metals Division
Manganese
Manganese BU: world-class competitiveness
                                                                                                             Key features
                                                       1                                      A highly competitive manganese mine in Gabon
                                                                                              (Moanda), operated by Comilog
                                                  Extraction of                             > High-grade oxide ore 44%
Eramet’s activities

                                                manganese ore in                            > First quartile cash cost
                                                   order to…
                                                                                                Two units of local transformation in Gabon for
                                                                                                high grade manganese metal production and
                                                                                                manganese alloys
                                           2
                                                                                                6 pyrometallurgical industrial plants in Europe
                                                                                                (1 in France, 3 in Norway), in Gabon and in the
                                  …be transformed in                                            USA
                                  manganese alloys                                              Ore transportation in Gabon operated by a 100%
                                    to produce…                                                 owned railway company (Transgabonais)

                                                                                                           Main customers
                                                           3
Clients’ activities

                               Carbon steel 90%
                                             90

                           Manganese makes
                           steel harder, more                        10%
                           elastic and more                                Others
                           wear-resistant.
                           Widely used in the
                           construction and                        Chemistry batteries,
                           automotive                              fertilizers and paint
                           sectors.                                pigments and other
                      15                                           metallurgical applications
Manganese ore prices decreasing from H1 2019
high levels

                 MONTHLY CHANGE IN MANGANESE ORE AND MEDIUM-CARBON FERROMANGANESE (REFINED) PRICES1

$/dmtu                                                                                                                                                         €/t
9
                                                                                                                                                               1 800
                                    Quick price
8                               recovery further to
                                  production cuts
                                                                                                                                                               1 600
                                from key suppliers
7                                                                                                                                                              1 400

6                                                                                                                                                              1 200

                                                                                                                                                               1 000
5
                       Depressed
                       economic                                                                                                                                800
4                       outlook
                                                                                                                                                               600
3
                                                                                                                                                               400
2                                                                                                                                                              200

1                                                                                                                                                              0
 Jan-15 Apr-15   Jul-15 Sep-15 Dec-15 Mar-16 May-16 Aug-16 Nov-16 Jan-17 Apr-17 Jun-17 Sep-17 Dec-17 Feb-18 May-18 Aug-18 Oct-18 Jan-19 Mar-19 Jun-19 Sep-19

                                                      Manganese ore           Medium-carbon ferromanganese

 AVERAGE MANGANESE ORE PRICES ABOVE LONG TERM CRU PRICE FORECASTS

                                                                               1   Manganese ore: CIF China CRU 44%
16                                                                                 Medium-carbon ferromanganese: CRU Western Europe spot price
Further to H1 record in steel production, ore supply
expected to adjust to new demand environment

 DEMAND: GLOBAL CARBON STEEL PRODUCTION                                SUPPLY: GLOBAL MANGANESE ORE PRODUCTION1

            +4.4%          China     Rest of the world                                  +15.6%
                1,802
     1,726                                                                                            20.0         +11.9%
                                   +3.2%
                                                                                 17.3
                           1,354         1,397                                                                            16.4
      50%           52%                                                                                        14.7
Mt

                                                                      Mt
                            50%            54%

      50%           48%
                            50%            46%

     2017       2018      YTD Sept      YTD Sept                                  2017                 2018   YTD Sept   YTD Sept
                            2018          2019                                                                  2018       2019

 > STEADY INCREASE OF GLOBAL CARBON STEEL PRODUCTION
 > MARKET EXPECTED TO ADJUST PRODUCTION - MARGINAL PRODUCERS CLOSE TO BREAKEVEN

                                                         Source: Worldsteel Association / Eramet estimates
17                                                       1Manganese content
Manganese BU – financial overview
         €m (unless otherwise stated)                            2016          2017            2018             1H18           1H19

         Sales                                                1 439            1 919           1 857             928            904

                                    ● Production
                                    (in Kt)
                                                              3 413            4 163           4 330            1 995          2 117
             Ore and sinter
                                    ● Pricing   *                4,3            6,0             7,2               7              6
                                    (in $/dmtu)

                                    ● Production
                                    (in Kt)
                                                                 703            716             719              356            376
             Manganese alloys
                                    ● Pricing   **            1 161            1 814           1 551            1 568          1 551
                                    (in €/t)

         EBITDA                                                  358            861             784              390            316

             EBITDA margin (%)                                   25%           45%             42%              42%            35%

     1   Current operating income                                219            738             699              331            271

         Capex                                                   104             89             140              43             78

         *CRU CIF China 44% average yearly price
         **CRU MCFeMn average yearly price

                                                            Price recovery: for both manganese                Price: high price
                                                             ore and alloys                                     environment in H1 2019
                                                             –     Volatile ore market vs. resilient high       albeit lower than H1
                                                                   alloys prices                                2018

                                                            Volumes increase: Strong growth in                Volumes: H1 2019
                                                             ore production                                     record production in
                                                                                                                both ore and alloys
                                                            Successful action plans: Increased
                                                             productivity and margins
                                                            Normalised capex with increase driven
                                                             by the trans-Gabon railway network
                                                             renovation
               Notes:
18             Excluding the Mineral Sands BU, which was part of the Manganese BU until 2017
Nickel
Nickel BU: a thorough transformation underway

                                                                                                                                               Key features
                                                     1                                                                Implementation of new business model in New
                                                                                                                      Caledonia with 5 operated mines and one
                                         Extraction of nickel ore
                                              in order to…                                                            pyrometallurgical plant
Eramet’s activities

                                                                                                                   Ramp up of Weda Bay nickel
                                                                                                                 >  One of the world's largest undeveloped nickel
                                                                                                                    deposits with huge mining potential
                                                                                                                 > Project being developed in partnership with
                                     2
                                                                                                                    Tsingshan, #1 global stainless steel producer
                            …be transformed in                                                                   > NPI production start in H1 2020 in parallel to
                           nickel ferroalloys1…                                                                     mining development, 13 kt offtake for Eramet
                                                                              2
                                              Ferronickel
                                                23% Ni               …or in pure nickel                            Ramp-up of the high purity nickel refinery in
                               NPI                                        salt2…                                   Sandouville, France
                           10 / 15% Ni                                                                           > Production of nickel salts and high-purity nickel

                                                                                                                                            Main customers

                                               69%
Clients’ activities

                                                            3

                           Stainless
                                steel

                                                                        10% Nickel
                                                                            base
                                                                            alloys
                                                                     6%
                                                                          Batteries       1   Ferronickel and NPI through pyrometallurgical process
                      20                                    15%                           2   Nickel salt and nickel metal through hydrometallurgical process
                                                            Others
Nickel best performing base metal YTD further to the
 Indonesian ore export ban announcement

                                                                                         NICKEL SPOT PRICE VS. AVAILABLE STOCKS

 LME Nickel price                                                                                                                                                                                                                                                       Nickel stocks
 USD/lb USD/tonne                                                                                                                                                                                                                                                          (tonnes)
                                                                                                                                                                                                                                         Government of
                                                                                                                                                                                                                                           Indonesia
9.1     20 000                                                                                                                                                                                                                           announces ore                                600 000
                                                                                                                                                                                                                                          exports ban

8.2     18 000                                                                                                                                                                                                                                                                        500 000

7.3     16 000
                                                                                                                                                                                                                                                                                      400 000

6.4     14 000
                                                                                                                                                                                                                                                                                      300 000
5.4     12 000
                                                                                                                                                                                                                                                                                      200 000
4.5     10 000

         8 000                                                                                                                                                                                                                                                                        100 000
3.6

2.7      6 000                                                                                                                                                                                                                                                                        -
                                                              Nov-15

                                                                                                                    Nov-16

                                                                                                                                                                          Nov-17

                                                                                                                                                                                                                                Nov-18
                 Jan-15

                                   May-15

                                                     Sep-15

                                                                       Jan-16

                                                                                         May-16

                                                                                                           Sep-16

                                                                                                                             Jan-17

                                                                                                                                               May-17

                                                                                                                                                                 Sep-17

                                                                                                                                                                                   Jan-18

                                                                                                                                                                                                     May-18

                                                                                                                                                                                                                       Sep-18

                                                                                                                                                                                                                                         Jan-19

                                                                                                                                                                                                                                                           May-19

                                                                                                                                                                                                                                                                             Sep-19
                                            Jul-15

                                                                                                  Jul-16

                                                                                                                                                        Jul-17

                                                                                                                                                                                                              Jul-18

                                                                                                                                                                                                                                                                    Jul-19
                          Mar-15

                                                                                Mar-16

                                                                                                                                      Mar-17

                                                                                                                                                                                            Mar-18

                                                                                                                                                                                                                                                  Mar-19
      MARKET IN DEFICIT SINCE 2016: LOWEST STOCK LEVELS SINCE 2012
      SOLID LONG TERM GROWTH DRIVERS (IN PARTICULAR WITH EV TRANSITION) COMBINED WITH HIGH BARRIERS TO ENTRY

 21
Solid supply/demand equilibrium prospects

                                GLOBAL SUPPLY/DEMAND BALANCE VS. TOTAL MARKET STOCKS

200                                                                                                                         25
                        160
150
                 116                     121                                                    September 4th 2019
                               108                                                                                          20
100

 50       34                                                                                                                15

  0
                                                                                                             -5
                                                                          -18                       -25                     10
 -50                                               -40                            -47                                -53
-100                                                                                      -82
                                                                                                                            5
-150
                                                           -154    -157
-200                                                                                                                        0
         2011   2012   2013    2014      2015     2016     2017    2018   2019   2020    2021      2022     2023     2024

                  Balance (oversupply)         Balance (deficit)    LME producers stocks in weeks of consumption

       STOCK LEVELS EXPECTED TO REACH CRITICAL LEVELS AS SOON AS EARLY 2020

   22
Nickel BU – financial overview: a new business model being
implemented
     €m (unless otherwise stated)                     2016              2017              2018               1H18              1H19

     Sales                                             595               644               738                365               346

                                  ● Production
                                  (in Kt)
                                                       56                57                54                  27               24
        Ferronickel
                                  ● Pricing *
                                  (in $/lb)
                                                       4,4               4,7               5,9                6,3               5,6

     EBITDA                                           (24)              (44)               (18)                22               (25)

        EBITDA margin (%)                             n.m               n.m               n.m                 6%                n.m

     Current operating income                         (119)             (125)             (111)               (22)              (70)

     Capex                                             56                80                57                  32                10

      *Nickel LME average yearly price

                                                    Prices: rebound in 2018 from subdued levels in        Strong demand: Global
                                                     the context of sharply declining stocks                primary nickel demand up
                                                    Contained impact on profitability following            2.9% in H1 2019, notably
                                                     successful efficiency plan but penalized by one-       supported by battery
                                                     offs (ramp-up of Sandouville refinery and social       development (+25%)
                                                     and societal disruptions in New Caledonia)            Profitability: SLN actions
                                                                                                            leading the way to cash cost
                                                    Strict investment policy: Stable capex
                                                                                                            reduction in Q4 2019
                                                     reflecting strict investment criteria
                                                                                                           SLN starting to contribute
                                                                                                            positively to cash flow
                                                                                                            generation with ore exports

23
Mineral sands
Mineral Sands BU: world-class mining operations
                      in Senegal and downstream operations in Norway
                                                           1                                                  Key features
                                           Sand mining                                          TiZir Senegal:
                                               and                                          >    Extraction of heavy mineral rich sands ~700-750kt
                                           separation…                                           per annum with the world largest single dredge
                                                                                  2
Eramet’s activities

                                                                                                 mineral sands operation
                                                                                            >    Of which ~500kt of ilmenite (titanium-iron oxide)
                           4                                     …in order to                    and the remainder is leucoxene, rutile and zircon
                                                               produce titanium
                                                                                                Ore rail transportation from the mine to the port
                                                                  minerals…
                                                                                                of Dakar operated by TiZir
                                 …in order to
                                                   3                                            TiZir Norway: Transformation of ilmenite
                                  produce
                                   zircon                                                       (metallurgical valorization) into titanium slag and
                                                                                                pig iron
                                                              …to be
                                                         transformed in
                                                          titanium slag

                                                                                                           Main competitors
                           Others                                Others      TiO2 pigment
Clients’ activities

                                             52%   Ceramics             90%
                                                                      10% 90%

                                        Zircon                        Downstream:
                               28%     Finished                      pigments and
                                       products                      titanium metal

                       Chemicals     20%

                      25
Favourable long-term perspectives for titanium products
with slight price erosion after increase in H1 2019

                         MONTHLY CHANGE IN CP GRADE TITANIUM DIOXIDE SLAG PRICES1

     USD/ton

850

800

750

700

650

600

550

500
  Jan-16       Jul-16   Dec-16     May-17      Oct-17                Mar-18                Aug-18             Jan-19   Jun-19

 GROWTH OF PIGMENT MARKET – 90% OF TITANIUM-BASED END-PRODUCTS2

                                                  1   Source CP slag: Market consulting, Eramet analysis
26                                                2   Titanium dioxide slag, ilmenite, leucoxene and rutile
Solid zircon products market environment despite
slowdown in Q3 2019

                                      MONTHLY ZIRCON PREMIUM PRICES1

     USD/ton
1 800

1 600

1 400

1 200

1 000

 800
   Jun-16      Nov-16     Mar-17     Aug-17      Dec-17               May-18              Sep-18               Feb-19   Jul-19

 SUPPLY/DEMAND BALANCE FOR ZIRCON EXPECTED TO BE SLIGHTLY IN EXCESS IN 2019, WITH A STRUCTURAL FORECAST
 DEFICIT IN THE MEDIUM / LONG TERM

27                                                 1   Source Zircon premium: FerroAlloyNet.com, Eramet analysis
Mineral Sands BU – financial overview
€m (unless otherwise stated)                                              2017                              2018                                 1H18                           1H19

Sales                                                                      100                               212                                  58                             139

                                 ● Production
                                                                           725                               774                                 374                             378
     Heavy Mineral               (in Kt)
     Concentrates                ● Pricing (Zircon)   *
                                 $/tonne
                                                                           742                              1 146                               1 025                           1 225

                                 ● Production
                                                                           181                               189                                  85                             101
     CP grade titanium dioxide   (in Kt)
     slag                        ● Pricing   **                            614                               687                                 676                             761
                                 $/tonne

EBITDA                                                                     34                                 62                                  17                              52

     EBITDA margin (%)                                                    34%                               29%                                  29%                            37%

Current operating income                                                   19                                 35                                  10                              30

Capex                                                                       5                                 12                                   3                              3

 *Zircon premium average yearly price: FerroAlloyNet.com
 **CP slag average yearly price: Market consulting
                                                              Firm demand environment:                                                Solid demand drivers despite recent market price
                                                               –     Average CP titanium slag price up +12% in 2018                     erosion:
                                                                                                                                        –   Ongoing robust global titanium demand from
                                                               –     Resilient increase in zircon prices with an average
                                                                                                                                            pigments producers for high-end TiO2 intermediates
                                                                     annual growth of c.35% over 2017-18
                                                                                                                                        –   Slightly reduced global demand for zircon in H1
                                                              Profitable business with resilient margins
                                                                                                                                            2019, particularly in China for ceramics
                                                              Low sustaining CAPEX following activity ramp-up
                                                                                                                                        –   Market balance for zircon expected to be slightly in
                                                                                                                                            excess in 2019, with a structural forecast deficit in
                                                                                                                                            the medium / long term
                                                                                                                                       Continued increase in margin ratio in H1
                                                                                                                                        –   To be noted: Q3 impacted by a nearly one month
                                                                                                                                            furnace shutdown in Norway, following a metal
                                                                                                                                            tapping incident

28                                                                 TiZir business being in ramp up back in 2016, numbers are shown from 2017 onwards only.
High Performance Alloys Division
High Performance Alloys: a key supplier with unique
know-how dedicated to strategic industries

                                                                          High Performance
                                                                               Alloys

                                                                              1,020 M€
                          Special steels, nickel-based superalloys and
                                                                            Turnover in 2018                 High-speed steels
                            aviation grade titanium alloys producer                                              producer

                               Forged                Closed-die                                    High-speed
     Long products                                                           Powders                                       Recycling
                              products              forged parts                                     steels

                                                                                                 Worldwide leader of
     European leader in
                          European leader in     #2 worldwide for high-                        powder metallurgy high
      aerospace long
                          forgings for defense     power closed-die                            speed steel (cutting and
         products
                          and nuclear markets         forged parts                             cold tools / mechanical
                                                                                                    components)

30
Aubert & Duval recent operational issues clearly identified and
strict action plan being rolled out
 On December 8th Eramet announces taking corrective actions as part of a quality process review within its Alloys division

     Situation overview                                              Measures taken
                                                                      Non compliant processes were terminated immediately and
      Non compliances identified in the quality management            sanctions swiftly imposed
      systems with no impact to date on the safety of the
      products in use…                                                Self-disclosure to clients of the quality review process and
                                                                      remediation plans were implemented in close cooperation
      Taking into account accumulated technical metallurgical         with them
      expertise but with non conformances in quality processes
                                                                      Production routines revised including additional test and
       The issue came under the spotlight further to audits           controls, resulting in slowdown in production flows and delaying
      launched under the newly appointed Group management             sales
                                                                      Additional sales delays due to customer reviewing and
                                                                      validating new production routines

     Losses incurred / Financial impacts                            Looking forward
      Non-current provision of €65m booked in 2018 for Aubert &      All sites returned to a normal billing rate in September,
      Duval, for the cost of the quality process review              except Les Ancizes, where the teams are fully involved
      H1 net debt impacted by -€107m one-off effect of which         towards achieving this objective in the coming months
      €70m in working capital to be unwound                          AD has recently signed long term contracts and short term order
      COI in H1 2019 of EUR -27m affected by operational             book is unaffected (book to bill > 1)
      consequences of the quality review process (delivery
                                                                     Remedies actions are in place with a new organization that
      delays, supply chain issues, additional costs, …)
                                                                     should better position the division

 CURRENT FOCUS FOR ERAMET IS TO COMPLETE RETURN TO NORMAL OPERATIONS

31
High performance alloys Division – financial overview

     Alloys

     €m (unless otherwise stated)        2016              2017              2018             1H18              1H19

     Sales                               949              1 087             1 020              520               423

     EBITDA                               74                84                46                43                (5)

        EBITDA margin (%)                8%                8%                5%                8%                n.m

     Current operating income             27                32                (8)               10               (27)

     Capex                                55                59                63                31                26

                                       Stable and solid aerospace market                   Decline in AD margins:
                                        environment resulting in resilient margins           sales still adversely impacted
                                       Erasteel recovery in high-speed steels, mainly       by delivery delays due to
                                        driven by raw material prices                        bringing into conformity
                                                                                             quality processes
                                                                                            Erasteel High speed steel
                                                                                             sales strongly impacted by
                                                                                             sharp slowdown in
                                                                                             automotive

32
A company geared to deliver value-accretive
growth through the cycle
Resilient performance through the cycle with recently
improved margins following optimization program

 SALES EVOLUTION BY BUSINESS (€M): ABILITY TO MAINTAIN SALES LEVEL AT OR ABOVE €3.0BN
     In €m                                                                                        3,825
                                                            3,652
                  2,984                                                                           27%                                  2,762                                  2,703
                                                             30%
                   32%                                                                                                                    134                                    195
                                                             18%                                  19%                                 759                                    615
                   20%                                                                                                                    544                                  562
                                                             50%                                  49%
                   48%                                                                                                                  1,325                                  1,331

                  2016                                       2017                                 2018                          YTD Sept 2018                          YTD Sept 2019
                                                     Mineral Sands                High Performance Alloys                       Nickel            Manganese
     Breakdown by divisions excluding holding and eliminations

 EBITDA : STRUCTURAL STEP UP WITH 2019 GUIDANCE SIGNIFICANTLY ABOVE 2016 LEVELS
 In €m                               871                       843
                                                                                                                                                                                      Full year
          EBITDA                 EBITDA Margin                                                                                                                                        Guidance*

                      375
                                                                                                                                       1H19 levels
                                                                     24%                                            22%              already almost
                                                                                                                                     in line with full
                                                                                                                                     2016 EBITDA                   307
                     13%
                                                                                                                                       generation

                     2016                                            2017                                          2018                                        H1 2019
                                                                    *with the assumption of market conditions of September 2019: in particular, monthly average September manganese
34                                                                  ore price at USD 5.49/dmtu and nickel LME prices at USD 8.02/lb (USD 17,673/t)
Recurring cashflow generation

 NET OPERATING CASHFLOW – ABILITY TO MAINTAIN POSITIVE CASHFLOWS EXCLUDING ONE-OFFS
     In €m                     687                  2017-2018 variation
                                                   includes ~EUR250m                                                            €(107)m one-off impact
                                                       swings in WC                                                             of A&D quality review of
                                                                   449                                                            which €70m working
                                                                                                                                 capital increase to be
                                                                                                                                       unwound
                                                                                                           173
             121                                                                                                                                  100
                                                                                                                                                    107
                                                                                                                                                -7
             2016              2017                               2018                                 H1 2018                                H1 2019
                             Net Operating Cashflow (excl. A&D one-off)                            Net Operating Cashflow
 NET DEBT AND NET DEBT/EBITDA RATIO
 In €m     2.2x                                                                                  Group’s net financial debt
                                                                                                increased to 1,043 M€* as
                                                                                                 at the end of September
                                                                                                 2019, notably due to Q3                           1.3x
                                                                                               projects early capex and tax
                                                                                                        payments**                                930*
             836
                                                                   717
                                                                     0.9x                                  449
                               376

                                  0.4x                                                                          0.5x

             2016              2017                               2018                                 H1 2018                                 H1 2019
 PROVEN TRACK-RECORD OF DELEVERAGING AND CONSERVATIVE FINANCIAL POLICY TO MAINTAIN LEVERAGE AT ACCEPTABLE LEVEL

                                      *Excluding the impact of IFRS16.
                                      **The increase is notably due to (i) early capex regarding the Group’s manganese ore expansion project in Gabon and
                                      the Group’s lithium development project in Argentina and (ii) payment of tax debts.
35
Appropriate toolbox to preserve a strong financial
profile
 GROUP CAPEX EVOLUTION 2012 – 2018: C. €150M RECURRING CAPEX ONLY
In €m                           Growth         Recurring   Productivity   HSE/CSR         Sustaining
         641
                      587

         339          286                346
                                                              268                                                         281
                                                                                    217                230
                                         243                  140                                                         150
         302          301                                                           138                 129
                                                              38                                       26 29              30
                                         103                      29           25                                         45
                                                               59                   38 16               47                57
        2012         2013             2014                   2015               2016                   2017              2018

                                       Significant CAPEX
                                                                               Cash
          CAPEX                             reduction                                                   Prudent increase in
                                                                            preservation
        Management                      vs. initial budget                                              capital expenditures
                                                                               mode
                                     (including Weda Bay)

 DIVIDEND DISTRIBUTION ADJUSTED IN LINE WITH CASH GENERATION TO PRESERVE LIQUIDITY
      378%
                                                                                                       30%               30%
In €m

                                                                                                        61
         34
                                                                                                                          16
        2012         2013            2014                    2015               2016                   2017              2018
                               Dividend distribution (excl. minorities)              Payout ratio
36
A strong balance sheet and high liquidity

 EQUITY AND GEARING RATIO                                       TRACK RECORD OF STRONG LIQUIDITY LEVELS
Gearing                                                                                    2,806
Ratio:    47%    19%        38%      23%      51%
                                                                                                                               2,602
In €bn                                                         In €m                                         2,468
                 2,0                2,0
                            1,9                                                                                                                 2,244
          1,8                                 1,8

                                                                                           1,825                               1,501
                                                                         1,698                               1,367
                                                                                                                                                1,143

                                                                                                                                            *

                                                                                                               981               981            981
                                                                                             981

                                                                                                               120               120            120
          2016   2017       2018   H1 2018   H1 2019                      2016              2017              2018           H1 2018        H1 2019
                                                                                  Available cash         Undrawn RCF*            Undrawn EIB financing**

 TARGETED MINIMUM 20% COVENANT HEADROOM UNDER GEARING RATIO; STRONG LIQUIDITY PROFILE AT ALL TIMES

                                                       *Revolving Credit Facility (“RCF”)
                                                       **European Investment Bank (“EIB”) :
                                                        120m loan granted in October 2018 with a 10-year maturity
37                                                      Intended to support R&D expenditure, modernization and digital transformation
A back ended debt repayment profile with no major
upcoming maturity pro-forma of ongoing refinancing
 DEBT MATURITY PRO-FORMA TO 2020 MATURITY REFINANCING, AS OF JUNE 30, 2019
 In €m                                                                   689
                  620       Of which 2020                                 10
                            Eramet notes
                             refinanced
                  118          hereby       Proforma refinancing                                       €300m notes offered
                                                                                                     hereby (refinancing 2020
                                                                         500                              senior notes)
     304                                                                              314
                                            262                                            6
                  492          169           53
     284                       30
                                             201             19          170
                                                                                                                                     76
                               131                                                                     5              5                              2
      16                                                     10                                                                      73
                                                                                                       -2                                            -17
     2019        2020          2021         2022         2023           2024          2025           2026          2027            2028         >2028

              Commercial papers, banks and operating debts        Eramet and TiZir bonds       French govt. loan to SLN         IFRS 16 (non cash)

 BROAD AND DIVERSIFIED ACCESS TO LIQUIDITY

      No major repayment before 2024 post-refinancing 2020 bond
      Broad access to liquidity, with recently

      >    EUR225M general corporate purposes financing to be implemented with three relationship banks (initial 2-year maturity
           with an option that can be exercised by Eramet to extend it to January 2024)

      >    Ongoing mandate with IFC to syndicate the financing of COMILOG 2020

38
Strict investment framework applied in all our investment
decisions to deliver value-accretive growth

 KEY PILLARS DRIVING OUR WELL DEFINED AND CAUTIOUS INVESTMENT DECISION PROCESS

      1                  2                  3                 4                   5                     6
                                                                                                              Selection of
           In line           Attractive          Fully de-                                                    partners for
                                                                    Minimum           Appropriate
            with             market and           risked                                                      larger scale
                                                                    IRR and           and secured               projects
          focused             industry          industrial
                                                                    payback            financing                  when
          strategy           conditions          process
                                                                                                                 needed

    Track record in successful project development (e.g. TiZir successful takeover, Weda Bay fast mine development managed
     by Eramet)

    Track record of postponing or amending projects while keeping flexibility of schedule rephasing (e.g. COMILOG with quicker
     ramp up and lower CAPEX in the short term)

 PROJECT EXECUTION CAPABILITIES CONSIDERABLY REINFORCED IN THE LAST TWO YEARS

39
Prudent and strict financial policy

 1
                           Maintain significant liquidity at all time
 Conservative financial
                           Maintain minimum covenant headroom of at least 20%
 policy
                           Anticipate debt repayment

 2                        Ongoing action plans to deliver productivity gains in 2019
                          Capital expenditure monitoring

                          >   Flexibility to adjust investments schedule depending on market conditions
 Strong focus on
 profitability            >   COMILOG expansion reviewed to deliver higher marginal EBITDA at lower
 improvement and cash         CAPEX
 generation
                          Close monitoring of working capital needs, target WC requirement reduction,
                          especially in High Performance Alloys
                          Continuous optimization of the asset portfolio through potential asset
                          disposals

 3
                          Context-adjusted dividend distribution
                          >   Pay-out ratio of less than 30% on average since 2010
 Long-term support        Ability to adapt distributions to Eramet’s situation:
 from Eramet’s
 shareholders             >   No dividend over 2013 – 2016
                          8-year maturity €200m loan from the French State to support SLN in 2016
                          Option to reimburse ODIRNAN in stocks if necessary

40
Focused strategy and targeted growth plans
Group strategic transformation: increasing cash
generation and portfolio diversification

                                                                          2
                                                                              GROWING
                                                                              in our attractive businesses
1
                                                                                Manganese ore: growth in volumes in Gabon
    FIX / REPOSITION                                                            through dry process and opening of new plateau
    our least performing assets
                                                                                Mineral sands: successful takeover bid for
      Nickel :                                                                  MDL: first step in growth
                 SLN: Eramet has already accomplished                           Weda Bay Nickel:
                 a large part of its turnaround plan
                                                                                        Fast track development of the mine to
                 Sandouville : break-even in EBITDA                                     supply growing market, based on
                 target to be achieved after Q4 annual                                  massive mining potential
                 maintenance shutdown
                                                                                        NPI plant start up ahead of schedule
      High Performance Alloys :                                                         with first tons expected in H1 2020

                 AD: quality issues identified and being
                 fixed – one off, no security hit

                 AD and Erasteel: reorganization to
                 increase performance

                 Ongoing portfolio review                  3
                                                               EXPAND our portfolio in metals for
                                                               the energy transition
                                                                 Lithium: Deposit development in Argentina

                                                                 Nickel and cobalt salts: Study of Weda Bay
                                                                 diversification towards products for EV batteries

                                                                 Li-ion batteries’ recycling: R&D programme
42
1   SLN action plan: decisive breakthroughs for two levers
    already achieved

    NO FURTHER CASH INVESTMENT FROM ERAMET, CURRENTLY POSITIVE CASH CONTRIBUTION TO THE BUSINESS

                                                   Existing ore supply to Donimabo plant to

    New business
                                                   produce FeNi
                                                                                                                •4 Mt / year export license granted
                                                                                                                 by NC government                     ✔
       model                                                                                        Export
                                                  Direct-shipping of ore at attractive margins    production
                                                                                                   -$0.60 /lb

                                                   Productivity gains in mines and plant
                                                                                                                •“147 hrs” signed & operational in
                                                                                                                 all the mines                        ✔
                                                                                                  Operating     •Agreement signed & operational at

                                                                                                                                                      ✔
    Action plans                                                                                 performance     the plant, redundant people leaving
                                                                                                  -$0.45 /lb     progressively
                                                   Fixed costs reduction

                                                                                                                •Discussions ongoing
                                                   Long term price revisions with state-owned
                                                   energy provider Enercal
                                                                                                 Energy price
    Reduction in                                                                                  -$0.25 /lb
    energy price

                                                                  Cash-cost
         2018                                                                                       2021
                                                                  -$1.30 /lb1
         1 As   of 2018 year-end, kick-start of the action plan
    43
1
    Sandouville plant: on its way to deliver nameplate capacity
    and capitalize on demand momentum

         Improved operating rate thanks to support of experts’ task force since the start of the year…
             High purity nickel production more than tripled to 4kt in H1 2019, above FY 2018 production;
             high purity nickel sales volume up to 4kt (vs 1kt in H1 2018)
             Focus on high-value nickel salts with high margins, improving the global product mix of the plant
         …reflected into improved key financial indicators
             COI losses halved to €13m in H1 2019
             Significant decrease in cash losses (free cash-flow of -€5m vs -€26m)
         Break-even in EBITDA target to be achieved after Q4 annual maintenance shutdown

                         High purity nickel production
                            (nickel metal and salts)

    In kt of Ni                                x3
                                +54.2%
                                                           4.2
     4.5                                      3.7
                  2.4
                                 1.3

         -
                  2017         H1 2018        2018       H1 2019

     BREAK-EVEN IN EBITDA TARGET TO BE ACHIEVED AFTER Q4 ANNUAL MAINTENANCE SHUTDOWN

    44
Aubert & Duval reasserts itself as a strategic European supplier
1
    for sovereignty industries (aerospace, nuclear, defense…)
    Our ambition
         Recover competitiveness through development of products for strategic markets and users
         Pursue the securitization of the strategic materials supply
         Bring innovative solutions to bluechip customers

                                      BUSINESS EXCELLENCE DRIVERS

                          Secular know-        Certified by           Close
         Unique              how in          major customers    cooperation with          R&D
    industrial set up     manufacturing of                       public entities     partnerships on
                                                     -
      in France and         advanced                            (CEA) and major        innovative
          Europe           metallurgical      ISO 9001 and                              solutions
                                                                   French and
                            products            EN 9100             European
                                                                industrial leaders

    45
2   2019 targets confirmed: Mining and Metals Division
    establishing new records YTD September 2019

     Record production in            Record1 nickel ore                          H1 record production from
     manganese ore:                  production from SLN:                        TiZir:

         3.5 Mt of ore produced at     3.3 Mt of nickel ore, +12%                  378 kt of HMC2 (zircon &
         Comilog in Gabon, +8%                                                     ilmenite) in Senegal, +1%

         Target ore production         Target ore exports 2019:                    Target HMC production
         2019: 4.5 Mt                  1.5 Mt                                      2019: 720 kt despite lower
                                                                                   grades being mined

                                                1   Over the past 3 years
    46                                          2   Heavy Minerals Concentrate
2
      COMILOG 2020: Extract full potential of our world-class
      manganese asset in Gabon
WHAT IS MOANDA?                                     RECENT TOPICS                                                  MOANDA IN 2023

    A highly competitive mine operated by             Enhance production in Bangombé                                 7 Mt manganese ore production in 2023:
    Comilog for 50 years                                                                                             +50% vs 2018
                                                      Development of Okouma plateau: dry
    Strong quality: high-grade oxide                  processing, followed by beneficiation                          Cash-cost 20% decrease in 2023
    commercial ore 46%                                process                                                        Double ore railway transportation capacity
    Deep reserves: 269 Mt resources,                  Renovation of the railway line: transport                      by 2023
    representing several decades                      capacity x2
                                                                                                                   STATUS UPDATE
    Profitable 1st quartile asset with strong         Strong commitment to E&S: employment,
    cash flow generation                              biodiversity, water                                          Final Investment Decision subject to:
                                                                                                                       Satisfactory legal and fiscal framework
                                                                                                                       Dedicated new financing

FINANCIAL HIGHLIGHTS

                                                        Manganese ore capacity (in Mt)                                 CAPEX estimated cash-out (in €m)
                                                                                                                                        200
      Project                  Payback                                                               7                            180
       IRR1                   < 5 years2                                                    >6.5
                                                                                       >6                                                             150
      > 35%
                                                                           >5                               +2.7
                                                      4.3       4.5

                                                                                                                               70
    Cash cost                   CAPEX
     -20% in                    €640m3                                                                                                                         40
      2023                       over 5
                                                                                                                       10
                                 years
                                                     2018     2019e      2020e     2021e    2022e   2023e              2018   2019e   2020e   2021e   2022e   2023e

                                                1 Internal Rate of Return
      47                                        2 From 1st year of production (2020)
                                                3 2019 value
Attractive growth opportunity: the Centenario Project
3
    a world-class lithium project in Argentina under study

         KEY PROJECT HIGHLIGHTS                                                              ATTRACTIVE METRICS

            Long life low cost and scalable project, c.10 Mt LCE1                                     Payback                        IRR
            drainable resources, c. 50 years of resources                                           3 to 5 years                  17% to 25%

            Battery grade lithium carbonate production (24 kt LCE1)

                                                                                                     Cash Cost                      CAPEX
            Fully secured perpetual mining rights                                                      $3.5k/t                     c. €525m
                                                                                                     1st quartile
            Assembled team with strong technical and project
            development / execution experience in the lithium industry
                                                                                             STATUS UPDATE
            Fully derisked “direct extraction” process with short lead time                  Still need to validate the following investment
            and reduced environmental footprint                                              criteria prior to launch:
                                                                                                   Satisfactory legal and fiscal framework
                                                                                                   Find adequate financing

    48                                                               1 LCE = Lithium Carbonate Equivalent
The Mine 4.0 and Open Innovation: new productivity levers

            Targeted                            Innovation is spreading to create value                                        Production control in real time
           investment                           Topographic measurements
                                                                                            Railway operations optimization
                                                                                                                                         OEE in real time,
                                                                                                                                      Digital Twin, Integrated

            ~ 10 %
                                                Drones, platforms, edge computing                                                        Remote Centers
                                                                                                      Apps, IoT, softwares
                                                                                                                                               (IROC)
                                                    From 3,000 ha to 300,000                        Filing time divided by 2
             of current CAPEX                           ha covered / year                               720 IoT sensors
                                                     > 50 To collected / year

 Autonomous inspection
    and supervision
      IoT and autonomous
            drones
 24 flies / day / drone

Fuel management
    4% decrease in
     consumption

    Anti-collision and
anti-fatigue management
                                                                                                                                 Geology modeling
 1 event detected every 300
                                                                                                                                   Artificial Intelligence
           hours                                                                                                                             (IA)

                                                                                                                                  Speed of modeling
                      Fleet optimization                                                                                           multiplied by 15
                           Fleet Management                                  Remote expertise
                           System, predictive
                              maintenance                                       Augmented reality

                    20% productivity gains                                 Target: >40 connected
      49                                                                    experts with the field
Conclusion
Key Investment Highlights

                           World class mining assets with competitive mines and significant resources
                           (long life, almost all first quartile cost and scalable)
 A WORLD LEADER…           World leading position in all divisions
                           Strategy focused on cash generation and diversification

                           Solid long term prospects in all Eramet main end-markets (infrastructure,
                           household appliances, energy transition, aeronautics and sovereignty industries)
 …WITH HIGH GROWTH
                           Upcoming investment plan to generate more cash flow and make the Group more
 PROSPECTS                 robust to cycles
                           Prudent growth strategy with a strict decision-making process for projects

                           SLN starting to contribute positively to cash flow
 …DEMONSTRATED
                           Sandouville: paving the way to EBITDA breakeven
 TURNAROUND CAPABILITIES
                           Successful cost reduction plan 2014-2017

                           Solid shareholders’ equity and strong liquidity profile
                           Support from long-term shareholders, with a strong anchor to the French
                           public sector and a stable banking pool, in line with the capital intensity and
 …A SOLID BALANCE SHEET
                           development cycle time of the mining and metals sector
                           Strong financial flexibility and proven nimbleness when needed with an agile
                           CAPEX policy and context-adjusted dividend distributions

                           Leading the pack on energy transition
 …AND A COMMITTED
                           Excellent CSR metrics coupled with ambitious targets
 COMPANY
                           Strong innovative capabilities

51
Summary term sheet
 Issuer                ERAMET
 Rating                Unrated
 Notional Amount       EUR 300m+
 Issue Type            Fixed
 Status of the Notes   Senior, Unsecured, Unsubordinated
 Form of the Notes     Bearer dematerialized
 Maturity              Long 5 to 6 year
                       Standalone / Change of Control / Make Whole Call / 3 month par call / Clean-Up Call
 Documentation
                       (80%)
 Governing Law         French
 Listing               Euronext Paris
 Denominations         €100,000 + €100,000

 Use of Proceeds       2020 senior notes refinancing and General Corporate Purposes

                       EUR 525m 4.500% bonds due 6 November 2020 (ISIN: FR0011615699) of which
 Targeted bonds
                       460.1m is outstanding
 Tender Price          104.500%
 Offer period          4 November - 12 November 4pm CET
                       tendering bondholders must contact the dealer managers to request an allocation
 Priority allocation
                       code to receive priority allocation in the new issue

52
Committed to women and men             Committed to our planet

                                A socially responsible, committed
                                and contributive corporate citizen

A responsible economic player
Appendix – Business Model and Strategy
Industrial setup in France, global reach

                                                                                  12 industrial
                                                                                 sites in France

                                                                                    4 000
                                                                                   employees

           14           9 sales points                          4 distribution
           industrial   (commercial presence in 42 countries)   centers
           sites
55
Lithium main growth drivers: energy storage, including
                      Li-on EV battery

                                                                                                                                    Key features
                                                          1
                                                                                                                      Energy storage market: mainly driven by
                                           Li rich brine extraction from                                              environmental regulations, EV sales and mobility
                                                                                                                      development
Eramet’s activities

                                                       salar…
                                                                                                                      Lithium carbonate and lithium hydroxide enter the
                                                                                                                      composition of the Li-ion batteries’ cathodes

                                            2                                                                         Forecast Li-ion battery market in 2025: c. 75%1 of
                                                                                                                      total demand for lithium, vs 50% in 2018
                                      …in order to
                                       produce Li                                   3
                                                                                                                      Lithium market’s estimated annual growth rate: at a
                                      carbonate…
                                                                              …or transform                           minimum of 14% over the 2018-2025 period1
                                                                               into Lithium
                                                                              Hydroxide…
                                                        51%
                                                                       25%    Glass&
                                                                                                                               Potential customers
                                                                              Ceramics
                                                               4
                                  Energy
Clients’ activities

                                  storage            …to satisfy mainly the
                           in the form of           Energy Storage demand 6%
                           lithium-ion                                         Greases
                           batteries for
                           portable electronics,
                                                                     18%
                           electric vehicles and the
                                                                        Others
                           storage of electricity
                           on transport networks

                      56                                                                 1 Source: Market studies, Eramet
A booming lithium market over the next years

 FORECAST LITHIUM DEMAND1 (IN KT LCE)
                                                                                                                                       603
                                                                                                                                       22%
     Others
     Others Batteries                                                                                                                  30%
     EV Batteries
                                                                                  230
                            102                                                   49%
                                                                                                                                       48%
                                57%                                                  34%
                          43%                                                  17%
                           2010                                                  2018                                                 2025e

                                      20181                                                                                   2025
                                                                                                         Consumer
         Consumer                                                                                                                       Glass
                                                                                                       & electronics
       & electronics                                                                                                   11%            11%
                                                          Glass                                                                                     Greases
                                                                                                Mass energy
                      22%                           25%                                                                                        3%
                                                                                                    storage
                                                                                                               8%                                        Others
                          Energy                                                                                                                    8%
                                                                                                   E-bike 2%                          Others
                          storage
Mass energy                                                                                                                     22%
    storage 4%                    51% 49%                                                        Electric 8%
                                                                                                                              78%
     E-bike 1%                                             6% Greases                             buses
                                              Others                                                                Energy
     Electric 6%                                                                                                    storage
      buses
                                                   18%
                            17%                                                                                                                     Electric
               Electric                              Others                                                                          48%            vehicles
              vehicles
57                                             12018 Registration Document
                                               Source: Eramet and Market consulting estimates
Appendix - Financials
Sensitivities in H1 2019

      SENSITIVITIES              CHANGE (+/-)   ANNUAL IMPACT ON COI (+/-)

      Manganese ore prices        +$1/dmtu               ~€130m
      Manganese alloys’ prices     +$100/t               ~€70m
      Nickel prices                 +$1/lb               ~€100m
      Exchange rates               +$/€0.1               ~€105m
      Oil price per barrel        +$10/bbl              ~€(16)m

59
Group income statement

 €m                                              H1 2019   H1 2018
Sales                                             1,809     1,813
EBITDA                                            307       432
                                       % Sales    17%       24%
Current operating income                          169       294
                                       % Sales     9%       15%

Other operating income and expense                (25)       (1)
Operating income                                  144       293
Financial result                                  (54)      (51)
Pre-tax income                                     90       242
Share of income of equity affiliates               (4)       (0)
Income tax                                        (101)     (103)
Net income                                        (16)      139
Minority interests                                 21        45
Net income – Group share                          (37)       94

60
Cash-flow table
 €m                                                                                   H1 2019            H1 2018             FY 2018
Operating activities
EBITDA                                                                                    307                 432                   843
Cash impact on items under EBITDA                                                        (142)              (160)               (345)
Cash from operating activities                                                            165                 272                   498
Change in WCR                                                                            (172)               (99)                   (49)
Net cash generated by operating activities (1)                                             (7)                173                   449
Investment activities
CAPEX                                                                                    (131)              (112)               (281)
Other investment flows                                                                    (27)               (19)               (379)
Net cash from investment activities (2)                                                  (150)              (131)               (660)
Free Cash Flow (1) + (2)                                                                 (165)                 42               (211)
Cash from equity operations                                                               (45)              (122)               (123)
Impact of changes in exchange rates and in accounting methods                              (1)                7                  (7)
(Increase) / Reduction in net debt                                                       (211)               (73)               (341)
(Net debt) at start of period                                                            (717)              (376)               (376)
                            1
IFRS 16 impact (non cash)                                                                 (94)                  -                    -
(Adjusted net debt) at start of period                                                   (811)                  -                    -
(Net debt) at close of period                                                          (1,022)              (449)               (717)

61                                                    1   1st application of IFRS 16 accounting principle as of January 1st, 2019
Group Balance Sheet at 30 June, 2019

                        3,956                                                   3,956
       3,646                                              3,646

                                                                                1,547
                                                           1,605

                         3,106
                                                                                 289
       3,030
                                                           303
                                                                                1,081
                                                           995
                                                                                  17
                                                            26
                          850                                                   1,022
        616                                                717

     31/12/2018       30/06/2019                       31/12/2018             30/06/2019

       Fixed assets    Equity-Group share   Provisions and net deferred tax     Net debt
       WCR             Minority interests   Financial instruments

62
Reconciliation Group reporting and published accounts

                                             Half Year                             Half year           Half Year                Half year
                                                        Joint-venture                                             Joint-venture
 €m                                            2019
                                                         contribution
                                                                                     2019                2018
                                                                                                                   contribution
                                                                                                                                  2018
                                             Published1                            Reporting           Published1               Reporting2

 Sales                                         1,809                 -                1,809                1,735                  78        1,813

 EBITDA                                         307                   -                307                   415                  17        432

 Current operating income                       169                   -                169                   285                   8        294

Operating income                                144                   -                144                   223                  69        293

Net income for the period - Group share        (37)                   -                (37)                   94                   -         94

Net cash generated by operating activities      (7)                 (0)                 (7)                  167                   6        173

Industrial investments                          131                   -                131                   110                   2        112

(Net financial debt)                          (1,022)                 0             (1,022)                 (501)                 52        (449)

Shareholders' equity                           1,836                  0               1,836                1,971                   1        1,972

Shareholders' equity - Group share             1,547                (0)               1,547                1,697                   2        1,699

                                                       1 Financial statements prepared under applicable IFRS, in which joint ventures are
                                                       accounted for using equity method.
                                                       2 Group reporting, in which joint ventures are accounted for using proportionate

63                                                     consolidation
You can also read