THE PREDICTIVE MODELING OF THE FINANCIAL RISK OF CRYPTOCURRENCIES
←
→
Page content transcription
If your browser does not render page correctly, please read the page content below
International Journal of Economics, Business and Management Research

                                                                                Vol. 5, No.06; 2021

                                                                                 ISSN: 2456-7760

      THE PREDICTIVE MODELING OF THE FINANCIAL RISK OF
                     CRYPTOCURRENCIES
                            Mădălina CUC1, Florentina-Raluca BÎLCAN2
                        1
                            Mihai Viteazul National Intelligence Academy,
                             20-22, Odăii, București, 075100, Romania
                                 2
                                     Valahia University of Targoviste,
                                 2
                                     Carol I Bvd, Targoviste, 130024, Romania

Abstract
As the bitcoin community has grown rapidly, volatility is the only parameter that determines the
price of a bitcoin and is not directly observable on the market. In this research, we apply a model
of intelligent agent-based system to predict the trading price of bitcoins using data from listed
cryptocurrencies like bitcoins on the CoinMarketCap. The main contribution of this paper is to
show empirically that the price prediction model for bitcoins based on neural networks and the
volatility prediction model based on technical analysis, form a decision support subsystem. The
positive aspects of decentralization, anonymity, transparency, transaction speed and low costs,
clearly show why Bitcoin is becoming more popular and future plans include generating similar
bridges for other blockchains, such as Tron, EOS or Binance Chain.

Keywords: Cryptocurrencies; Bitcoin; Volatility; Artificial Neural Networks; Intelligent
Systems; Exchange Risks

1. Introduction
Simultaneously with the arrival of the pandemic in Europe and the restrictions it brought, the
cryptocurrency market - led by bitcoin - began to grow in March 2020 and did not stop until the
first days of January, when it reached an all-time high. of $ 41,962 (CoinMarketCap 2021). With
a wave of new money entering the market, the debates around cryptocurrencies have rekindled,
and the role of bitcoin is once again under scrutiny, as well as the financial education of those
who adhere to this phenomenon (Conlon et al. 2020; Bons et al. 2020). With analysts projecting
more than $ 700 Bln on Bitcoin by the end of 2021, financial institutions are gradually building
their own encryption portfolios (CoinMarketCap 2021).
In this world of cryptocurrencies, bitcoin acts as a gold standard (Baek and Elbeck 2015; Marella
et al. 2020; Bouri et al. 2020; Yermack 2015). Cryptocurrency can also be used for currency
speculation, the value of a Bitcoin fluctuating at least as much on digital currency exchanges,
which claims the need for predictability of trading prices (Dyhrberg et al. 2018; Ma et al. 2018;
Mikhaylov 2020; Arias-Oliva et al. 2021; Tasca et al. 2018). This implies that the Bitcoin
community must be prepared to protect the system from several illicit activities on market (Park
and Jun 2020; Roper et al. 2011; Syed et al. 2019).
The emergence of the blockchain technology that underlies bitcoin has transformed many aspects
in a positive way because it allows secure transactions, greater efficiency and can reduce the
www.ijebmr.com                                                                             Page 71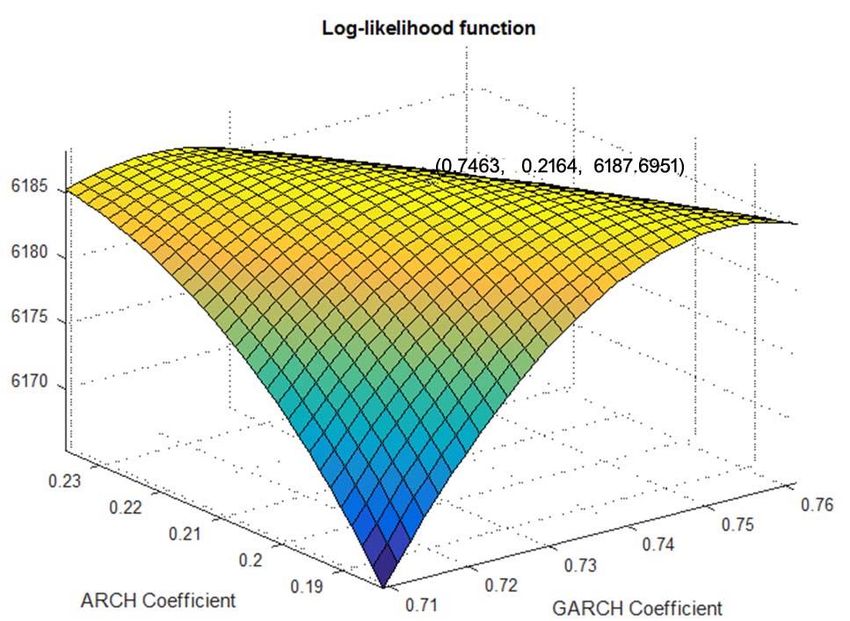
International Journal of Economics, Business and Management Research

                                                                               Vol. 5, No.06; 2021

                                                                                 ISSN: 2456-7760

need for intermediaries (Sladić et al. 2021; Alt 2020; Ali et al. 2020). Although technology offers
many advantages and solves many problems, it cannot solve all problems. In other words,
blockchain technology is the beginning of a new digital age, an era that can solve many of the
problems we face or an era that can take us even further away from normalcy.
At the same time, in the case of cybercriminals, the modes of operation have diversified with
their improvement and the identification of new methods of fraud (Brauneis and Mestel 2018;
Ghabri et al. 2020; Jha and Baur 2020). Cloning of official websites where cryptocurrencies are
traded as a way to counterfeit electronic money and deceive by forcing its users to transfer
money is becoming more common. Thus, as long as the problems of credibility and the inflation
rate are eliminated, the specialized studies present arguments regarding the possibility that
Bitcoin can coexist as a modern payment method but with huge monitoring costs due to the size
of the data (Martinazzi et al. 2020; Hoang et al. 2020).
In this context, every transaction that takes place in the Bitcoin network is registered in the
blockchain, there is an increasing need to take important steps towards creating models to predict
the price of cryptocurrencies quota and values using computational intelligence methods (Nasir
et al. 2019; Conrad 2018; Chuen 2015). In practical applications, this parameter must be
estimated given that the evolution of the price of the underlying asset is assimilated to a certain
distribution (Balcilar et al. 2017; Lischke and Fabian 2016; Kroll et al. 2013; Chan et al. 2019).
Moreover, empirical studies that took into account the evolution of the dispersion of the price of
underlying assets between two consecutive closures and between the close before the weekend
and the first trading day following this period led to the conclusion that much volatility is the
result of the trading process (Trucíos 2019; Hamid 2015; Wang 2003).
The tendency of volatility to return to a long-term characteristic value contained in the above
model may be one of the explanations for the maturity dependence of the default volatility
(Wang 2003; Palos-Sanchez et al. 2021; Sun et al. 2018; Livieris et al. 2021). However, an
important result for options theory refers to the way in which the probability distribution can be
transformed into a more convenient one, which eliminates the risk associated with a bitcoin,
leaving the structure of volatility intact (Yang et al. 2020; Dodd and Gilbert 2016). Meanwhile,
according with Conrad et al. (2018) in the study of financial time series are used the
ARCH/GARCH models. Furthermore, the level of risk exposure of each company must
incorporate its own assessment of the losses they may incur in the event of unfavorable market
developments (Sun et al. 2018; Dodd and Gilbert 2016). Trading models and techniques must be
seen as tools that can provide an informed manager with useful insights, so they are
indispensable in an increasingly integrated and sophisticated market (Wang 2003; Dodd and
Gilbert 2016; Cernazanu 2008; Cebrián-Hernández and Jiménez-Rodríguez 2021).
Based on previous research, the objective of this study is to create a subsystem of decision
assistance on the trading segment of bitcoins based on classical technical analysis, supplemented
with mechanisms for identifying, collecting, structuring and updating data, with mechanisms for
analyzing the main indicators related to price and volatility (Cuc 2017). As a result, each trading
of bitcoins signal is automatically analyzed for profitability. This analysis simulates the trading
signal using the real price of Bitcoin time series. According with the results, this simulated

www.ijebmr.com                                                                             Page 72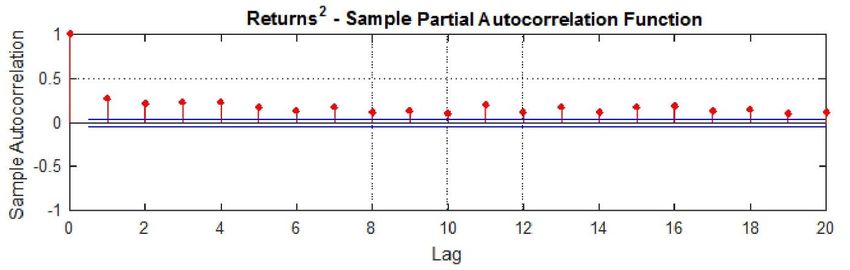
International Journal of Economics, Business and Management Research

                                                                               Vol. 5, No.06; 2021

                                                                                  ISSN: 2456-7760

trading makes an analysis of the manner in which each transaction is done both based on trading
or on one-day aggregation.
From a practical perspective, the topicality of the present research study is due to the continuous
evolution of the techniques by which coins are protected, but by which they can also be
counterfeited – there is some research on blockchain-enabled and blockchain-induced
applications in cryptocurrency trading. Another reason would be the need to implement a unitary
package of elements so that the person handling the banknote is able to compare authenticity in
real time and specially to know these elements in advance.
The remainder of the paper is organized as follows: Section 2 presents a brief literature reviews
regarding the agent-based system implementation for the minimization of the trading risk.
Section 3 provides the theoretical model followed by the illustration of estimation methodology.
Section 4 analyses the empirical results and discussions implications. Section 5 drives
conclusions.

2. Theoretical background
As already presented in the literature, volatility is often used to quantify the risk of a
cryptocurrency in a given period of time and represents the variation (or, alternatively, the
standard deviation) of the instrument value’s alteration in this time horizon (Livieris et al. 2021;
Bordini et al. 2006; Tse and Tsui, 2002; Fernández-Villaverde and Sanches 2018). Therefore,
volatility modelling and prediction become an important task on markets, being motivated by the
desire to minimize the trading risk.
As a measure of minimizing the incertitude, volatility becomes a key issue for any investment
decision and portfolio management, as well as for the risk evaluation, for the bitcoins’ pricing,
for the derived securities and options’ pricing (Gao et al. 2016; Haykin 2009; Riganti et al. 2012;
Sarma 2009; Georgescu 2011). Certain types of cryptocurrencies commonly show high and low
volatility periods (the so-called volatility clustering). During these periods of time the price
variations are very frequent and they have a high amplitude (an extreme case is a market incident
– or market bubble), while during other periods they might seem to have a low amplitude for a
longer period of time (Georgescu 2011; Arias-Oliva et al. 2021; Brauneis and Mestel 2018; Nasir
et al. 2019; Livieris et al. 2021). The extremely volatile markets can be exploited for speculative
trading actions and represent good but risky opportunities for gains (Georgescu 2011; Gao et. al.
2016; Weigend 2018).
Numerous studies found volatility is extremely important in the bitcoins’ pricing (Hamid 2015;
Dodd and Gilbert 2016). According to most of the theories referring to the bitcoin’s pricing, the
risk premium is determined by the conditioned covariance between the asset’s future returns and
one or more reference portfolios (e.g. market portfolio or consumption growth rate). Investors
and portfolio managers have certain risk levels that they can bear (Georgescu 2011; Hamid 2015;
Gao et al. 2016).
Trucíos (2019) and Hamid (2015) believe that a good prognosis of the bitcoin’s prices volatility
during the investments holding period is a good starting point for evaluating the investments risk,
but the high scale failures of the risk evaluation are very hazardous and may generate financial
crises. Thus, the accuracy of volatility prediction is essential in pricing the derivative
www.ijebmr.com                                                                              Page 73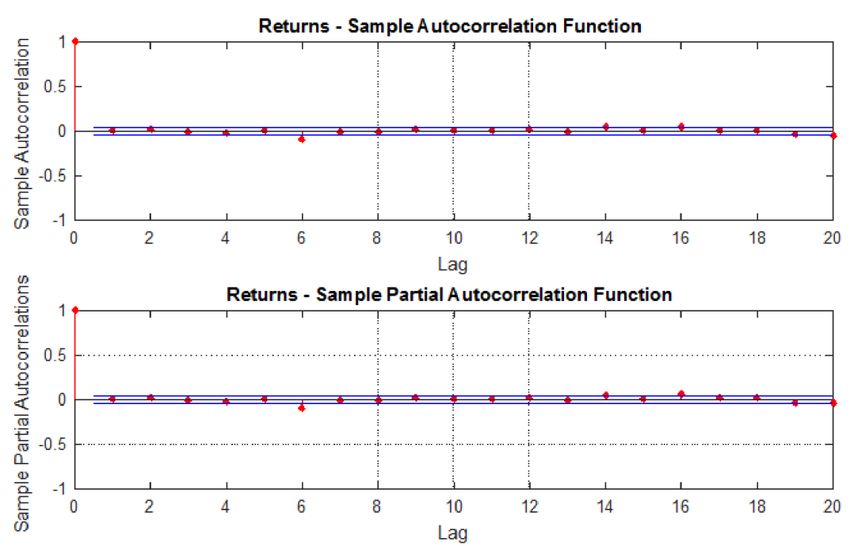
International Journal of Economics, Business and Management Research

                                                                               Vol. 5, No.06; 2021

                                                                                  ISSN: 2456-7760

instruments, where the uncertainty associated with the future price of the bitcoin a major factor
for the prices of the derivative instruments (Georgescu 2011). Actually, this makes possible the
direct trading of the volatility, by using the derivative instruments such as the options, whose
trading volume has increased four times in only a few years before the latest financial crisis
(Yang et al. 2020).
Other authors found that, in order to establish an option’s price, the volatility of the basic asset
until the options expiration needs to be known (Conrad et al. 2018; Cebrián-Hernández and
Jiménez-Rodríguez 2021). As a matter of fact, the market convention is to express the options’
prices in volatility units, favoring a clear specification of the volatility’s quantification in the
contracts containing derivative instruments, provided that the predictions are highly accurate
(Georgescu 2011). Nevertheless, volatility is not the same thing as the risk, being defined as an
information vehicle which can be exploited for speculative trading. The traders can make high
gains through volatile markets, in case of a short time entering with peak prices selling and low
prices buying, in which situation the gains are proportional to the volatility, provided the
prediction is as accurate as possible. Various models are applied on the developed markets
volatility estimation, but risk portfolio management of investments has led to the need to try to
model it using intelligent agents (Cernazanu 2008; Bordini et al. 2006; Haykin 2009).
Note that the critical module of agent has a performance standard usually implemented in the
design stage that enables the evaluation of the action’s results depending on the purpose,
determining the knowledge to be provided to the learning module. If the performance standard is
not set, the agent will adjust it for its behavior improvement. The agent’s behavior can be
improved by learning. Learning can be: supervised, unsupervised, reinforcement, online, offline,
centralized and decentralized. The agent’s knowledge base is updated following the learning
process (Riganti et al. 2012; Sarma 2009; Patel et al. 2020).
Other studies focused on the most largely spread neural networks of the feed-forward type and
which proved to be real functions universal approximates are the multilayer perceptron (MLP),
having one or more hidden layers (Dodd and Gilbert 2016; Demuth et al. 2014; Alberola et al.
2013, Cuc 2017).
Supporting this view, the genetic algorithms can be combined with neural networks in order to
improve their performance by finding the optimal parameters or in order to be used in the post
processing optimization stage (Tse and Tsui 2002; Weigend 2018; Cuc 2017). The network must
be trained without regularization, because it will increase the error. This causes predictors to
remain stable and generally give rise to more robust models.
According to Haykin (2009), the main characteristics of a neural network are: nonlinearity,
adaptability and parallelism. To define a neural network, we must define a structure and a rule of
learning. On the other hand, the reason why the forecasting capacity of a network is affected by
the series trend emerges immediately from the need to normalize the network inputs
(Montgomery et al. 2015). However, the usefulness of a neural model lies primarily in its
consistency, even if its performance is not so good. Constantly looking for the simplest model to
represent a series of time as efficiently as possible, it is finally necessary to reach a balance
between complexity and accuracy.

www.ijebmr.com                                                                              Page 74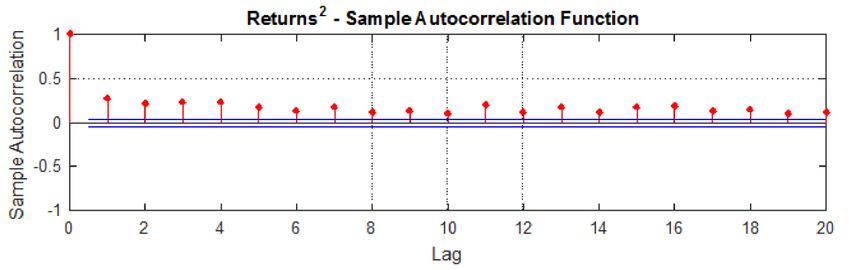
International Journal of Economics, Business and Management Research
Vol. 5, No.06; 2021
ISSN: 2456-7760
Even so, multi-agent systems are systems consisting of groups of agents acting for the
achievement of a common purpose. In order to do this, the agents making up a system of agents
interact and work together for the achievement of the common task. As a rule, multi-agent
systems are involved in solving specific problems with a very high complexity in order to be
solved by only one agent.
3. Research methodology
Data used were extracted for listed cryptocurrencies like bitcoins on the CoinMarketCap (2020)
and the analysis interval comprises a period between 2017 and 2020, with an aggregate of 1460
recordings for the data series of the variable – daily closing price.
Figure 1. Daily price of Bitcoin (BTC) from 1 January 2017 to 31 December 2020.
From the analyzed data one notices that is present the volatility clustering phenomenon (the
periods of high and low volatility are persistent; the periods of volatility calmness and turbulence
tend to group together); bitcoin daily average returns is equal to the yearly returns divided to the
number of trading days; the daily returns distribution is leptokurtic (fat tail) and bitcoin returns
display a certain asymmetry.
According to previous studies (Georgescu 2011, Cuc 2017), the optimal model is from the
ARMAn, m / GARCH p, q class, which highlights the two main features of the returns series:
leptokurtic distribution and volatility clustering.
www.ijebmr.com Page 75International Journal of Economics, Business and Management Research
Vol. 5, No.06; 2021
ISSN: 2456-7760
Figure 2 – Daily returns of Bitcoin (BTC) from 1 January 2017 to 31 December 2020
From the relation:
P
rt lnPt lnPt 1 ln t E (rt ) (1)
Pt 1 ,
that could depend of past information
I t 1 rt 1 , rt 2 ,..., data from previous observations rt 1 , rt 2 , previous exogenous vectors
or variables xt 1 , xt 2 , or previous innovations t 1 , t 2 , provides the characterization
given by ARMAn, m for average daily returns
n m
rt ai rt i t m j t j (2)
i 1 j 1
,
If the relation (1) is independent of the set of information from the past
I t 1 rt 1 , rt 2 ,... ,
the reductions rt t rt t or, take place
where t t et represent the innovations of the average returns series of and they completely
characterize the volatility clustering phenomenon.
www.ijebmr.com Page 76International Journal of Economics, Business and Management Research
Vol. 5, No.06; 2021
ISSN: 2456-7760
The returns volatility will be modelled by a GARCH p, q model:
p q
k Gi
t
2 2
t i Aj t2 j (3)
i 1 j 1 ,
A generation mechanism for innovations { t } t t et is
where t2 Var[ t I t 1 ] E[ t I t 1 ] is the variance conditioned by the innovations t and
2
rt where et t / t define the standardized innovations, i.e et ~ i.i.d .N (0,1) .
The restrictions imposed to the conditioned variance parameters are:
p q
(i): G j Ai 1 (stationarity) (4)
j 1 i 1
(ii): k 0 , G j 0 , j 1, , p ; Ai 0 , i 0, 1, , q (nonegativity).
The next step is testing data series for underlying volatility clustering and GARCH effect. The
test is based on the local equivalence between GARCH p, q and ARCH p q models and
analyzes the null hypothesis:
The residual series { t } does not have conditional heteroscedasticity as against the alternative
that the model ARCH L :
ˆt2 0 1 ˆt21 L ˆt2L t , (5)
describes the series having at least k 0, k 0, L .
Afterwards, we will use the maximum probability calculation (ML) to estimate the returns mean
and their volatility.
ARMA (0,0): rt t , unde t t et și et ~ i.i.d .N (0,1)
k
GARCH (1, 1): t2 k G1 t21 A1 t21 , where initial iteration is 12 ,
1 G1 A1
We define Log-probability notion of rt as equal to Log-density of rt and we calculate
LLF rt , k , G1 , A1 , after the resulted formula:
1 (rt ) 2
n
LLF rt , k , G1 , A1 , log exp , where 2 k
(6)
2
2 t 1 G1 A1
2 1
t 1
For calculated parameters k , G1 , A1 , we calculate
1 (rt ) 2
n
max LLF rt , k , G1 , A1 , max log exp
k ,G1 , A1 , 2
t 1 2 2 t
www.ijebmr.com Page 77International Journal of Economics, Business and Management Research
Vol. 5, No.06; 2021
ISSN: 2456-7760
This maximum is reached at the maximum point G1max , A1max and the maximum value is
LLF rt , k , G1max , A1max ,
Controllability of volatility risk for financial assets followed by the underlying asset starts from
the observation that the price change follows a continuous process, the result generated being
distributed normally.
4. Results and Discussion
Following the proposed model and data presented above, the Figure 1 and 2 shows the
implications of the clustered volatilities can be quantitatively characterized by the
autocorrelation functions (ACF) and the partial autocorrelation functions for returns rt samples
from Figure 3 as well as for rt2 in Figure 4
Figure 3. Graph of the observed returns rt sample (Lag =1 - 20) correlation.
www.ijebmr.com Page 78International Journal of Economics, Business and Management Research
Vol. 5, No.06; 2021
ISSN: 2456-7760
Figure 4. Graph of the observed squared returns rt2 sample (Lag =1 - 20) correlation.
A first conclusion that can be drawn is that the returns are mostly uncorrelated in the level, but
squared correlated. Both correlation functions were calculated up to a K 20 disparity and show
a typical behaviour: while autocorrelation is low in the basic returns’ series, the volatility series
(squared returns) show the persistency corresponding to a high autocorrelation level, long-term
time scale.
For the bitcoin data series analyzed, we testing ( K 20 ):
H 0 : 1 ... 20 0
H1 : j 0 ( j 1,2..., K )
For L = 2, N=1640, T=1638 and GARCH (1,1) we will have: R2 = 0.12637, LP = (T-L) ·R2 =
(1640-2) 0.12637 = 206.9941 > χ202 (2) = 31.41 and 5% level = 6.1023, so we will reject
hypothesis H0 for the 5% level.
The conclusion of the test is that the returns series meant shows clustered volatility, previously
determined, as well as the GARCH effect. Further using the calculation of the maximum
probability (ML) to estimate the average yields and their volatility we obtain the results
presented in Table 1.
www.ijebmr.com Page 79International Journal of Economics, Business and Management Research
Vol. 5, No.06; 2021
ISSN: 2456-7760
Table 1. The results of estimates of average returns and their volatility.
Parameter Estimation Standard error t statistics
k 0.0000769 0.0002534 8.8883500
G1 0.7463166 0.0117543 67.6353500
A1 0.2164427 0.0122587 17.8829500
0.0003483 0.0002998 1.13233610
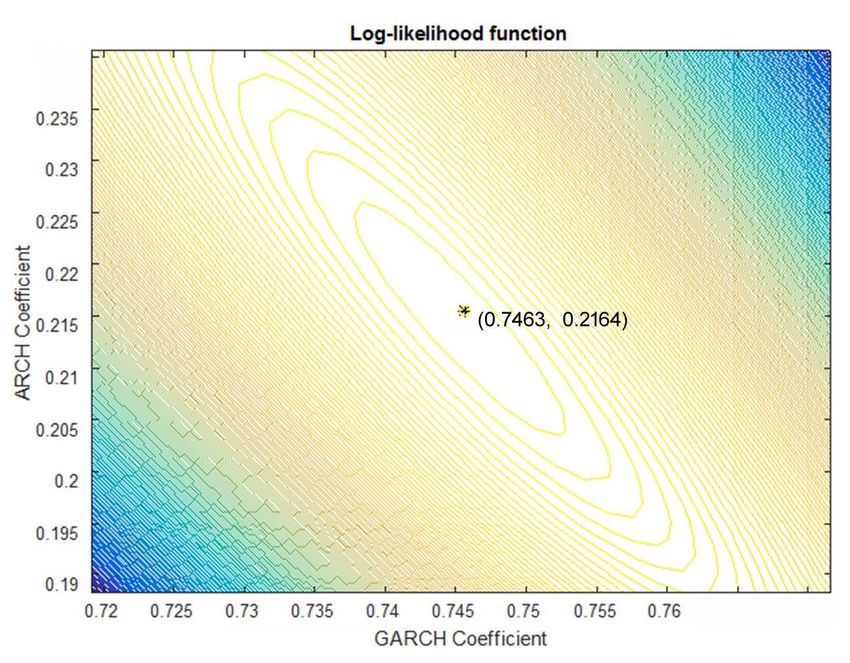
Moreover, Figure 5 representing this maximum for the data series corresponding to bitcoin.
Figure 5. Graph of observed the maximum point G1max , A1max
We notice that G1max , A1max 0.7463, 0.2164 , and the maximum value reached in this point is
LLF rt , k , G1max , A1max , 6187. 6951 (Figure 6).
www.ijebmr.com Page 80International Journal of Economics, Business and Management Research
Vol. 5, No.06; 2021
ISSN: 2456-7760
Figure 3. Graph of observed the maximum value for LLF rt , k , G1max , A1max , 6187.6951
The unconditioned variance of innovations t will be given by:
ˆ 2 vâr t
k
0.0020615 (7)
1 G1max A1max ,
Correlating this with the fact that G1max A1max 0.9627 the conclusion is that volatility is
strongly persistent for bitcoin.
The advantages of using normal distribution to control the risks of bitcoin volatility in this model
are obvious. Basically, the complete distribution of the price of the underlying bitcoin and of the
probabilities of achieving the values generated can be generated depending on the average price
change and their standard deviation. In addition, the use of lognormal distribution has the
advantage that a variable thus distributed can only take positive values, a realistic assumption in
the case of the price of bitcoin.
On top of that, used in the training process for error monitoring, the validation data tables will be
processed to generate the learning stopping decision so as to avoid overfitting. The error
associated to the subset containing the training data decreases during the initial epoch,
simultaneously with the error reduction from the validation data set. The error reduction from the
validation data set starts vanishing and is subsequently followed by the trend’s reverse at the
moment when the network starts overfitting.
www.ijebmr.com Page 81International Journal of Economics, Business and Management Research
Vol. 5, No.06; 2021
ISSN: 2456-7760
When the validation data error increases for a limited iterations interval, the training is stopped
and the resulted weights are considered optimal, thus obtaining the optimum model in relation to
the error established by the upper layer. In fact, the error for the testing data set provides an
enough good estimation of the generalized error, being used, for this reason, to compare various
models.
In the light of the results of this study, the fact that Blockchain technology is not a valid
universal “remedy” must be taken into account, because it still has a long way to go until it is
fully integrated into every business process. However, it is worth considering the benefit of a
debate on the practical and legal implications of Blockchain technology in major organizations
around the world. As an extension of this study, the following question remains: how might the
use of prediction models influence future transactions?
5. Conclusions
One important and extremely present phenomenon of our current world is called bitcoin and it is
a decentralized electronic payment system and digital currency cryptocurrency, created to ensure
investment protection and free financing of business without resorting to financial institutions,
outside any constraints and regulations. An advantage that the bitcoin gives to the system is
considered to be the fact that at some point, out of the extremely complex monetary circuit, all
types of currency would disappear and also it is possible that counterfeit currency would become
a thing of the past as well.
The development of the financial environment generates higher and more expensive risks in
terms of coverage. According to the present survey, subjects involved in the use of risk
assessment techniques by analyzing prices and volatility can ensure a more realistic perception
of the value of a bitcoin. In view of obtaining the models which were encapsulated in the
prediction agents, the parsimony principle was considered, according to which a model has to
include what is required for modelling, and nothing more. The violation of this principle results
in excessive adjustment of a model, a phenomenon called overfitting. This models are either too
flexible or excessively complex, with a disproportionate number of parameters in relation to the
number of processed parameters and to the number of analyzed observations.
Along the same line of thinking, it should be noted when training the neural networks, we have
envisaged to obtain a model with optimal generalization performances. However, one has to take
into account that a standard architecture neural network of multilayer perceptron type is
overfitting-prone. In order to counteract this native tendency, we have applied the early stopping
of the training process. The early stopping process implies data splitting into three subsets:
training, validation and testing. The learning data used for training (gradient and network
weights) are the most consistent part of the available data.
This empirical analysis also highlights that the agent built by the encapsulation of model will be
an intelligent one because it trains daily, resulting, at the end of the day, in a new agent version
for each issuer it will train for. As results shown, the model chosen to make the prediction must
meet the principle of parsimony, the cost of resources allocated for running neural networks with
many neurons and many layers, as well as the large number of training epochs, not desirable,
www.ijebmr.com Page 82International Journal of Economics, Business and Management Research
Vol. 5, No.06; 2021
ISSN: 2456-7760
relative to the goal model, to have a small error to perform transactions or to ensure a price alert
for the predicted values.
At the end of each trading day, the specific predictive model is generated and included in the
agent that will use the model in order to make predictions for the next trading day. The model
thus generated recreates itself daily, by self-training with the current day’s data. In off line, the
coordinating agent assumes the updating data of the predictive and intelligent models through the
interface agent and transfers them to the suitable agents so as to be used during the next trading
session.
The partial derivative equation included in modelling and predicting the volatility of bitcoin
prices using intelligent agent systems, used in the evaluation of options can also be obtained by
an alternative technique, which involves building a portfolio consisting of risk-free fixed income
shares, options and securities that do not require an initial investment or additional funds during
the life of the option.
Finally, another natural development direction will be the computing power scaling for
distributed systems in BIG DATA environment, specific to neural networks, alongside the
creation of models proper to each activity sector. The scaling thus achieved would enable the
increase of profitability for all issuers on the exchange market, to which the state is a holder,
beside an efficient and effective control of their trading processes.
References
Alberola, J.M., Such, J.M., Botti, V., Espinosa, A., Garcia-Fornes, A. 2013. A Scalable Multi-
agent Platform for Large Systems, Computer Science and Information Systems. Inform
Syst. 10, 51–77.
Ali, O. Ally, M. Clutterbuck, & Dwivedi, Y. (2020). The state of play of blockchain technology
in the financial services sector: A systematic literature review. Int. J. Inf. Manag. 54, 102-
199.
Alt, R. (2020). Electronic Markets on blockchain markets. Electron Markets. 30, 181–188.
https://doi.org/10.1007/s12525-020-00428-1
Arias-Oliva, M. de Andrés-Sánchez, J., & Pelegrín-Borondo, J. (2021). Fuzzy Set Qualitative
Comparative Analysis of Factors Influencing the Use of Cryptocurrencies in Spanish
Households. Mathematics 9, 324. https://doi.org/10.3390/math9040324
Baek, C., Elbeck, M. (2015). Bitcoins as an investment or speculative vehicle? A first look. Appl.
Econ. Lett. 22, 30–34.
Balcilar, M., Bouri, E., Gupta, R., & Roubaud, D. (2017). Can volume predict Bitcoin returns
and volatility? A quantiles-based approach. Econ. Model. 64, 74–81.
Bons, R. W., Versendaal, J., Zavolokina, L. et al. (2020). Potential and limits of Blockchain
technology for networked businesses. Electron Markets 30, 189–194.
https://doi.org/10.1007/s12525-020-00421-8
www.ijebmr.com Page 83International Journal of Economics, Business and Management Research
Vol. 5, No.06; 2021
ISSN: 2456-7760
Bordini, R.H., Braubach, L., Dastani, M., Seghrouchni, A.E.F., Gomez-Sanz, J. J., Leite, J.,
O’Hare, G., Pokahr, A., & Ricci, A. (2006). A Survey of Programming Languages and
Platforms for Multi-Agent Systems. Informatica. 30(1), 3–44.
Bouri, E., Shahzad, S. J .H., Roubaud, D., Kristoufek, L., & Lucey, B. (2020). Bitcoin, gold, and
commodities as safe havens for stocks: New insight through wavelet analysis. Q. Rev.
Econ. Financ. 77, 156–164.
Brauneis, A., & Mestel, R. (2018). Price discovery of cryptocurrencies: Bitcoin and beyond.
Econ. Lett. 165, 58–61.
Cebrián-Hernández, Á., & Jiménez-Rodríguez, E. (2021). Modeling of the Bitcoin Volatility
through Key Financial Environment Variables: An Application of Conditional
Correlation MGARCH Models. Mathematics, 9, 267.
https://doi.org/10.3390/math9030267
Cernazanu, C. (2008). Training Neural Networks Using Input Data Characteristics. Adv Electr
Comput En. 8(2), 5-70.
Chan, W. H., Le, M., & Wu, Y. W. (2019). Holding Bitcoin longer: The dynamic hedging
abilities of Bitcoin. Q. Rev. Econ. Financ. 71, 107–113.
Chuen, D. L. K. (2015). Handbook of Digital Currency: Bitcoin, Innovation, Financial
Instruments, and Big Data. Elsevier: Waltham, MA, USA.
CoinMarketCap. from https://coinmarketcap.com (accessed 22 January 2021)
Conlon, T., Corbet, S., & McGee, R. J. (2020). Are cryptocurrencies a safe haven for equity
markets? An international perspective from the COVID-19 pandemic. Res. Int. Bus.
Financ. 54, 101248.
Conrad, C., Custovic, A., & Ghysels, E. (2018). Long- and Short-Term Cryptocurrency
Volatility Components: A GARCH-MIDAS Analysis. J. Risk Financ. Manag. 11, 23.
Cuc, M., (2017). Improving the managerial decision at the level of open companies by real-time
predictive modeling, PhD Thesis University of Valahia.
Demuth, H. B., Beale, M. H., De Jess, O., & Hagan, M. T. (2014). Neural Network Design.
Oklahoma State University: Stillwater, OK, USA.
Dodd, O., & Gilbert, A. (2016). The Impact of Cross-Listing on the Home Market’s Information
Environment and Stock Price Efficiency. Financial Review 51(3), 299–328.
Dyhrberg, A.H., Foley, S., & Svec, J. (2018). How investible is Bitcoin? Analyzing the liquidity
and transaction costs of Bitcoin markets. Econ. Lett. 171, 140–143.
Fernández-Villaverde, J., & Sanches, D. R. (2018). On the Economics of Digital Currencies.
Working Paper No. 18-7; Federal Reserve Bank of Philadelphia: Philadelphia, PA, USA.
Gao, J., Xiong, Y., & Li, D. (2016). Dynamic Mean-Risk Portfolio Selection with Multiple Risk
Measures in Continuous-Time. Eur J Oper Res 249(2), 647–656.
Georgescu, V., (2011). Dynamic Mean-Risk Portfolio Selection with Multiple Risk Measures in
Continuous-Time. Eur J Oper Res 249(2), 647–656.
www.ijebmr.com Page 84International Journal of Economics, Business and Management Research
Vol. 5, No.06; 2021
ISSN: 2456-7760
Ghabri, Y., Guesmi, K., & Zantour, A. (2020). Bitcoin and liquidity risk diversification. Financ.
Res. Lett. 101, 679.
Hamid, A. (2015). Prediction power of high-frequency based volatility measures: a model based
approach. Rev Manag Sci 9,549–576. https://doi.org/10.1007/s11846-014-0130-z
Haykin, S. (2009). Neural Networks and Learning Machines. Prentice Hall Publishing.
Hoang, K., Nguyen, C. C., Poch, K., & Nguyen, T. X. (2020). Does Bitcoin Hedge Commodity
Uncertainty? J. Risk Financial Manag. 13, 119. https://doi.org/10.3390/jrfm13060119
Jha, K. K., & Baur, D. G. (2020). Regime-Dependent Good and Bad Volatility of Bitcoin. J. Risk
Financial Manag. 13, 312. https://doi.org/10.3390/jrfm13120312
Kroll, J. A., Davey, I. C., & Felten, E. W. (2013). The economics of Bitcoin mining, or Bitcoin
in the presence of adversaries. In Proceedings of the WEIS, Washington, DC, USA, 11–
12 June 2013, p. 11.
Lischke, M., & Fabian, B. (2016). Analyzing the Bitcoin Network: The First Four Years. Futur.
Internet 8, 7, https://doi.org/10.3390/fi8010007
Livieris, I. E., Kiriakidou, N., Stavroyiannis, S., & Pintelas, P. (2021). An Advanced CNN-
LSTM Model for Cryptocurrency Forecasting. Electronics 10, 287.
https://doi.org/10.3390/electronics10030287
Ma, J., Gans, J. S., & Tourky, R. (2018). Market Structure in Bitcoin Mining; National Bureau of
Economic Research: Cambridge, MA, USA.
Marella, V., Upreti, B., Merikivi, J. et al., (2020). Understanding the creation of trust in
cryptocurrencies: the case of Bitcoin. Electron Markets 30, 259–271
https://doi.org/10.1007/s12525-019-00392-5.
Martinazzi, S., Regoli, D., & Flori, A., (2020). A Tale of Two Layers: The Mutual Relationship
between Bitcoin and Lightning Network. Risks 8, 129.
https://doi.org/10.3390/risks8040129
Mikhaylov, A. (2020). Cryptocurrency Market Analysis from the Open Innovation
Perspective. J. Open Innov. Technol. Mark. Complex. 6, 197.
https://doi.org/10.3390/joitmc6040197
Montgomery, D. C., Jennings, C. L., & Kulahci, M., (2015). Introduction to Time Series Analysis
and Forecasting. John Wiley & Sons: Hoboken, NJ, USA.
Nasir, M. A., Huynh, T. L. D., Nguyen, S. P., & Duong, D. (2019). Forecasting cryptocurrency
returns and volume using search engines. Financ. Innov. 5, 2.
https://doi.org/10.1186/s40854-018-0119-8
Palos-Sanchez, P., Saura, J. R., & Ayestaran, R. (2021). An Exploratory Approach to the
Adoption Process of Bitcoin by Business Executives. Mathematics 9, 355.
https://doi.org/10.3390/math9040355
Park, S., & Jun, S. (2020). Sustainable Technology Analysis of Blockchain Using Generalized
Additive Modeling. Sustainability. 12, 10501. https://doi.org/10.3390/su122410501
www.ijebmr.com Page 85International Journal of Economics, Business and Management Research
Vol. 5, No.06; 2021
ISSN: 2456-7760
Patel, M. M., Tanwar, S., Gupta, R., & Kumar, N. (2020). A Deep Learning-based
Cryptocurrency Price Prediction Scheme for Financial Institutions. J. Inf. Secur. Appl. 55,
102583.
Petrescu, M., Cuc, M., Oncioiu, I., Petrescu, A. -G Bîlcan, F. -R., & Petrescu, M. (2020). The
Design of an Agent-Based System for Capital Markets. Studies in Informatics and
Control 29(3), 93-306.
Riganti, F., Salvini, A., & Parodi, M. (2012). Learning Optimization of Neural Networks Used
for Memo Applications Based On Multivariate Functions Decomposition. Inverse Probl
Sci En. 20, 9-39.
Roper, A. T., Cunningham, S. W., Porter, A. L., Mason, T. W., Rossini, F. A., & Banks, J.
(2011). Forecasting and Management of Technology. John Wiley & Sons: Hoboken, NJ,
USA.
Sarma, K. K. (2009). Neural network based feature extraction for assumes character and
numeral recognition. Int. J. Artif. Intell. (2) S09, 37-56.
Sladić, G., Milosavljević, B., Nikolić, S., Sladić, D., & Radulović, A. (2021). A Blockchain
Solution for Securing Real Property Transactions: A Case Study for Serbia. ISPRS Int. J.
Geo-Inf. 10, 35. https://doi.org/10.3390/ijgi10010035
Sun, Y. F., Zhang, M. L., Chen, S., & Shi, X. H. (2018). A Financial Embedded Vector Model
and Its Applications to Time Series Forecasting. Int J Comput Commun. 13(5), 881-894.
Syed, T. A., Alzahrani, A., Jan, S., Siddiqui, M. S., Nadeem, A., & Alghamdi, T. (2019). A
Comparative Analysis of Blockchain Architecture and its Applications: Problems and
Recommendations. IEEE Access. 7, 176838–176869.
Tasca, P., Liu, S., & Hayes, A. (2018). The Evolution of the Bitcoin Economy: Extracting and
Analyzing the Network of Payment Relationships. SSRN Electron. J. 19, 94–126.
Trucíos, C. (2019). Forecasting Bitcoin risk measures: A robust approach. Int. J. Forecast. 35,
836–847.
Tse, Y. K., & Tsui, A. K. C. (2002). A multivariate generalized autoregressive conditional
heteroscedasticity model with time-varying correlations. J. Bus. Econ. Stat. 20, 351–362.
Wang, S. C. (2003). Artificial Neural Network. In: Interdisciplinary Computing in Java
Programming. The Springer International Series in Engineering and Computer Science.
Springer, Boston, MA.
Weigend, A. S. (2018). Time series prediction: forecasting the future and understanding the
past. Routledge, New York, ABD.
Yang, R., Yu, L., Zhao, Y., Yu, H., Xu, G., Wu, Y., & Liu, Z. (2020). Big data analytics for
financial Market volatility forecast based on support vector machine. Int. J. Inf. Manag.
50, 452–462.
Yermack, D. (2015). Is Bitcoin a Real Currency? An Economic Appraisal. In Handbook of
Digital Currency: Bitcoin, Innovation, Financial Instruments, and Big Data; Elsevier:
Amsterdam, The Netherlands, 2015; pp. 31–43.
www.ijebmr.com Page 86You can also read