Varying influence of phytoplankton biodiversity and stoichiometric plasticity on bulk particulate stoichiometry across ocean basins
←
→
Page content transcription
If your browser does not render page correctly, please read the page content below
ARTICLE
                  https://doi.org/10.1038/s43247-021-00212-9                 OPEN

                  Varying influence of phytoplankton biodiversity and
                  stoichiometric plasticity on bulk particulate
                  stoichiometry across ocean basins
                  Michael W. Lomas 1 ✉, Steven E. Baer                        2,   Celine Mouginot3, Kristina X. Terpis                 4,   Debra A. Lomas1,
                  Mark A. Altabet5 & Adam C. Martiny                       3,6

                  Concentrations and elemental ratios of suspended particulate organic matter influence many
                  biogeochemical processes in the ocean, including patterns of phytoplankton nutrient limita-
1234567890():,;

                  tion and links between carbon, nitrogen and phosphorus cycles. Here we present direct
                  measurements of cellular nutrient content and stoichiometric ratios for discrete phyto-
                  plankton populations spanning broad environmental conditions across several ocean basins.
                  Median cellular carbon-to-phosphorus and nitrogen-to-phosphorus ratios were positively
                  correlated with vertical nitrate-to-phosphate flux for all phytoplankton groups and were
                  consistently higher for cyanobacteria than eukaryotes. Light and temperature were incon-
                  sistent predictors of stoichiometric ratios. Across nutrient-rich and phosphorus-stressed
                  biomes in the North Atlantic, but not in the nitrogen-stressed tropical North Pacific, we find
                  that a combination of taxonomic composition and environmental acclimation best predict
                  bulk particulate organic matter composition. Our findings demonstrate the central role of
                  plankton biodiversity and plasticity in controlling linkages between ocean nutrient and carbon
                  cycles in some regions.

                  1 Bigelow Laboratory for Ocean Sciences, East Boothbay, ME, USA. 2 Corning School of Ocean Studies, Maine Maritime Academy, Castine, ME, USA.
                  3 Department   of Earth System Science, University of California at Irvine, Irvine, CA, USA. 4 Department of Biological Sciences, University of Rhode Island,
                  Kingston, RI, USA. 5 School of Marine Science and Technology, University of Massachusetts Dartmouth, New Bedford, MA, USA. 6 Department of Ecology
                  and Evolution, University of California at Irvine, Irvine, CA, USA. ✉email: mlomas@bigelow.org

                  COMMUNICATIONS EARTH & ENVIRONMENT | (2021)2:143 | https://doi.org/10.1038/s43247-021-00212-9 | www.nature.com/commsenv                                    1
ARTICLE                                               COMMUNICATIONS EARTH & ENVIRONMENT | https://doi.org/10.1038/s43247-021-00212-9

M
           arine phytoplankton elemental stoichiometry has                   through the inclusion of heterotrophic and detrital particles14–16.
           received a significant amount of new attention over the            The inclusion of detrital particles can lead to elevated POM ratios,
           past decade from both observational and theoretical               in nutrient-depleted regions17, independent of the living phyto-
points of view, given the central role of stoichiometric ratios in           plankton community. Latitudinal patterns of elevated POM ratios
understanding global patterns in primary production, carbon                  in the tropics and lower ratios in polar waters could thus result
export, and interconnectivity between trophic levels1,2. Eight               from the additive patterns of decreasing relative contribution of
decades ago Alfred C. Redfield observed that the mean ratio of                detrital particles and increasing prevalence of diatoms from the
sestonic particulate organic carbon (C) to nitrogen (N) to phos-             equator to the poles. Although studies have concluded that
phorus (P) was similar across ocean regions at 106:16:1, albeit              phytoplankton biodiversity is a more important driver of POM
with wide ranges in values, and was similar to the dissolved                 composition5–8,18, these studies, except for those of Martiny
inorganic nutrient ratios in the deep ocean. Redfield hypothesized            et al.5 and Baer et al.18, have only correlated patterns in biodi-
that this global mean state was owing to the remineralization of             versity with bulk POM composition. Further, disentangling the
sinking particulate material derived from the stoichiometric                 phytoplankton community from phenotypic plasticity within a
preferences of phytoplankton3 but did not rule out regional                  taxonomic group is an extant challenge, and this study presents
patterns in phytoplankton community selection and/or nitrogen                direct observational data focused on this challenge. This study
cycle feedbacks4. As data have accumulated, consistent spatial               addresses the following questions. What is the variability in ele-
patterns of deviation from the Redfield Ratio have emerged,                   ment contents and stoichiometric ratios for specific phyto-
although the underlying mechanisms continue to be debated.                   plankton populations across ocean regions? Does environmental
   Spatial variability in the average taxonomic composition of nat-          forcing modulate the observed stoichiometric ratios within a
ural phytoplankton populations has been hypothesized as an                   taxonomic group? Do shifts in biodiversity contribute to variation
important driver of observed patterns in bulk particulate                    in bulk C:N:P of marine communities?
stoichiometry5,6. For example, diatoms7,8, which thrive in nutrient-
rich environments, commonly display N:P ratios lower than the
Redfield Ratio, whereas in contrast, cyanobacteria, which thrive in           Results and discussion
nutrient-poor environments, commonly display N:P ratios greater              Cellular macronutrient contents. Only in the North Atlantic
than the Redfield Ratio in culture9. C:N ratios, in contrast, range           have studies directly measured stoichiometric ratios in phyto-
much more narrowly among taxa. While broad taxonomically                     plankton taxa physically separated from natural populations.
linked stoichiometric ratios are observed5, they are not constant, as        Results highlighted the first-order role of phytoplankton biodi-
within a given phytoplankton taxa phenotypic acclimation to                  versity for determining variations in elemental ratios5,18. In con-
nutrient conditions does occur10,11. Similarly, in the subtropical N.        trast, in the eastern Indian Ocean, with muted variability in
Atlantic it has been shown that specific phytoplankton taxa from              phytoplankton biodiversity, relative to the North Atlantic, studies
natural populations have different stoichiometric ratios as a func-          of bulk POM stoichiometry identified an important role for
tion of depth at the same station5. Sharoni and Halevy6, based on a          nutrient supply, using nutricline depth as a proxy19. Coupled trait-
meta-analysis of field data, concluded that phytoplankton com-                based/remote-sensing input models applied to the global ocean
munity composition, using “optimum-growth” mean cellular stoi-               reach equally diverse conclusions of the importance of
chiometries associated with each taxonomic group, was a better               biodiversity6 versus nutrient inputs when applied to the global
predictor of bulk particulate N:P ratios than a nutrient concentra-          ocean15. Here, we present a data set collected from several major
tion acclimation model. Reaching a different conclusion, Galbraith           ocean basins and a range of environments (Fig. 1) where we have
and Martiny12 observed a robust relationship between ambient                 used fluorescence-activated cell sorting to isolate populations of
phosphate concentrations and bulk particulate N:P ratios, which              important picocyanobacteria, Prochlorococcus and Synechococcus,
was mechanistically linked to plasticity in the ability of certain           and operationally defined picoeukaryotic phytoplankton for sub-
phytoplankton to modulate phosphorus content. The results of                 sequent analysis of their elemental macronutrient content and
these two studies are not mutually exclusive, owing to the covar-            calculated stoichiometric ratios. The data set comprises results
iance of elevated nutrient concentrations and phytoplankton com-             from samples sorted both live (immediately at sea) and those fixed
munities dominated by diatoms13.                                             and sorted in the shore-side laboratory, as the difference between
   In assessing phytoplankton elemental stoichiometry, mea-                  them in paired samples was found to be acceptably small (Sup-
surement of bulk POM ratios leads to biases of varying degrees               plementary Figure 1). For a given element, cellular contents gen-
                                                                             erally spanned a similar range between different biogeographic

Fig. 1 Map of stations from which samples were collected and cell-sorted to quantify cellular macronutrient content. Circled abbreviations represent the
regions: North Atlantic Subpolar (NASP), North Atlantic Subtropical Gyre (NASG), Coastal California (CCAL), Eastern Tropical North Pacific (ETNP), North
Pacific Subtropical Gyre (NPSG), Equatorial Pacific (EqPac), Eastern Indian Ocean (EIO), and the Peru upwelling region (Peru UW). Specific cruise details
can be found in Supplementary Table 1. Dashed lines denote the separation between stations in neighboring regions. Map created in Ocean Data View
(Schlitzer, R., Ocean Data View, http://odv.awi.de, 2014).

2             COMMUNICATIONS EARTH & ENVIRONMENT | (2021)2:143 | https://doi.org/10.1038/s43247-021-00212-9 | www.nature.com/commsenv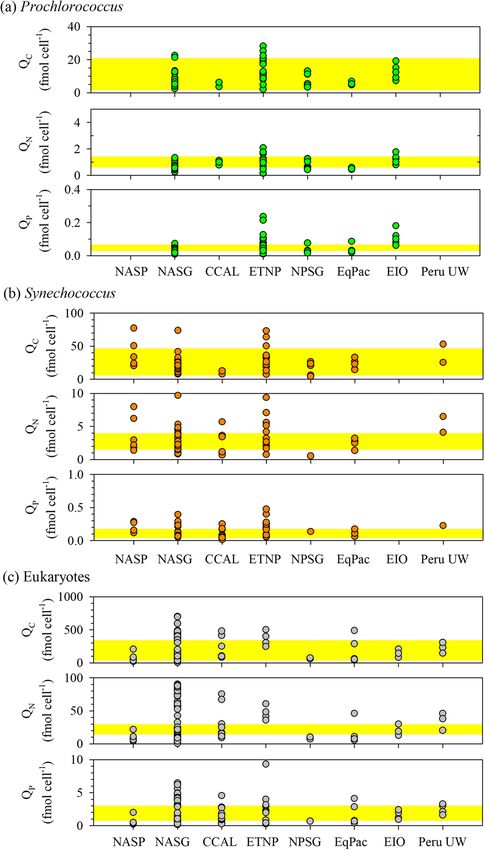
COMMUNICATIONS EARTH & ENVIRONMENT | https://doi.org/10.1038/s43247-021-00212-9                                                         ARTICLE

                                                                              Fig. 3 Elemental stoichiometric ratios for each phytoplankton population
                                                                              in each ocean region. Box-Whisker plots of (a) C:N (mol:mol), (b) C:P
                                                                              (mol:mol), and (c) N:P (mol:mol) ratios for (L to R within a region)
                                                                              Prochlorococcus, Synechococcus, and eukaryotes in each of the eight ocean
                                                                              regions as noted at the top of a and defined in Fig. 1. The box defines the
                                                                              25% and 75% quartiles, the line through the box is the mean, the error bars
                                                                              represent the 5% and 95% distribution limits, and black circles represent
                                                                              data points outside this range. Where there are no box/whisker plots, there
                                                                              are no available data.

                                                                              study agree within a factor of two of published data from culture
                                                                              studies (Fig. 2).

                                                                              Stoichiometric ratios. We explored elemental stoichiometric
                                                                              ratios between different taxonomic populations to determine
                                                                              whether previously observed taxonomic differences in the North
                                                                              Atlantic18,21 are observed in other regions. Prochlorococcus and
                                                                              Synechococcus populations consistently were found to have mean
                                                                              elemental C:N (11 ± 4; 9 ± 2, respectively), C:P (228 ± 77; 188 ±
                                                                              68, respectively) and N:P (22 ± 9; 21 ± 7, respectively) ratios that
Fig. 2 Biogeographical distribution of phytoplankton carbon, nitrogen,        were 0.5- to twofold higher than the canonical Redfield Ratio3,4.
and phosphorus contents. (a) Prochlorococcus, (b) Synechococcus, and (c)      In contrast, the C:N (7 ± 2), C:P (103 ± 15), and N:P (15 ± 4)
eukaryotes, and in each, the upper figure is the cellular elemental quota of   ratios of co-occurring eukaryotes were both less variable and
carbon (QC), the middle figure is the cellular elemental quote of nitrogen     much closer to the Redfield ratio (Fig. 3 and Supplementary
(QN) and the lower figure is the cellular elemental quota of phosphorus        Table 3; Taxa x Region ANOVA, all pairwise comparisons P value
(QP). Regions denoted on the x axis are as defined in Fig. 1. For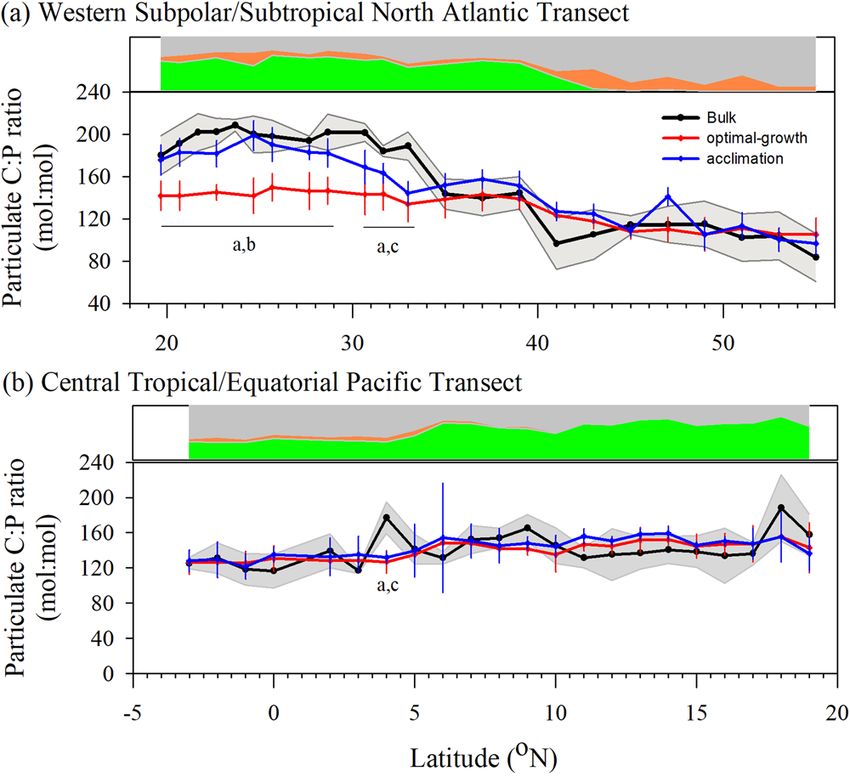
ARTICLE                                              COMMUNICATIONS EARTH & ENVIRONMENT | https://doi.org/10.1038/s43247-021-00212-9

canonical Redfield ratio and that of co-occurring eukaryotes? To             showed a significant negative relationship between cellular C content
explore if these differences are owing to elevated C content or             and temperature, while Synechococcus showed a significant negative
reduced N and P contents, we compare our data to published                  relationship between cellular P content and temperature (Table 1 and
elemental quota data (Supplementary Figure 2). Given the                    Supplementary Figure 4). The observations for Synechococcus and P
unknown, but quite likely variable, physiological state of the              content are consistent with lab studies38,39, although the observations
field samples in this study, published data were taken from both             for Prochlorococcus are not. In general, however, these trends in
culture and natural population data, and which included both                cyanobacteria populations are consistent with the notion that higher
nutrient-replete and nutrient-deplete growth conditions. The                temperatures are associated with ocean gyres, which are more likely
literature values are presented with their complete range to better         to be nutrient-deplete leading to a range of physiological adjustments
reflect this wide range of environmental variables and growth                including higher relative rates of release for newly fixed C40 and
conditions. Prochlorococcus (80 ± 27 fmol µm−3) and Synechococ-             reductions in cellular P-containing metabolites41. In contrast, for the
cus (46 ± 30 fmol µm−3) were found to have mean cell C quotas               Eukaryotes, there is a marginally significant (Table 1) positive
outside the range of published values, 15–40 fmol µm−3 (22–24).             relationship between both cellular C and P and temperature. Further,
The sorted eukaryotic populations, unlike the picocyanobacteria             the trend in the data presents itself as an “envelope” setting a
populations, are a diverse mix of taxa grouped by similarity in             maximum upper limit rather than a predictive relationship between
size. Small eukaryotes, deemed similar in size to those sorted in           variables (Supplementary Figure 4). Although physiological versus
this study, have a C quota range of 9–18 fmol µm−3 (25,26), a               taxonomic differences cannot be resolved for this “population” as it
range that is higher than the mean cell quota observed in this data         contains an unknown diversity of eukaryotes of similar size, the
set, 5 ± 2 fmol µm−3. Similar patterns are seen for N and P                 observation of increasing cell contents is consistent with phyto-
quotas. Mean N quotas for Prochlorococcus (8 ± 3 fmol µm−3)                 plankton temperature-dependent growth response envelopes42 and
and Synechococcus (5 ± 3 fmol µm−3) is greater than the range               the observed differential responses to an increasing temperature
found in the literature, 1.4–4.0 fmol µm−3 (9,24), whereas the              between cultured strains36.
mean N quota of eukaryotes (0.6 ± 0.4 fmol µm−3) was within the                Nearly half of the cellular stoichiometric ratios showed a
estimated published range (0.3–2 fmol µm−3,9,26). Mean P quotas             significant, or marginally significant, relationship with tempera-
for Prochlorococcus (0.2 ± 0.1 fmol µm−3) and Synechococcus (0.1            ture (Table 1 and Supplementary Figure 7). C:P ratios, but not N:P
± 0.1 fmol µm−3) are more similar to the range found in the                 ratios, for Synechococcus and eukaryotes were positively related
literature, 0.03–0.12 fmol µm−3 (9,24), whereas the mean P quota            with temperature; an observation consistent with recent
of eukaryotes (0.04 ± 0.03 fmol µm−3) was within the estimated              research43,44. In this study, for Synechococcus the increase in C:P
published range (0.02–0.25 fmol µm−3,9,26–28). This analysis                ratio is the result of reduced P contents with temperature,
suggests a fundamental difference between natural populations               consistent with the temperature-dependent physiology
of cyanobacteria and eukaryotes of similar size, with cyanobac-             hypothesis45. However, for the eukaryotes, the response was more
teria from this study consistently showing greater cell C quotas            complicated, due to the observation that both cellular C and P
than previously published data, whereas eukaryotes consistently             increased with temperature (Supplementary Figure 4), although
show lower cell C quotas. Although the physiological mechanisms             the greater temperature sensitivity of C, relative to P, led to the
cannot be confirmed with the data in hand, our data are                      significant increase in C:P. The relationships between C:N:P and
consistent with prior research that found significantly greater              temperature are more complex and species-specific than presented
biomass-specific C fixation rates in cyanobacteria than co-                   by Yvon-Durocher44.
occurring eukaryotes29, which may lead to the observed increases               Absolute nutrient concentrations and nutrient ratios are well
in C quotas.                                                                known to regulate cellular particulate stoichiometric ratios in a
                                                                            wide range of species46. Here, we examined nutrient ratios in
                                                                            two formats; the ratio of ambient residual nutrient stocks at the
Environmental correlates. We explore environmental controls to              depth from which samples were collected, and the ratio of
explain the variability in cell contents and stoichiometric ratios          vertical nutrient fluxes across the nutricline, which in most
(Table 1 and Supplementary Figures 3–7). First, we use depth as a           cases was at the base of the euphotic zone (see Baer et al.18,47
proxy for the light environment to which the cells were exposed.            for more information on this approach). The nutrient flux ratio
Across the entire data set, C content in Prochlorococcus increased          is more impactful to phytoplankton in the deepest samples as
significantly (Model 1 regression, P < 0.05) with depth, while P             this represents the ratio supplied by vertical mixing and
content in Prochlorococcus exhibited a marginally significant                upwelling48. No cell contents or stoichiometric ratios were
increase with depth. A similar pattern for C has been reported              significantly correlated with measured ambient residual nitrate:
previously in data from the subtropical North Atlantic20 and                phosphate nutrient ratios. Although this result is in contrast to
cultures30. The only other significant relationship observed with            recent publications2, it is not unexpected given that surface
depth was for Synechococcus N content. This is likely due to                concentration ratios are not expected to be representative of
photoacclimation and increases in cellular pigments containing              phytoplankton uptake ratios and further are skewed by
N31,32. Chlorophyll has 4 N atoms in its structure and thus                 analytical uncertainty at low ambient nutrient concentrations
increases in chlorophyll pigment would increase cellular nitrogen           which can impact ratio calculations. In contrast, Prochlorococ-
content, although it would increase C content to a greater degree           cus and Synechococcus both showed cell contents that were
(chlorophyll C:N ratio 13.5:1). It is more likely that an increase          negatively correlated with increasing ratios of vertical nitrate:
with depth in N-rich phycobilisomes33 led to the increase in                phosphate fluxes (Supplementary Figure 5). This relationship
Synechococcus cellular N quota without an increase in C (Table 1            appeared more as a “threshold”, where above nitrate:phosphate
and Supplementary Figures 3 and 6). This explanation also is                flux ratios of ~24:1 cell contents of C and P attained a
consistent with the lack of relationship between N quota and                minimum and remained at this level while at flux ratio values
depth for Prochlorococcus, as this genus does not use phycobili-            less than ~24:1, cell contents spanned the entire observed range.
somes, but rather a much more N efficient light-harvesting                   This type of inverse rectilinear response is very similar to the
system34,35.                                                                response seen in critical nutrient ratio experiments11,49 that
   Temperature is known to regulate a wide range of physiological           demonstrate the nitrate:phosphate availability ratio where cells
and cellular processes36,37. Across the entire data set, Prochlorococcus    transition from N to P limitation. While eukaryote cell contents

4            COMMUNICATIONS EARTH & ENVIRONMENT | (2021)2:143 | https://doi.org/10.1038/s43247-021-00212-9 | www.nature.com/commsenv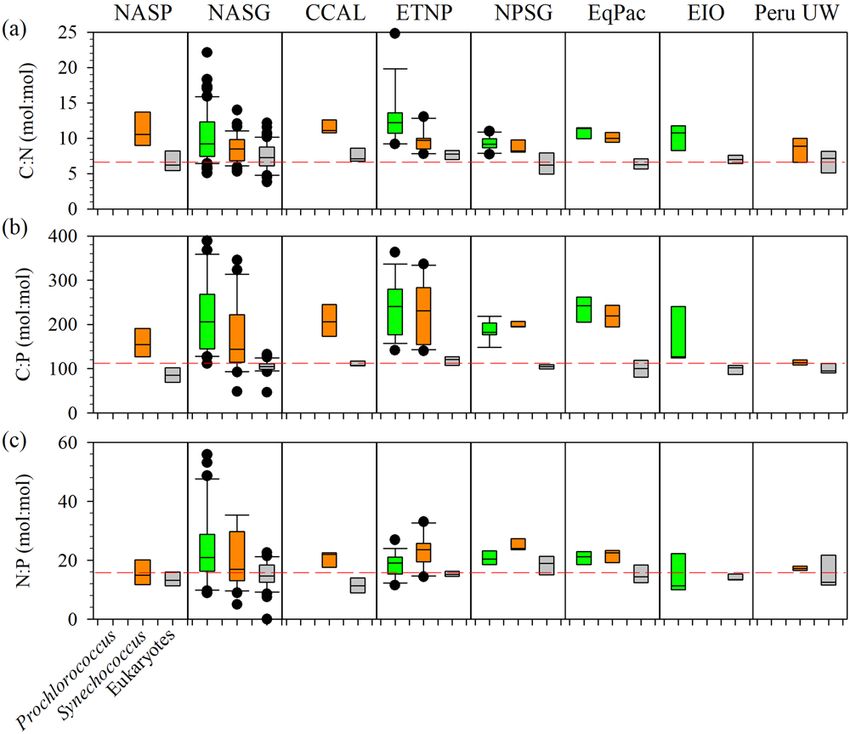
COMMUNICATIONS EARTH & ENVIRONMENT | https://doi.org/10.1038/s43247-021-00212-9                                                                                                      ARTICLE

 Table 1 Correlations between measured environmental variables and cellular contents and stoichiometric ratios for each
 taxonomic group.

 Taxa                           Parameter                Depth (irradiance proxy)                          Temperature                                      NO3:PO4 flux
                                                         R                 P value             N           R                 P value            N           R                 P value            N
 Prochlorococcus                C                         0.41
ARTICLE COMMUNICATIONS EARTH & ENVIRONMENT | https://doi.org/10.1038/s43247-021-00212-9 Fig. 4 Relationship of cellular stoichiometric ratios to vertical nitrate:phosphate fluxes across the nutricline. (a–c) Prochlorococcus; (d–f) Synechococcus; and (g–i) Eukaryote populations and C:N (a, d, g), C:P (b, e, h), and N:P (c, f, i) ratios (mol:mol). stoichiometric ratio rather than using the literature-based opti- as prior studies have shown similarly narrow ranges of bulk POM mum value. A multiple linear regression model was used to cal- C:N ratios21. Furthermore, different picoplankton populations culate the group-specific stoichiometric ratios based upon the from the western North Atlantic, flow cytometrically sorted as in temperature, depth, and vertical nitrate:phosphate flux ratios this study, are only marginally different from each other in terms (Supplementary Table 5), at each station/depth, which was then of the C:N ratios21. Bulk POM N:P ratios showed expected trends, scaled to the relative C biomass of each group in this model. We with bulk POM N:P ratios along the N. Atlantic transect used both models to predict bulk POM stoichiometric ratios, increasing from ~10:1 in the north to ~20:1 in the south, whereas which this research team directly measured along transects from along with the tropical Pacific transect values remained roughly 19°N to 55°N in the western N. Atlantic Ocean and from 19°N to constant at ~20:1 (Supplementary Figure 9). Significant differ- 3°S in the central Tropical/Equatorial Pacific (Fig. 5 and Sup- ences between model outputs and bulk POM N:P ratios were few plementary Figures 8–9). and only occurred at the transition from the subpolar gyre to the Both models provided a reasonable representation of the bulk subtropical gyre (~40°N) along the N. Atlantic transect. Although particulate stoichiometric ratios over portions of both transects differences were not significant for most stations, mean N:P ratios (Fig. 5 and Supplementary Figures 8–9). This suggests that to a from the optimal-growth model were consistently greater than N: first-order phytoplankton community composition is an impor- P values from the acclimation model as the fixed stoichiometric tant driver of bulk POM stoichiometry ratios, otherwise, model N:P ratios in the optimum-growth model were not fully output and observations would not agree as often as was seen. compensated by the shift from a population dominated by However, our data set does not have a great enough “dynamic cyanobacteria to one dominated by eukaryotes. This result range” in the phytoplankton community composition, most supports the hypothesis that phytoplankton community structure samples were from oligotrophic regions and we did not quantify and acclimation to local conditions interact to modulate large phytoplankton in the nutrient-rich regions, to find a stoichiometric ratios in these populations. Changes in stoichio- significant predictive correlation between phytoplankton com- metric C:P ratios more clearly highlighted the potential interplay munities and bulk POM ratios. between phytoplankton community composition and acclimation C:N ratios varied little along either transect with no significant to the local environment. Along the N. Atlantic transect, bulk differences between observations and model outputs (Supple- POM stoichiometric ratios significantly increased (station by station mentary Figure 8). This result for C:N ratios are perhaps expected comparison, Student’s t test, P < 0.05) once south of ~30°N, an 6 COMMUNICATIONS EARTH & ENVIRONMENT | (2021)2:143 | https://doi.org/10.1038/s43247-021-00212-9 | www.nature.com/commsenv
COMMUNICATIONS EARTH & ENVIRONMENT | https://doi.org/10.1038/s43247-021-00212-9                                                                   ARTICLE

                                                                                  leads to significant changes in the N:P and C:P ratios58. If the
                                                                                  nutrient-stress response of stoichiometric ratios seen in Synecho-
                                                                                  coccus is mirrored in Prochlorococcus, the dominance of Prochlor-
                                                                                  ococcus in the autotrophic community could definitely explain the
                                                                                  limited variability in bulk stoichiometric ratios and the lack of
                                                                                  difference between the optimal-growth and acclimation models.
                                                                                     These models show that controls on bulk POM stoichiometry
                                                                                  are more complicated than recently concluded6. Both phyto-
                                                                                  plankton biodiversity and acclimation to the local environment
                                                                                  are important controlling factors of bulk POM stoichiometry and
                                                                                  these controls differ between ocean regions. Sharoni and Halevy
                                                                                  recently concluded that phytoplankton are well-adapted to their
                                                                                  ambient nutrient environment in all ocean regions modeled,
                                                                                  however, our data show that it is the ratio of nitrate:phosphate
                                                                                  inputs that drive cellular acclimation responses, a conclusion also
                                                                                  reached in chemostat culture studies10. We conclude that
                                                                                  biogeochemical models should include both phytoplankton
                                                                                  biodiversity and cellular acclimation to vertical nutrient flux
                                                                                  ratio controls in predictions of particulate stoichiometry and
                                                                                  ocean biogeochemistry.

                                                                                  Concluding remarks
Fig. 5 Measured and modeled euphotic zone particulate carbon-to-
                                                                                  Our observations of cellular macronutrient, C, N, and P, content
phosphorus stoichiometric ratios. Euphotic zone averaged particulate
                                                                                  in populations of marine cyanobacteria and small eukaryotes
organic carbon-to-phosphorus (C:P) stoichiometric ratios along (a) a
                                                                                  from a wide range of ocean regions are generally consistent with
transect in the western North Atlantic Ocean and (b) a transect in the
                                                                                  data from cultured strains but present a significant advance as
central Tropical/Equatorial Pacific. The black line is the euphotic zone
                                                                                  they are direct measures of field populations. The resulting stoi-
(0–100 m) average ratio of bulk POM measurements, and the gray shading
                                                                                  chiometric ratios confirmed prior observations of cyanobacteria
is the 95% confidence interval around the euphotic zone average ratio. The
                                                                                  having consistently and significantly higher ratios than co-
red line is the optimal-growth phytoplankton model estimate of particulate
                                                                                  occurring eukaryotes, with one notable exception. Synechococcus
C:P ratio, and the blue line is the acclimation model estimate of particulate
                                                                                  populations in the nutrient-enriched Peru upwelling region dis-
C:P ratio. For both models, the error bars at each station represent the 95%
                                                                                  played C:P and N:P ratios that were similar to that of eukaryotes.
confidence interval range. The western North Atlantic transect was
                                                                                  This observation supports our conclusion that while baseline
comprised of two cruises, both in August/September, with the northern
                                                                                  stoichiometric ratios are taxonomically linked; cellular ratios are
half (31°N–55°N) conducted in 2013 (Cruise AE1319), and the southern half
                                                                                  not “fixed” but rather are modulated in response to the local
(19°N–33°N) conducted 2014 (BVal 47). The central Tropical/Equatorial
                                                                                  environment, in particular nutrient inputs. Whether this mod-
Pacific transect was a single cruise (NH1418). Significant differences
                                                                                  ulation arises purely from physiological plasticity or from changes
between models and observations at each station are represented in the
                                                                                  in a dominant genotype, particularly in cyanobacteria59, remains
following manner: ‘a’–observations are significantly different from the
                                                                                  to be completely resolved.
predictions of the optimal-growth model; ‘b’–predictions from the optimal-
                                                                                     Ambient light levels (using collection depth as a proxy) and
growth model are significantly different from the predictions of the
                                                                                  temperature were not found to be consistent environmental dri-
acclimation model; and ‘c’–observations are significantly different from the
                                                                                  vers and only a subset of element/taxa combinations were sig-
predictions of the acclimation model. Above each panel is a stacked area
                                                                                  nificantly related to these environmental variables. In stark
plot of the relative contribution of cyanobacteria Prochlorococcus (green fill),
                                                                                  contrast, the ratio of nitrate:phosphate mixing into the euphotic
Synechococcus (orange fill), and eukaryotes (gray fill) to total measured
                                                                                  zone across the nutricline correlated with nearly all element/taxa
autotrophic C along the transect.
                                                                                  cell contents and stoichiometric ratios. This highlights that
                                                                                  despite recent assertions, evidence from direct observations shows
observation previously noted in this region5 and consistent with the              that physiological acclimation to local nutrient supply is impor-
hypothesis that this region is P-stressed54–56. The stoichiometric                tant to understand variance in observed cellular macronutrient
ratios from the optimal-growth model increased only slightly,                     contents and stoichiometric ratios and that the degree of accli-
owing to the increase in relative biomass of Prochlorococcus, and                 mation may differ between prokaryotic and eukaryotic taxa.
were significantly lower than the bulk POM stoichiometric ratios. In               Further, predictions of particulate C:P ratios compared more
contrast, the stoichiometric ratios from the acclimation model                    favorably when this environmental acclimation was considered.
tracked bulk POM in this region and were not significantly
different, supporting the contention of nutrient control of
                                                                                  Methods
stoichiometric ratios2. Furthermore, this increase in bulk POM                    Phytoplankton sample collection and preparation. Samples were collected from
and acclimation model stoichiometric ratios is consistent with the                cruises in several major ocean basins (Supplementary Table 1). Samples for taxon-
increase in the vertical nitrate:phosphate flux ratio along this                   specific elemental content were collected using 12 L Niskin bottles, along with
transect18. The transect in the tropical Pacific, however, did not                 electronic CTD sensor data (temperature, salinity, in vivo chlorophyll fluorescence,
                                                                                  dissolved oxygen), usually from two depths at each station; one within the upper
show any significant differences between either model and the                      mixed layer (10-20 m) and one near the deep chlorophyll maximum. Owing to the
observed bulk POM stoichiometric ratios, despite similarly low                    timing of the cruises, samples were collected from a seasonal window limited to
nutrient concentrations over much of the transect. A possible                     summer and early fall. Samples were prepared for sorting by concentrating cells
explanation for this is the suggestion that the Pacific in this region             from the ambient sample under darkened conditions using a Memteq High
                                                                                  Volume Cell Trap (0.2 µm pore size)60, and then flushed from the Cell Trap using
could be N-stressed57, rather than P-stressed. At least for                       0.2 µm filtered seawater and a luer lock syringe; roughly 3–4 L of ambient seawater
Synechococcus, N-stress has been shown to have no meaningful                      was concentrated down to ~5 mls. Samples were either gravity filtered through
impact on any of the stoichiometric ratios, unlike P-stress, which                the Cell Trap directly from the Niskin bottle or pushed through the cell trap

COMMUNICATIONS EARTH & ENVIRONMENT | (2021)2:143 | https://doi.org/10.1038/s43247-021-00212-9 | www.nature.com/commsenv                                            7
ARTICLE COMMUNICATIONS EARTH & ENVIRONMENT | https://doi.org/10.1038/s43247-021-00212-9 using a peristaltic pump at
COMMUNICATIONS EARTH & ENVIRONMENT | https://doi.org/10.1038/s43247-021-00212-9                                                                              ARTICLE

      investigation using flow cytometry and DT-MS. Org. Geochem. 29, 1561                 44. Yvon-Durocher, G., Dossena, M., Trimmer, M., Woodward, G. & Allen, A. P.
      (1998).                                                                                 Temperature and the biogeography of algal stoichiometry. Glob. Ecol.
18.   Baer, S., Lomas, M., Terpis, K., Mouginot, C. & Martiny, A. C. Stoichiometry            Biogeogr. 24, 562–570 (2015).
      of Prochloroccus, Synechococcus, and small eukaryotic populations in the            45. Toseland, S. et al. The impact of temperature on marine phytoplankton
      western North Atlantic Ocean. Environ. Microbiol 19, 1568–1583 (2017).                  resource allocation and metabolism. Nat. Clim. Change 3, 979–984 (2013).
19.   Garcia, C. et al. Nutrient supply controls particulate elemental concentrations     46. Geider, R. J. & LaRoche, J. Redfield revisited: variability of C:N:P in marine
      and ratios in the low latitude eastern Indian Ocean. Nat. Commun. 9, 4868               microalgae and its biochemical basis. Eur. J. Phycol. 37, 1–17 (2002).
      (2018).                                                                             47. Baer, S. E. et al. Carbon and nitrogen productivity during spring in the
20.   Casey, J., Aucan, J., Goldberg, S. & Lomas, M. Changes in partitioning of               oligotrophic Indian Ocean along the GO-SHIP IO9N transect. Deep Sea Res.
      carbon amongst photosynthetic pico- and nano-plankton groups in the                     II, 81–91 (2019).
      Sargasso Sea in response to changes in the North Atlantic Oscillation. Deep         48. Cullen, J. & Eppley, R. W. Chlorophyll maximum layers of the South
      Sea Res. II 93, 58–70 (2013).                                                           California Bight and possible mechanisms of their formation and
21.   Martiny, A. C., Vrugt, J. A., Primeau, F. & Lomas, M. Regional variation in the         maintenance. Oceanol. Acta 4, 23–32 (1981).
      particulate organic carbon to nitrogen ratio in the surface ocean. Glob.            49. Rhee, G. Y. & Gotham, I. J. The effect of environmental factors on
      Biogeochem. Cycle 27, 23–731 (2013).                                                    phytoplankton growth: temperature and the interactions of temperature with
22.   Campbell, L., Nolla, H. A. & Vaulot, D. The importance of Prochlorococcus to            nutrient limitation. Limnol. Oceanogr. 26, 635–648 (1981).
      community structure in the central North Pacific Ocean. Limnol. Oceanogr.            50. Saito, M. A., Goepfert, T. J. & Ritt, J. T. Some thoughts on the concept of
      39, 955–961 (1994).                                                                     colimitation: three definitions and the importance of bioavailability. Limnol.
23.   Landry, M. R. & Kirchman, D. L. Microbial community structure and                       Oceanogr. 53, 276–290 (2008).
      variability in the tropical Pacific. Deep Sea Res. Part II-Top. Stud. Oceanogr.      51. Edwards, K. F. Mixotrophy in nanoflagellates across environmental gradients
      49, 2669–2693 (2002).                                                                   in the ocean. Proc. Acad. Nat. Sci. Phila. 116, 6211–6220 (2019).
24.   Heldal, M., Scanlan, D. J., Norland, S., Thingstad, F. & Mann, N. H. Elemental      52. Zubkov, M. V. & Tarran, G. A. High bacterivory by the smallest
      composition of single cells of various strains of marine Prochlorococcus and            phytoplankton in the North Atlantic Ocean. Nature 455, 224–226 (2008).
      Synechococcus using X-ray microanalysis. Limnol. Oceanogr. 48, 1732–1743            53. Bertilsson, S., Berglund, O., Pullin, M. & Chisholm, S. W. Release of dissolved
      (2003).                                                                                 organic matter by Prochlorococcus. Vie Et Milieu 55, 225–231 (2005).
25.   Fuhrman, J. A., Sleeter, T. D., Carlson, C. A. & Proctor, L. M. Dominance of        54. Ammerman, J. W., Hood, R. R., Case, D. & Cotner, J. B. Phosphorus
      bacterial biomass in the sargasso sea and its ecological implications. Mar. Ecol.       deficiency in the Atlantic: an emerging paradigm in oceanography. EOS 84,
      Prog. Ser. 57, 207–217 (1989).                                                          165–170 (2003).
26.   Ho, T. et al. The elemental composition of some marine phytoplankton. J.            55. Lomas, M. W. et al. Sargasso Sea phosphorus biogeochemistry: an important
      Phycol. 39, 1145–1159 (2003).                                                           role for dissolved organic phosphorus (DOP). Biogeosciences 7, 695–710
27.   Whitney, L. P. & Lomas, M. W. Growth on ATP elicits a P-stress response in              (2010).
      the picoeukaryote Micromonas pusilla. PLoS ONE 11, e0155158 (2016).                 56. Wu, J., Sunda, W., Boyle, E. & Karl, D. Phosphate depletion in the western
28.   Whitney, L. P. & Lomas, M. W. Phosphonate utilization by eukaryotic                     North Atlantic Ocean. Science 289, 759–762 (2000).
      phytoplankton. Limnol. Oceanogr. Lett. 4, 18–24 (2019).                             57. van Mooy, B. A. S. & Devol, A. H. Assessing nutrient limitation of
29.   Hartmann, M. et al. Efficient CO2 fixation by surface Prochlorococcus in the              Prochlorococcus in the North Pacific subtropical gyre by using an RNA capture
      Atlantic Ocean. ISME J. 8, 2280–2289 (2014).                                            method. Limnol. Oceanogr. 53, 78–88 (2008).
30.   Cailliau, C., Claustre, H., Vidussi, F., Marie, D. & Vaulot, D. Carbon biomass,     58. Garcia, N., Bonachela, J. A. & Martiny, A. C. Interactions between growth-
      and gross growth rates as estimated from C-14 pigment labelling, during                 dependent changes in cell size, nutrient supply and cellular elemental
      photoacclimation in Prochlorococcus CCMP 1378. Mar. Ecol. Prog. Ser. 145,               stoichiometry of marine Synechococcus. ISME Journal 10, 2715–2724 (2016).
      209–221 (1996).                                                                     59. Kashtan, N. et al. Single cell genomics reveals hundreds of coexisting
31.   Moore, L. R. & Chisholm, S. W. Photophysiology of the marine                            subpopulations in wild Prochlorococcus. Science 344, 416–420 (2014).
      cyanobacterium Prochlorococcus: ecotypic differences among cultured                 60. Pitt, F. et al. A sample-to-sequence protocol for genus targeted transcriptomic
      isolates. Limnol. Oceanogr. 44, 628–638 (1999).                                         profiling: application to marine Synechococcus. Front. Microbiol. 7, https://doi.
32.   Moore, L. R., Goericke, R. & Chisholm, S. W. Comparative physiology of                  org/10.3389/fmicb.2016.01592 (2016).
      synechococcus and prochlorococcus - influence of light and temperature on            61. Lomas, M. W. & Martiny, A. C. Direct measure of phytoplankton cell quotas
      growth, pigments, fluorescence and absorptive properties. Mar. Ecol. Prog. Ser.          from field populations sampled from multiple cruises cruises between 2010
      116, 259–275 (1995).                                                                    and 2016. Biological and Chemical Oceanography Data Management Office
33.   Kana, T. M., Feiwel, N. L. & Flynn, L. C. Nitrogen starvation in marine                 (BCO-DMO). (Version 1) Version Date 2021-06-02. https://doi.org/10.26008/
      Synechococcus strains: clonal differences in phycobiliprotein breakdown and             21912/bco-dmo.849153.849151 (2021).
      energy coupling. Marine Ecol. 88, 75–82 (1992).                                     62. Gordon, L., Jennings, J., Jr., Ross, A. & Krest, J. A suggested protocol for
34.   Green, B. R. What happened to the phycobilisome? Biomolecules 9, https://doi.           continuous flow automated analysis of seawater nutrients (phosphate, nitrate,
      org/10.3390/biom9110748 (2019).                                                         nitrite, and silicic acid) in the WOCE Hydrographic Program and the Joint
35.   Stadnichuk, I. N. & Tropin, I. V. Antenna replacement in the evolutionary               Global Ocean Fluxes Study, 55 (Oregon State University, 1993).
      origin of chloroplasts. Microbiology 83, 299–314 (2014).                            63. Hydes, D. J. et al. Determination of dissolved nutrients (N, P, Si) in seawater
36.   Boyd, P. W., others, a. Marine phytoplankton temperature versus growth                  with high precision and inter-comparability using gas-segmented continuous
      responses from polar to tropical waters, outcome of a scientific community-              flow analyzers. IOCCP Report No. 14, 87 (2010).
      wide study. PLoS ONE 8, e63091 (2013).                                              64. Knap, A. et al. BATS Methods Manual Version 4. (U.S. JGOFS Planning
37.   Raven, J. A. & Geider, R. J. Temperature and algal growth. New Phytologist              Office, Woods Hole, 1997).
      110, 441–461 (1988).                                                                65. Karl, D. M. & Tien, G. MAGIC: A sensitive and precise method for measuring
38.   Fu, F. X., Warner, M. E., Zhang, Y., Feng, Y. & Hutchins, D. A. Effects of              dissolved phosphorus in aquatic environments. Limnol. Oceanogr. 37,
      increased temperature and CO2 on photosynthesis, growth, and elemental                  105–116 (1992).
      ratios in marine Synechococcus and Prochlorococcus (Cyanobacteria). J. Phycol.      66. Rimmelin, P. & Moutin, T. Re-examination of the MAGIC method to
      43, 485–496 (2007).                                                                     determine low orthophosphate concentration in seawater. Anal. Chim. Acta
39.   Martiny, A. C., Ma, L. Y., Mouginot, C., Chandler, J. W. & Zinser, E. R.                548, 174–182 (2005).
      Interactions between thermal acclimation, growth rate, and phylogeny
      incluence Prochlorococcus elemental stochiometry. PLoS ONE 11, https://doi.
      org/10.1371/journal.pone.0168291 (2016).
40.   Szul, M. J., Dearth, S. P., Campagna, S. R. & Zinser, E. R. Carbon fate and flux     Acknowledgements
      in Prochlorococcus under nitrogen limitation. mSystems 4, e00254–00218              We thank the Captains and crews of the various vessels that supported these sea-going
      (2019).                                                                             efforts. We thank Agathe Talarmin for sorting samples collected from the SPOTS time-
41.   Van Mooy, B. A. S. et al. Phytoplankton in the ocean use non-phosphorus             series and the Newport Pier. We thank Damian Grundle for inviting MWL on the Sonne
      lipids in response to phosphorus scarcity. Nature, https://doi.org/10.1038/         243 cruise to collect samples in the Peru upwelling system. We acknowledge the National
      nature07659 (2009).                                                                 Science Foundation for supporting our research (OCE-1046297, OCE-1559002, and
42.   Eppley, R. W. Temperature and phytoplankton growth in the sea. Fish. Bull.          OCE-1848576 to ACM and OCE-1045966, OCE-1756054, and OCE-1756271 to MWL).
      70, 1063–1085 (1972).
43.   Garcia, N. et al. High variability in cellular stoichiometry of carbon, nitrogen,
      and phosphorus within classes of marine eukaryotic phytoplankton under              Author contributions
      sufficient nutrient conditions. Front. Microbiol. 9, 543 (2018).                     M.W.L. and A.C.M. conceived the original idea. M.W.L. wrote the manuscript and
                                                                                          prepared the figures with feedback and reviews from other authors. S.E.B., C.M., K.X.T.,

COMMUNICATIONS EARTH & ENVIRONMENT | (2021)2:143 | https://doi.org/10.1038/s43247-021-00212-9 | www.nature.com/commsenv                                                        9
ARTICLE COMMUNICATIONS EARTH & ENVIRONMENT | https://doi.org/10.1038/s43247-021-00212-9
D.A.L. and M.A.A. all contributed to the at-sea collection and/or laboratory analysis of
samples presented in this manuscript. Publisher’s note Springer Nature remains neutral with regard to jurisdictional claims in
published maps and institutional affiliations.
Competing interests
The authors declare no competing interests.
Open Access This article is licensed under a Creative Commons
Attribution 4.0 International License, which permits use, sharing,
Additional information adaptation, distribution and reproduction in any medium or format, as long as you give
Supplementary information The online version contains supplementary material appropriate credit to the original author(s) and the source, provide a link to the Creative
available at https://doi.org/10.1038/s43247-021-00212-9.
Commons license, and indicate if changes were made. The images or other third party
material in this article are included in the article’s Creative Commons license, unless
Correspondence and requests for materials should be addressed to M.W.L.
indicated otherwise in a credit line to the material. If material is not included in the
Peer review information Communications Earth & Environment thanks the anonymous article’s Creative Commons license and your intended use is not permitted by statutory
reviewers for their contribution to the peer review of this work. Primary Handling regulation or exceeds the permitted use, you will need to obtain permission directly from
Editors: Clare Davis. the copyright holder. To view a copy of this license, visit http://creativecommons.org/
licenses/by/4.0/.
Reprints and permission information is available at http://www.nature.com/reprints
© The Author(s) 2021
10 COMMUNICATIONS EARTH & ENVIRONMENT | (2021)2:143 | https://doi.org/10.1038/s43247-021-00212-9 | www.nature.com/commsenvYou can also read