Cross sectional anatomy, computed tomography, and magnetic resonance imaging of the banded houndshark (Triakis scyllium) - Nature
←
→
Page content transcription
If your browser does not render page correctly, please read the page content below
www.nature.com/scientificreports
OPEN Cross‑sectional anatomy,
computed tomography,
and magnetic resonance imaging
of the banded houndshark (Triakis
scyllium)
Sang Wha Kim 1,5, Adams Hei Long Yuen 1,5, Cherry Tsz Ching Poon 2, Joon Oh Hwang3,
Chang Jun Lee3, Moon‑Kwan Oh4, Ki Tae Kim1, Hyoun Joong Kim1, Sib Sankar Giri1,
Sang Guen Kim1, Jun Kwon1, Sung Bin Lee1, Min Cheol Choi1 & Se Chang Park1*
Due to their important phylogenetic position among extant vertebrates, sharks are an invaluable
group in evolutionary developmental biology studies. A thorough understanding of shark anatomy
is essential to facilitate these studies and documentation of this iconic taxon. With the increasing
availability of cross-sectional imaging techniques, the complicated anatomy of both cartilaginous and
soft tissues can be analyzed non-invasively, quickly, and accurately. The aim of this study is to provide
a detailed anatomical description of the normal banded houndshark (Triakis scyllium) using computed
tomography (CT) and magnetic resonance imaging (MRI) along with cryosection images. Three
banded houndsharks were scanned using a 64-detector row spiral CT scanner and a 3 T MRI scanner. All
images were digitally stored and assessed using open-source Digital Imaging and Communications in
Medicine viewer software in the transverse, sagittal, and dorsal dimensions. The banded houndshark
cadavers were then cryosectioned at approximately 1-cm intervals. Corresponding transverse
cryosection images were chosen to identify the best anatomical correlations for transverse CT and
MRI images. The resulting images provided excellent detail of the major anatomical structures of the
banded houndshark. The illustrations in the present study could be considered as a useful reference for
interpretation of normal and pathological imaging studies of sharks.
The past half-century has seen a sharp decline in the population of sharks due to indiscriminate fishing, and they
are now facing a severe extinction c risis1–4. Sharks are apex predators and keystone species, playing an important
role in maintaining the marine ecosystem. Thus, extinction of sharks in certain areas is expected to lead to marine
food chain collapses, which could result in a sharp reduction in the marine food resources available for human
beings5–7. As a result, the importance of protecting endangered shark species has been recognized worldwide,
and efforts to study these species to understand and protect them are being made by various groups, including
aquariums, fishery industries, and b iologists7–12.
With the increasing availability of cross-sectional imaging techniques such as computed tomography (CT)
and magnetic resonance imaging (MRI), the complicated and sophisticated anatomy of both skeletal and soft
tissues can be analyzed non-invasively, quickly, and a ccurately13–16. CT and MRI have often been used not only for
humans but also for various animal s pecies13,17–19. Some of these studies were conducted on sharks and involved
diverse fields such as physiology, anatomy, developmental biology, archaeology, and evolutionary b iology9,20–28.
Although a wide variety of studies have been performed on sharks29, official publications describing the basic
anatomy of sharks particularly in CT and/or MRI evaluations are currently unavailable. Accurate evaluation of
CT and MRI images requires precise knowledge of the anatomy and physiology of the animal. In this regard, the
1
College of Veterinary Medicine and the Research Institute for Veterinary Science, Seoul National University,
Seoul 08826, Republic of Korea. 2Department of Surgery, Queen Mary Hospital, Pokfulam, Hong Kong Special
Administrative Region, China. 3Hyemin Animal Hospital, Seoul 06239, Republic of Korea. 4HDX Corporation,
Seoul 03162, Republic of Korea. 5These authors contributed equally: Sang Wha Kim and Adams Hei Long
Yuen. *email: parksec@snu.ac.kr
Scientific Reports | (2021) 11:1165 | https://doi.org/10.1038/s41598-020-80823-y 1
Vol.:(0123456789)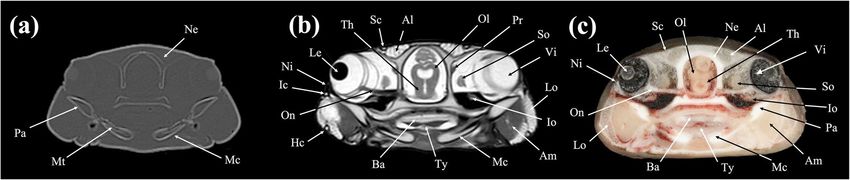
www.nature.com/scientificreports/
Figure 1. Transverse (a) CT, (b) MR, and (c) cryosection images of a banded houndshark (Triakis scyllium)
at level 1 of Fig. 25. Al Ampullae of Lorenzini, Ic Internasal cartilage, Mc Meckel’s cartilage, Mt Mandibular
teeth, Nc Nasal capsule cartilage, Oa Olfactory lamellae, Ob Olfactory bulb, Os Olfactory sac, Ov Oral cavity, Sc
Supraorbital canal.
Figure 2. Transverse (a) CT, (b) MR, and (c) cryosection images of a banded houndshark (Triakis scyllium)
at level 2 of Fig. 25. Al Ampullae of Lorenzini, Cb Cerebrum, Ic Internasal cartilage, Mc Meckel’s cartilage, Te
Teeth, Nc Nasal capsule cartilage, Oa Olfactory lamellae, Ot Olfactory tract, Sc Supraorbital canal.
Figure 3. Transverse (a) CT, (b) MR, and (c) cryosection images of a banded houndshark (Triakis scyllium)
at level 3 of Fig. 25. Al Ampullae of Lorenzini, Am Adductor mandibularis, Ba Basihyal cartilage, Hc
Hyomandibular canal, Ic Infraorbital canal, Io Inferior obliquus, Le Lens, Mc Meckel’s cartilage, Mt Mandibular
teeth, Ne Neurocranium, Ni Nictitating fold, Ol Optic lobe, On Optic nerve, Pa Palatoquadrate, Pr Posterior
rectus, Sc Supraorbital canal, So Superior obliquus, Th Thalamus, Ty Thyroid, Vi Vitreous humor.
development of accurate atlases for certain species by comparing CT and MRI images with actual cryosections
is one of the primary steps that should be established by researchers and veterinarians30. Normal atlases of CT
and MRI findings in various animals have already been set up in order to facilitate accurate image a nalysis30–38.
In the same context, precise atlases of CT and MRI findings in shark species should also be established.
The banded houndshark (Triakis scyllium) is a relatively small-sized shark that is easily found in Korean water.
They inhabit the Northwest Pacific Ocean and are classified as the “least concern” group by the International
Union for Conservation of Nature (IUCN) red list4,39. The purpose of this study is to set up a detailed atlas of the
banded houndshark by comparing CT and MRI images with actual cryosections. To the best of our knowledge,
this is the first study reporting delicate comparison of CT, MRI, and cryosection findings for shark anatomy.
Results
In the present study, CT and MRI allowed identification of a broad selection of anatomical structures and cor-
related well with the corresponding cryosections of the banded houndshark. Clinically relevant anatomical
structures are labeled in Figs. 1, 2, 3, 4, 5, 6, 7, 8, 9, 10, 11, 12, 13, 14, 15, 16, 17, 18, 19, 20, 21, 22, 23. Figures 1, 2,
3, 4, 5, 6, 7, 8, 9, 10, 11, 12, 13, 14 (transverse images), Figs. 15, 16, 17 (sagittal images), and Figs. 18, 19, 20, 21,
22, 23 (dorsal images) present the findings in cranial to caudal, right to left, and dorsal to ventral progression,
Scientific Reports | (2021) 11:1165 | https://doi.org/10.1038/s41598-020-80823-y 2
Vol:.(1234567890)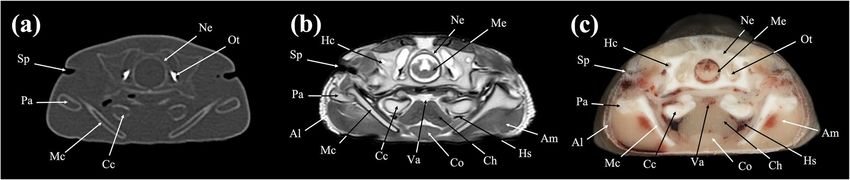
www.nature.com/scientificreports/

                                  Figure 4.  Transverse (a) CT, (b) MR, and (c) cryosection images of a banded houndshark (Triakis scyllium)
                                  at level 4 of Fig. 25. Al Ampullae of Lorenzini, Am Adductor mandibularis, Cc Ceratohyal cartilage, Ch
                                  Coracohyoideus, Co Coracomandibularis, Hc Horizontal semicircular canal, Hs Hyoidean sinus, Me Medulla
                                  Oblongata, Mc Meckel’s cartilage, Ne Neurocranium, Ot Otolith, Pa Palatoquadrate, Sp Spiracle, Va Ventral
                                  aorta.

                                  Figure 5.  Transverse (a) CT, (b) MR, and (c) cryosection images of a banded houndshark (Triakis scyllium)
                                  at level 5 of Fig. 25. Aa Afferent branchial artery, Ab Adductor branchial, As Anterior cardinal sinus, Ba
                                  Basibranchial, Br Branchial rays, Ca Conus arteriosus, Cb Coracobranchialis, Ch Coracohyoideus, Co
                                  Coracomandibularis, Ds Dorsal skeletogenous septum, Ea Epaxial, Ec Epibranchial and ceratobranchial
                                  cartilage, Gf Gill filament, Hp Hypobranchial cartilage, Nu Neural arch, Vc Vertebral centrum.

                                  Figure 6.  Transverse (a) CT, (b) MR, and (c) cryosection images of a banded houndshark (Triakis scyllium) at
                                  level 6 of Fig. 25. As Anterior cardinal sinus, At Atrium, Cr Coracoid bar, Da Dorsal aorta, Ds Dorsal median
                                  septum, Ea Epaxial, Ec Epibranchial and ceratobranchial cartilage, Ha Hypaxial, Sc Spinal cord, Tr Trapezius, Ve
                                  Ventricle, Vc Vertebral centrum.

                                  respectively. Three-dimensional (3D) reconstructed images of CT and MRI data sets showing major skeletons
                                  and organs of the banded houndshark were presented in Fig. 24. Transverse images of MRI and CT are shown
                                  continuously in Supplementary Video S1 and Supplementary Video S2, respectively, to make up for the short-
                                  comings of discontinuous cross-sectional images.

                                  Transverse images. Figures 1, 2, 3, 4, 5, 6, 7, 8, 9, 10, 11, 12, 13, 14.

                                  Sagittal images. Figures 15, 16, 17.

                                  Dorsal images. Figures 18, 19, 20, 21, 22, 23.

Scientific Reports |   (2021) 11:1165 |               https://doi.org/10.1038/s41598-020-80823-y                                                 3

                                                                                                                                            Vol.:(0123456789)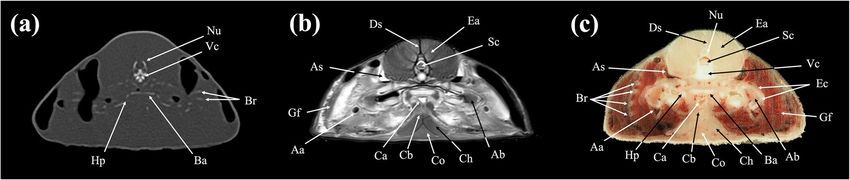
www.nature.com/scientificreports/

                                            Figure 7.  Transverse (a) CT, (b) MR, and (c) cryosection images of a banded houndshark (Triakis scyllium)
                                            at level 7 of Fig. 25. Da Dorsal aorta, Dp Depressor pectoralis, Ds Dorsal median septum, Ea Epaxial, Ga Gall
                                            bladder, Ha Hypaxial, Lp Levator pectoralis internus, Nu Neural arch, Lr Liver, Rc Radial cartilage, Sc Spinal
                                            cord, Sm Stomach, Vc Vertebral centrum, Vv Ventral abdominal vein.

                                            Figure 8.  Transverse (a) CT, (b) MR, and (c) cryosection images of a banded houndshark (Triakis scyllium)
                                            at level 8 of Fig. 25. Ds Dorsal median septum, Du Duodenum, Ea Epaxial, Ha Hypaxial, Id Inclinator dorsalis,
                                            Kd Kidney, Lc Lateral line canal, Lr Liver, Pc Pancreas, Pf Pectoral fin, Rc Radial cartilage, Sc Spinal cord, Sm
                                            Stomach, Ve Vertebra, Vi Valvular intestine, Vs Visceral cavity, Vv Ventral abdominal vein.

                                            Figure 9.  Transverse (a) CT, (b) MR, and (c) cryosection images of a banded houndshark (Triakis scyllium) at
                                            level 9 of Fig. 25. Ds Dorsal median septum, Du Duodenum, Ea Epaxial, Ha Hypaxial, Id Inclinator dorsalis, Kd
                                            Kidney, Lc Lateral line canal, Lr Liver, Pc Pancreas, Rc Radial cartilage, Sc Spinal cord, Sm Stomach, Ve Vertebra,
                                            Vi Valvular intestine, Vs Visceral cavity, Vv Ventral abdominal vein.

                                            Figure 10.  Transverse (a) CT, (b) MR, and (c) cryosection images of a banded houndshark (Triakis scyllium) at
                                            level 10 of Fig. 25. Ds Dorsal median septum, Du Duodenum, Ea Epaxial, Ha Hypaxial, Id Inclinator dorsalis, Kd
                                            Kidney, Lc Lateral line canal, Lr Liver, Rc Radial cartilage, Sc Spinal cord, Sm Stomach, Sn Spleen, Ve Vertebra, Vi
                                            Valvular intestine, Vv Ventral abdominal vein.

          Scientific Reports |   (2021) 11:1165 |                https://doi.org/10.1038/s41598-020-80823-y                                                     4

Vol:.(1234567890)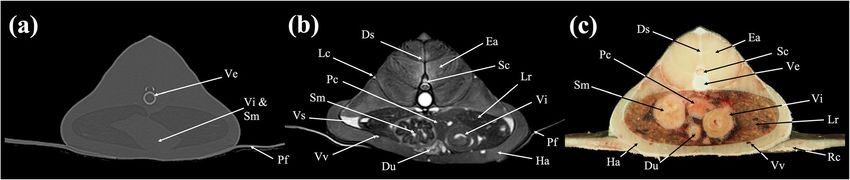
www.nature.com/scientificreports/

                                  Figure 11.  Transverse (a) CT, (b) MR, and (c) cryosection images of a banded houndshark (Triakis scyllium)
                                  at level 11 of Fig. 25. Ds Dorsal median septum, Ea Epaxial, Ha Hypaxial, Id Inclinator dorsalis, Kd Kidney, Lc
                                  Lateral line canal, Lr Liver, Rc Radial cartilage, Sc Spinal cord, Sm Stomach, Sn Spleen, Ve Vertebra, Vi Valvular
                                  intestine, Vv Ventral abdominal vein.

                                  Figure 12.  Transverse (a) CT, (b) MR, and (c) cryosection images of a banded houndshark (Triakis scyllium) at
                                  level 12 of Fig. 25. Cd Caudal artery, Co cloaca, Cv Caudal vein, Ds Dorsal skeletogenous septum, Dv Depressor
                                  ventralis, Ea Epaxial, Ha Hypaxial, Kd Kidney, Le Levator ventralis externus, Li Levator ventralis internus, Ll
                                  Lateral line canal, Rc Radial cartilage, Sc Spinal cord.

                                  Figure 13.  Transverse (a) CT, (b) MR, and (c) cryosection images of a banded houndshark (Triakis scyllium)
                                  at level 13 of Fig. 25. Ds Dorsal skeletogenous septum, Ea Epaxial, Ha Hypaxial, Id Inclinator dorsalis, Rc Radial
                                  cartilage, Sc Spinal cord, Ve Vertebra, Vs Ventral skeletogenous septum.

                                  Discussion
                                  The MRI signal intensity is proportional to the hydrogen density of the structures, ensuring excellent definition
                                  of soft tissues, organs, and cavitary structures in banded houndsharks. These structures included major muscles;
                                  cardiovascular system structures, including the atrium, ventricle, and major arteries and veins; digestive system
                                  structures, including the stomach, gall bladder, and valvular intestine; excretory system structures, including
                                  the kidney; nervous system structures, including the cerebrum, optic lobe, and thalamus. Due to the absence
                                  of hydrogen atoms, most of the cartilaginous skeletons in banded houndsharks did not provide sufficient mag-
                                  netic resonance signal and showed a hypointense (black/dark grey) pattern. Nonetheless, some cartilaginous
                                  structures, such as the jaws and coracoid bar, could still be observed due to the contrast between the cartilage
                                  and the adjacent soft tissues.
                                      In contrast to MRI, excellent discrimination of cartilaginous structures was evident in the CT images. The
                                  higher electron density of cartilages caused increased attenuation compared to soft tissue, making them appear
                                  more whitish in the CT images. The cartilage margins were better defined by means of CT than cryosections or
                                  MRI, particularly in assessing joint structures. Soft tissues were vaguely distinguished using CT examinations
                                  due to their similar attenuation properties. Nevertheless, attenuation differences between lipid-rich tissues (e.g.,
                                  liver) and muscles (e.g., stomach and valvular intestine) were shown in varying shades of grey allowing definition
                                  of some organs in the visceral cavity.

Scientific Reports |   (2021) 11:1165 |                https://doi.org/10.1038/s41598-020-80823-y                                                      5

                                                                                                                                               Vol.:(0123456789)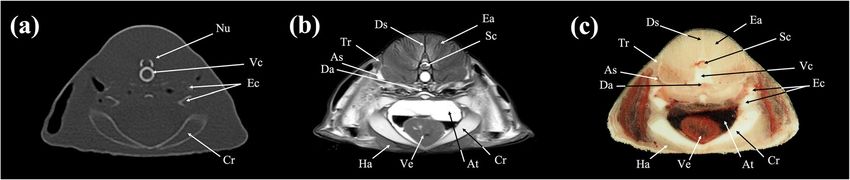
www.nature.com/scientificreports/
Figure 14. Transverse (a) CT, (b) MR, and (c) cryosection images of a banded houndshark (Triakis scyllium)
at level 14 of Fig. 25. Cv Caudal vessel, Ea Epaxial, Ha Hypaxial, Hh Haemal arch, Rc Radial cartilage, Sc Spinal
cord, Ve Vertebra.
Figure 15. Sagittal (a) CT and (b) MR images of a banded houndshark (Triakis scyllium) at level 15 of Fig. 25.
Al Ampullae of Lorenzini, Cc Ceratohyal cartilage, Cr Coracoid bar, Ec Epibranchial and ceratobranchial
cartilage, Es Esophagus, Ga Gall bladder, Mc Meckel’s cartilage, Oa Olfactory lamellae, Oc Otic capsule, Pa
Palatoquadrate, Sm Stomach, Nv Nasal cavity.
CT and MRI offer considerable advantages over traditional radiographic approaches on identification of the
anatomical structures of sharks. In traditional radiography, images are presented as superimposed two-dimen-
sional projections of three-dimensional structures, which result in limitation to exhibit high conspicuity. The
tomographic nature of CT and MRI allows organs to be examined in thin sections, eliminating superimposition
of overlying structures that may hinder the specific interpretation of anatomical structures.
Another major advantage of CT and MRI is the ability to reformat the datasets in any imaging plane or as
3D projections, allowing better understanding of the spatial relationships of anatomical structures in sharks.
These techniques have added detail of the anatomical structures and can be used as an anatomic reference for
imaging studies of the banded houndshark and other shark species. It is recommended to reduce CT/MRI slice
thickness as much as possible in order to achieve excellent quality and high detail of 3D reconstructed images,
since increasing slice thicknesses may require more interpolation between slices when rendering 3D images,
which results in a loss of r esolution40.
Due to their important phylogenetic position among extant vertebrates, sharks are an invaluable group in
evolutionary developmental biology studies. However, the presence of high levels of urea accelerates the decom-
esh41. Moreover, because of its cartilaginous nature, shark skeleton has a high tendency to
position of shark fl
warp, crack, and shrink during specimen preparation42. These factors represent major difficulties in preserving
anatomical data from sharks. In the present study, CT and MRI were used to identify and document soft tissues
and cartilaginous structures in banded houndsharks. The non-invasive nature of CT and MRI prevented the
irretrievable destruction of specimens during traditional dissection. The spatial relationships among organs, soft
tissues, and cartilage can be selectively observed in situ in their natural locations43,44. After examinations, all
images are permanently recorded in the Digital Imaging and Communications in Medicine (DICOM) format and
could be recalled at will. The images are digitally transferable, which can also facilitate discussion and opinion
sharing among professionals worldwide even if the specimens cannot be physically provided.
Banded houndshark is a relatively small-sized shark species that can be adequately fit into the bore of medi-
cal CT and MRI used in the present study. However, to the best of the authors’ knowledge, only the head of
large-sized shark species has been subjected to imaging examination possibly because of limited gantry size45–47.
Sharks with body girth larger than the maximum diameter of field of view (FOV) of medical CT and MRI may
Scientific Reports | (2021) 11:1165 | https://doi.org/10.1038/s41598-020-80823-y 6
Vol:.(1234567890)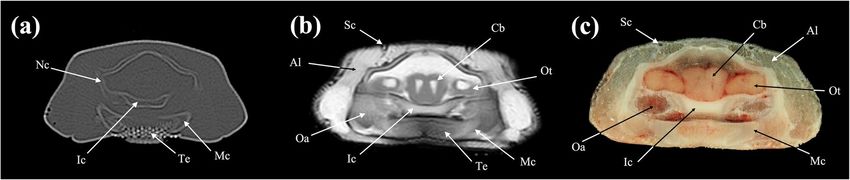
www.nature.com/scientificreports/
Figure 16. Mid-sagittal (a) CT and (b) MR images of a banded houndshark (Triakis scyllium) at level 16 of
Fig. 25. Al Ampullae of Lorenzini, At Atrium, Ba Basihyal cartilage, Cb Cerebrum, Ce Cerebellum, Cl cloaca,
Co Coracomandibularis, Cr Coracoid bar, Ch Coracohyoideus, Ct Ceratotrichia, Da Dorsal aorta, Ea Epaxial,
Es Esophagus, Ga Gall bladder, Ha Hypaxial, Ic Internasal cartilage, Kd Kidney, Lr Liver, Me Medulla oblongata,
Ne Neurocranium, Nu Neural arch, Oa Olfactory lamellae, Ol Optic lobe, Rc Radial cartilage, Sc Spinal cord, Te
Teeth, Ts Transverse septum, Vi Valvular intestine, Ve Ventricle, Vt Ventral constrictors, Vc Vertebral centrum,
Sm Stomach, Sv Spiral valve.
Figure 17. Sagittal (a) CT and (b) MR images of a banded houndshark (Triakis scyllium) at level 17 of Fig. 25.
Al Ampullae of Lorenzini, Am Adductor mandibularis, Ba Basihyal cartilage, Cc Ceratohyal cartilage, Es
Esophagus, Hc Hyomandibular canal, Ic Infraorbital canal, Io Inferior obliquus, Lc Levator cranium maxillae,
Le Lens, Mc Meckel’s cartilage, Mp Metapterygium, Mt Mandibular teeth, Ne Neurocranium, Ni Nictitating
fold, Ol Optic lobe, Op Optic nerve, Ov Oral cavity, Pa Palatoquadrate, Po Preorbitalis, Pr Posterior rectus, Sc
Supraorbital canal, Su Scapular cartilage, So Superior obliquus, Th Thalamus, Ty Thyroid, Vi Vitreous humor.
also induce out-of-field artifacts, anatomical structures that lies beyond the FOV may be truncated. With the
rapid advancement of medical imaging technologies, wide bore CT and MRI have become available for large
animals48–50. Although the current availability of wide bore CT and MRI scanners are limited and the set up cost
is high, the use of wide bore CT and MRI may offer a feasible alternative for imaging examination of large-sized
shark species in future.
Conclusions
The illustrations in the present study are the first to provide a comprehensive atlas, using CT and MRI, to evalu-
ate the anatomical structures of the banded houndshark. Both imaging modalities provide good contrast for
the anatomical structures of the banded houndshark. With the rapid advancement and increasing availability
of medical imaging technologies, CT and MRI are enhancing our knowledge of the anatomy of sharks together
Scientific Reports | (2021) 11:1165 | https://doi.org/10.1038/s41598-020-80823-y 7
Vol.:(0123456789)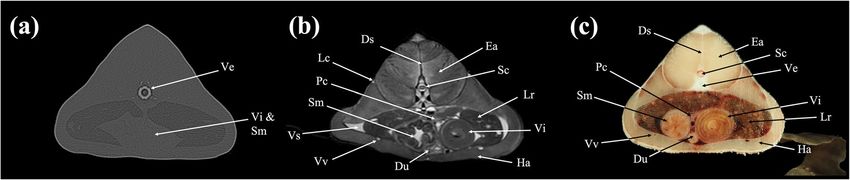
www.nature.com/scientificreports/

                                            Figure 18.  Dorsal (a) CT and (b) MR images of a banded houndshark (Triakis scyllium) at level 18 of Fig. 25.
                                            Al Ampullae of Lorenzini, Ce Cerebellum, Ea Epaxial, Sg Scleral cartilage, Ln Lens, Me Medulla oblongata, Mp
                                            Metapterygium, Nc Neurocranium, Oc Otic capsule, Ol Optic lobe, Re Retina, Rp Rectus posterior.

                                            Figure 19.  Dorsal (a) CT and (b) MR images of a banded houndshark (Triakis scyllium) at level 19 of Fig. 25.
                                            Al Ampullae of Lorenzini, Cb Cerebrum, Ij Intervertebral junction, Mp Metapterygium, Nc Neurocranium, Oa
                                            Olfactory lamellae, Oc Otic capsule, Ol Optic lobe, Ot Olfactory tract, Sp Spiracle, Tp Transverse process, Vc
                                            Vertebral centrum.

          Scientific Reports |   (2021) 11:1165 |               https://doi.org/10.1038/s41598-020-80823-y                                                   8

Vol:.(1234567890)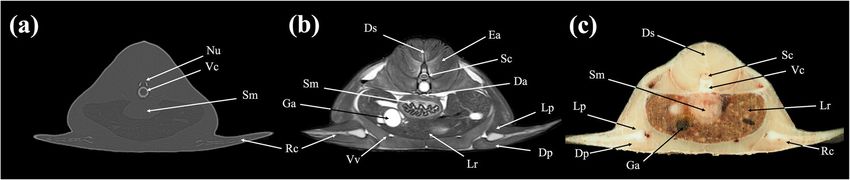
www.nature.com/scientificreports/

                                  Figure 20.  Dorsal (a) CT and (b) MR images of a banded houndshark (Triakis scyllium) at level 20 of Fig. 25.
                                  Al Ampullae of Lorenzini, Cb Cerebrum, Ea Epaxial, Eb Epibranchial, Hm Hyomandibular, Ij Intervertebral
                                  joint, Lc Levator cranium maxillae, Mp Metapterygium, Nc Nasal capsule, Oa Olfactory lamellae, Ob Olfactory
                                  bulb, Oc Optic capsule, On Optic nerve, Ov Obliquus ventralis, Pb Pharyngobranchial, Po Preorbitalis, Ri Rectus
                                  inferior, Sp Spiracle, Th Thalamus, Vc Vertebral centrum.

                                  Figure 21.  Dorsal (a) CT and (b) MR images of a banded houndshark (Triakis scyllium) at level 21 of Fig. 25. Al
                                  Ampullae of Lorenzini, Cb Cerebrum; Da Dorsal aorta, Eb Epibranchial, Hm Hyomandibular, Ij Intervertebral
                                  junction, Lc Levator cranium maxillae, Mp Metapterygium, Nc Nasal capsule, Nv Nasal cavity, Oa Olfactory
                                  lamellae, Ob Olfactory bulb, Oc Optic capsule, On Optic nerve, Ov Obliquus ventralis, Pb Pharyngobranchial,
                                  Tp Transverse process, Ri Rectus inferior, Sp Spiracle, Vc Vertebral centrum.

Scientific Reports |   (2021) 11:1165 |               https://doi.org/10.1038/s41598-020-80823-y                                                9

                                                                                                                                           Vol.:(0123456789)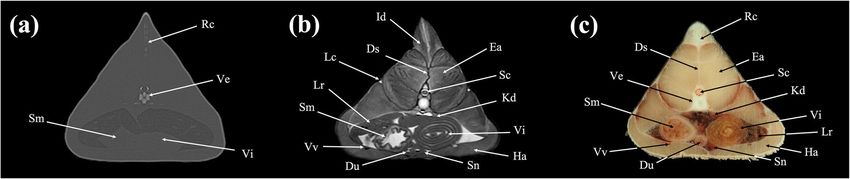
www.nature.com/scientificreports/

                                            Figure 22.  Dorsal (a) CT and (b) MR images of a banded houndshark (Triakis scyllium) at level 22 of Fig. 25.
                                            Al Ampullae of Lorenzini, Am Adductor mandibularis, Ba Basihyal cartilage, Bc Branchial cartilage, Cc
                                            Ceratohyal cartilage, Ch Coracohyoideus, Ha Hypaxial, Hb Hypobranchial, Gb Gall bladder, Kd Kidney, Lr
                                            Liver, Mc Meckel’s cartilage, Ms Mesopterygium, Mp Metapterygium, Nv Nasal cavity, Oa Olfactory lamellae,
                                            Pa Palatoquadrate, Pc Pericardial cavity, Vt Ventral constrictors, Rc Rostral cartilage, Te Teeth, Sm Stomach, Sy
                                            Symphysis.

                                            Figure 23.  Dorsal (a) CT and (b) MR images of a banded houndshark (Triakis scyllium) at level 23 of Fig. 25.
                                            Am Adductor mandibularis, Co Coracomandibularis, Cr Coracoid bar, Ch Coracohyoideus, Ga Gall bladder, Gf
                                            Gill filament, Ha Hypaxial, Lr Liver, Mc Meckel’s cartilage, Ms Mesopterygium, Rc Radial cartilage, Sm Stomach,
                                            Te Teeth, Ts Transverse septum, Ve Ventricle, Vi Valvular intestine.

          Scientific Reports |   (2021) 11:1165 |                https://doi.org/10.1038/s41598-020-80823-y                                                     10

Vol:.(1234567890)
www.nature.com/scientificreports/
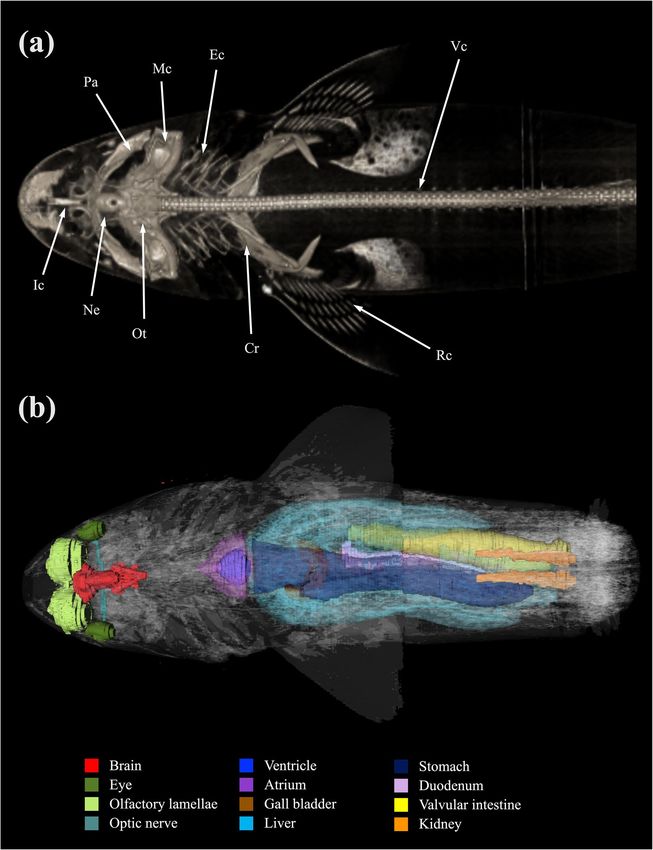
Figure 24. Three dimensional reconstructed images of (a) CT and (b) MRI showing major skeletal structures
and organs respectively of a banded houndshark (Triakis scyllium). Cr Coracoid bar, Ec Epibranchial and
ceratobranchial cartilage, Ic Internasal cartilage, Mc Meckel’s cartilage, Ne Neurocranium, Ot Otolith, Pa
Palatoquadrate, Rc Radial cartilage, Vc Vertebral centrum.
with dissected and necropsy materials. The findings of the present study could be considered as a useful reference
of normal tomographic anatomy of sharks and used for the interpretation of normal and pathological imaging
studies of sharks in future.
Scientific Reports | (2021) 11:1165 | https://doi.org/10.1038/s41598-020-80823-y 11
Vol.:(0123456789)www.nature.com/scientificreports/
Figure 25. Three-dimensional surface reconstructions of a banded houndshark (Triakis scyllium) from
computed tomography (CT) scans, indicating approximate levels of transverse, sagittal, and dorsal sections
corresponding to Figs. 1, 2, 3, 4, 5, 6, 7, 8, 9, 10, 11, 12, 13, 14, Figs. 15, 16, 17, and Figs. 18, 19, 20, 21, 22, 23,
respectively. Slices 1–4 are approximately 2 cm intervals, slices 4–9 are approximately 5 cm intervals, slices 9–11
are approximately 6 cm intervals, slices 11–14 are approximately 12 cm intervals, slices 15–17 are approximately
3 cm intervals, and slices 18–23 are approximately 1 cm intervals.
Material and methods
Animals. Three banded houndsharks were obtained commercially from Seoul, the Republic of Korea. The
banded houndsharks were 1 male (total body length (TBL): 90 cm, age: estimated as 3.4 years) and 2 females
(TBL: 91 cm, age: estimated as 3.3 years; TBL: 102 cm, age: estimated as 4.1 years) with body lengths ranging
from 90 to 102 cm. Ages of the sharks were estimated based on their TBL and it was judged that the sharks were
about to be sexually mature51. All animals were selected by a veterinarian (SWK) based on the lack of external
evidence of trauma and disease. The banded houndsharks were euthanized via tricaine methanesulfonate over-
dose (500 ppm) right before imaging examinations in order to minimize post-mortem changes.
Magnetic resonance imaging (MRI). MRI examinations were performed using a 3-T (T) MRI scanner
(Achieva, Philips Healthcare, The Netherlands). A head coil was used to receive the signal using fast spin echo
sequences in the T2-weighted (T2W) mode, in which signals from loosely bound protons (e.g., fluids) were
enhanced:
1. Transverse images were obtained with the following parameters: echo time (TE), 90 ms; repetition time (TR),
4920.8 ms; pixel bandwidth, 180 Hz; flip angle, 90°, and FOV, 123 × 123 mm with reconstructed spacing,
0.17 × 0.17 mm. Slice thickness was 2 mm.
2. Sagittal images were obtained with the following parameters: TE, 90 ms; TR, 4870.9 ms; pixel bandwidth,
215 Hz; flip angle, 90°, and FOV, 76 × 76 mm with reconstructed spacing, 0.20 × 0.20 mm. Slice thickness
was 3 mm.
3. Dorsal images were obtained with the following parameters: TE, 70 ms; TR, 3865.9 ms; pixel bandwidth,
236 Hz; flip angle, 90°, and FOV, 81 × 81 mm with reconstructed spacing, 0.23 × 0.23 mm. Slice thickness
was 1.5 mm.
Computed tomography (CT). CT images were acquired with a 64-detector row spiral CT scanner
(Aquilion, Toshiba Medical Systems, Nasu, Japan). The CT examination was performed at 120 kV and 80–100 mA
with a 1-mm slice thickness. The scan field of view (sFOV) ranged from 20.3 to 30.2 cm. The transverse image
datasets were acquired using the soft tissue and bone algorithm. CT images in the dorsal and sagittal dimensions
were obtained using the multiplanar reconstruction (MPR) function. MRI and CT images were assessed using
open-source DICOM viewer software (Horos Project, version 3.3.6; www.horosproject.org).
Scientific Reports | (2021) 11:1165 | https://doi.org/10.1038/s41598-020-80823-y 12
Vol:.(1234567890)www.nature.com/scientificreports/
Cryosectioning. All specimens were frozen (− 22 °C) in the ventral recumbency position until cryosec-
tioning could be carried out. The banded houndsharks were sectioned using an electrical band saw along the
transverse plane at approximately 1-cm intervals. Slices were numbered, cleaned, and photographed on both
sides. Fourteen transverse section levels were selected. For each section level, the corresponding transverse MRI
and CT images were chosen to identify the best anatomical correlation. Lines corresponding to these levels were
superimposed on three-dimensional reconstructed images of an banded houndshark (Fig. 25).
Three‑dimensional (3D) reconstruction. 3D reconstructions of the skeletons were made on acquired
CT data sets using intensity-based segmentation methods of the inbuilt software of 64-detector row spiral CT
scanner (Aquilion, Toshiba Medical Systems, Nasu, Japan). The reconstructed skeletons were visualised after
excluding remaining residual soft tissue structures. 3D reconstructions of major organs were made on MRI data
sets using intensity-based and manual segmentation methods of an open-source DICOM viewer—InVesalius 3.0
(CTI—Center for Information and Technology Renato Archer, Campinas, São Paulo, Brazil).
Ethical approval. The study was approved by the Seoul National University Institutional Animal Care and
Use Committee (approval number: SNU-190925-2). All experiments were performed in accordance with the
IACUC guidelines and regulations. This study was also performed in accordance with the Animal Research:
Reporting of In Vivo Experiments (ARRIVE) guidelines: to reflect the scarcity of banded houndshark over
90 cm TBL in the fish markets of the Republic of Korea, sample size was decided to three; to minimize the poten-
tial confounders, both male and female sharks were used; to show the developmental stages, TBL and estimated
age of each shark were provided.
Data availability
All data generated or analyzed during this study are included in this published article.
Received: 25 September 2020; Accepted: 29 December 2020
References
1. Lack, M. & Sant, G. The future of sharks: a review of action and inaction. TRAFFIC International and the Pew Environment Group.
https://www.pewtrusts.org/~/media/legacy/uploadedfiles/peg/publications/report/the20future20of20sharkspdf.pdf (2011).
2. Barker, M. J. & Schluessel, V. Managing global shark fisheries: Suggestions for prioritising management strategies. Aquat. Conserv.
15, 325–347 (2005).
3. Baum, J. K. & Blanchard, W. Inferring shark population trends from generalized linear mixed models of pelagic longline catch and
effort data. Fish Res. 102, 229–239 (2010).
4. International Union for Conservation of Nature (IUCN). The IUCN Red List of Threatened Species. Version 2018–1. http://www.
iucnredlist.org (2018).
5. Heithaus, M. R., Wirsing, A. J. & Dill, L. M. The ecological importance of intact top-predator populations: A synthesis of 15 years
of research in a seagrass ecosystem. Mar. Freshw. Res. 63(11), 1039–1050 (2012).
6. Ferretti, F., Worm, B., Britten, G. L., Heithaus, M. R. & Lotze, H. K. Patterns and ecosystem consequences of shark declines in the
ocean. Ecol. Lett. 13, 1055–1071 (2010).
7. Myers, R. A., Baum, J. K., Shepherd, T. D., Powers, S. P. & Peterson, C. H. Cascading effects of the loss of apex predatory sharks
from a coastal ocean. Science 315, 1846–1850 (2007).
8. Dulvy, N. K. et al. Challenges and priorities in shark and ray conservation. Curr. Biol. 27(11), R565–R572 (2017).
9. Summers, A. P., Ketcham, R. A. & Rowe, T. Structure and function of the horn shark (Heterodontus francisci) cranium through
ontogeny: Development of a hard prey specialist. J. Morphol. 260(1), 1–12 (2004).
10. Stevens, J. D., Bonfil, R., Dulvy, N. K. & Walker, P. A. The effects of fishing on sharks, rays, and chimaeras (chondrichthyans), and
the implications for marine ecosystems. Ices. J. Mar. Sci. 57(3), 476–494 (2000).
11. Dulvy, N. K. et al. Extinction risk and conservation of the world’s sharks and rays. eLife 3, e00590 (2014).
12. Davidson, L. N. K., Krawchuk, M. A. & Dulvy, N. K. Why have global shark and ray landings declined: Improved management or
overfishing?. Fish Fish. 17(2), 438–458 (2016).
13. Lauridsen, H. et al. Inside out: Modern imaging techniques to reveal animal anatomy. PLoS ONE 6(3), e17879 (2011).
14. Dirnhofer, R., Jackowski, C., Vock, P., Potter, K. & Thali, M. J. VIRTOPSY: Minimally invasive, imaging-guided virtual autopsy.
Radiographics. 26(5), 1305–1334 (2006).
15. Kot, B. C. W., Chan, D. K. P., Yuen, A. H. L. & Tsui, H. C. L. Diagnosis of atlanto-occipital dissociation: Standardised measurements
of normal craniocervical relationship in finless porpoises (genus Neophocaena) using postmortem computed tomography. Sci
Rep. 8, 8474 (2018).
16. Furukawa, A. et al. Cross-sectional imaging in crohn disease. Radiographics 24(3), 689–702 (2004).
17. Gumpenberger, M. & Henninger, W. The use of computed tomography in avian and reptile medicine. Semin. Avian Exot. Pet. Med.
10(4), 174–180 (2001).
18. Preziosi, R. et al. Spinal deformity in a sandtiger shark, Carcharias taurus Rafinesque: A clinical–pathological study. J. Fish Dis.
29(1), 49–60 (2005).
19. Van Bonn, W., Jensen, E. & Brook, F. Radiology, computed tomography, and magnetic resonance imaging. In CRC Handbook of
Marine Mammal Medicine (eds Dierauf, L. A. & Gulland, F. M. D.) 557–591 (CRC Press Inc., Boca Raton, 2001).
20. Jambura, P. L. et al. Micro-computed tomography imaging reveals the development of a unique tooth mineralization pattern in
mackerel sharks (Chondrichthyes; Lamniformes) in deep time. Sci. Rep. 9, 9652 (2019).
21. Abel, R. L. et al. Functional morphology of the nasal region of a hammerhead shark. Comp. Biochem. Physiol. Part A Mol. Integr.
Physiol. 155(4), 464–475 (2010).
22. Wroe, S. et al. Three-dimensional computer analysis of white shark jaw mechanics: How hard can a great white bite?. J. Zool. 276(4),
336–342 (2008).
23. Timm, L. L. & Fish, F. E. A comparative morphological study of head shape and olfactory cavities of sharks inhabiting benthic and
coastal/pelagic environments. J. Exp. Mar. Biol. Ecol. 414–415, 75–84 (2012).
24. Kamminga, P., Bruin, P. W. D., Geleijns, J. & Brazeau, M. D. X-ray computed tomography library of shark anatomy and lower jaw
surface models. Sci. Data. 4, 170047 (2017).
Scientific Reports | (2021) 11:1165 | https://doi.org/10.1038/s41598-020-80823-y 13
Vol.:(0123456789)www.nature.com/scientificreports/
25. Mollen, F. H., Wintner, S. P., Iglésias, S. P., Sommeran, S. R. V. & Jagt, J. W. M. Comparative morphology of rostral cartilages in
extant mackerel sharks (Chondrichthyes, Lamniformes, Lamnidae) using CT scanning. Zootaxa. 3340(1), 29–43 (2012).
26. Mara, K. R., Motta, P. J., Martin, A. P. & Hueter, R. E. Constructional morphology within the head of hammerhead sharks (sphy-
rnidae). J. Morphol. 276(5), 526–539 (2015).
27. Geraghty, P. T., Jones, A. L., Stewart, J. & Macbeth, W. G. Micro-computed tomography: An alternative method for shark ageing.
J. Fish Biol. 80(5), 1292–1299 (2012).
28. Moyer, J. K., Hamilton, N. D., Seeley, R. H., Riccio, M. L. & Bemis, W. E. Identification of shark teeth (Elasmobranchii: Lamnidae)
from a historic fishing station on Smuttynose island, maine, using computed tomography imaging. Northeast Nat. 22(3), 585–597
(2015).
29. Meng, Q. & Li, W. Monographs of Fishes of China. No. 3 Anatomy of Shark and Skate (Ocean Publishing, 1992). Meng, Q. & Li,
W. Monographs of Fishes of China. No. 3 Anatomy of Shark and Skate (Ocean Publishing, 1992). Meng, Q. & Li, W. Monographs
of Fishes of China. No. 3 Anatomy of Shark and Skate (Ocean Publishing, 1992).
30. Samii, V. F., Biller, D. S. & Koblik, P. D. Normal cross-sectional anatomy of the feline thorax and abdomen: Comparison of computed
tomography and cadaver anatomy. Vet. Radiol. Ultrasound. 39(6), 504–511 (1998).
31. Alonso-Farre, J. M. et al. Cross-sectional anatomy, computed tomography and magnetic resonance imaging of the thoracic region
of Common Dolphin (Delphinus delphis) and striped Dolphin (Stenella coeruleoalba). Anat. 43, 221–229 (2014).
32. Alonso-Farre, J. M. et al. Cross-sectional anatomy, computed tomography and magnetic resonance imaging of the head of common
Dolphin (Delphinus delphis) and Striped Dolphin (Stenella coeruleoalba). Anat. 44, 13–21 (2015).
33. Ibrahim, A. A. H., Adam, Z. E. & Tawfiek, M. G. Cross-sectional anatomy, magnetic resonance imaging and computed tomography
of fetlock joint in camel. J. Vet. Med. Res. 26(2), 258–270 (2019).
34. Wyman, A. C., Lawson, T. L. & Goodman, L. R. Transverse Anatomy of the Human Thorax, Abdomen and Pelvis in An Atlas of
Anatomic Radiologic Computed Tomographic and Ultrasonic Correlation 1st edn. (Brown and Co., Little, 1978).
35. Feeney, D.A., Fletcher, T.F. & Hardy, R.M. Atlas of correlative imaging anatomy of the normal dog: Ultrasound and computed
tomography. 1st ed. (WB Saunders, 1991).
36. Smallwood, J. E. & George, T. F. Anatomic atlas for computed tomography in the mesaticephalic dog: Thorax and cranial abdomen.
Vet. Radiol. 34, 65–84 (1993).
37. Smallwood, J. E. & George, T. F. Anatomic atlas for computed tomography in the mesaticephalic dog: Caudal abdomen and pelvis.
Vet. Radiol. 34, 143–167 (1993).
38. Valente, A. L. S. et al. Computed tomography of the vertebral column and coelomic structures in the normal loggerhead sea turtle
(Caretta caretta). Vet. J. 174(2), 362–370 (2007).
39. Compagno, L. J. V. Sharks of the world: An annotated and illustrated catalogue of shark species known to date. FAO Species Catal.
4, 432 (1984).
40. Ford, J. M. & Decker, S. J. Computed tomography slice thickness and its effects on three-dimensional reconstruction of anatomical
structure. J. Forens. Radiol. Imaging. 4, 43–46 (2016).
41. Kandoran, M. K., Govindan, T. K. & Suryanarayana Rao, S. V. Some aspects of curing of sharks and rays. Fish Technol. 2(2), 193–197
(1965).
42. Enault, S., Auclair, C., Adnet, S. & Debiais-Thibaud, M. A complete protocol for the preparation of chondrichthyan skeletal speci-
mens. J. Appl. Ichthyol. 32(3), 409–415 (2016).
43. Montie, E. W., Manire, C. A. & Mann, D. A. Live CT imaging of sound reception anatomy and hearing measurements in the pygmy
killer whale, Feresa attenuata. J. Exp. Biol. 214, 945–955 (2011).
44. Lautenschlager, S., Bright, J. A. & Rayfield, E. J. Digital dissection-using contrast-enhanced computed tomography scanning to
elucidate hard- and soft-tissue anatomy in the Common Buzzard Buteo buteo. J. Anat. 224, 412–431 (2014).
45. Mollen, F. H., Wintner, S. P., Iglesias, S. P., Van Sommeran, S. R. & Jagt, J. W. Comparative morphology of rostral cartilages in
extant mackerel sharks (Chondrichthyes, Lamniformes, Lamnidae) using CT scanning. Zootaxa. 3340, 29–43 (2012).
46. Tomita, T., Sato, K., Suda, K., Kawauchi, J. & Nakaya, K. Feeding of the megamouth shark (Pisces: Lamniformes: Megachasmidae)
predicted by its hyoid arch: a biomechanical approach. J. Morphol. 272, 513–524 (2011).
47. Wroe, S. et al. Three-dimensional computer analysis of white shark jaw mechanics: How hard can a great white bite?. J. Zool. 276,
336–342 (2008).
48. Nakamae, Y. et al. Displacement of the large colon in a horse with enterolithiasis due to changed positions observed by computed
tomography. J. Equine. Sci. 29, 9–13 (2018).
49. Porter, E. G., Winter, M. D., Sheppard, B. J., Berry, C. R. & Hernandez, J. A. Correlation of articular cartilage thickness measure-
ments made with magnetic resonance imaging, magnetic resonance arthrography, and computed tomographic arthrography with
gross articular cartilage thickness in the equine metacarpophalangeal joint. Vet. Radiol. Ultrasound. 57, 515–525 (2016).
50. Kraitchman, D., Kamel, I., Weiss, C. & Georgiades, C. Elucidation of percutaneously accessible lymph nodes in swine: A large
animal model for interventional lymphatic research. J. Vasc. Interv. Radiol. 28, 451–456 (2017).
51. Fujinami, Y. & Tanaka, S. Age, growth and reproduction of the banded houndshark Triakis scyllium around the tip of the Izu
Peninsul, Japan. Nippon Suisan Gakk. 79(6), 968–976 (2013).
Acknowledgements
This research was supported by Basic Science Research Program through the National Research Foundation of
Korea (NRF) funded by the Ministry of Education (2018R1D1A1A02086128). This research was also supported
by the ‘Korea Research Fellowship Program’ of the National Research Foundation of Korea (NRF), Ministry
of Science and ICT (KRF: 2016H1D3A1909005). The funder had no role in study design, data collection and
analysis, decision to publish, or preparation of the manuscript.
Author contributions
A.H.L.Y. and S.W.K. designed and conceptualized the study. A.H.L.Y., C.T.C.P., and S.W.K. performed the experi-
ment, curated and analyzed the data. M.K.O., J.O.H., and C.J.L. did the MRI scanning. K.T.K. and M.C.C. did the
CT scanning. H.J.K., J.K., S.B.L., and S.G.K. helped with shark sampling, transportation, and scanning. C.T.C.P.
visualized the figures. A.H.L.Y. and S.W.K. wrote the original manuscript draft, and S.C.P., S.S.G., S.W.K., and
A.H.L.Y. revised and edited the manuscript. S.C.P. acquired the funding and supervised the whole study.
Competing interests
The authors declare no competing interests.
Additional information
Supplementary Information The online version contains supplementary material available at https://doi.
Scientific Reports | (2021) 11:1165 | https://doi.org/10.1038/s41598-020-80823-y 14
Vol:.(1234567890)www.nature.com/scientificreports/
org/10.1038/s41598-020-80823-y.
Correspondence and requests for materials should be addressed to S.C.P.
Reprints and permissions information is available at www.nature.com/reprints.
Publisher’s note Springer Nature remains neutral with regard to jurisdictional claims in published maps and
institutional affiliations.
Open Access This article is licensed under a Creative Commons Attribution 4.0 International
License, which permits use, sharing, adaptation, distribution and reproduction in any medium or
format, as long as you give appropriate credit to the original author(s) and the source, provide a link to the
Creative Commons licence, and indicate if changes were made. The images or other third party material in this
article are included in the article’s Creative Commons licence, unless indicated otherwise in a credit line to the
material. If material is not included in the article’s Creative Commons licence and your intended use is not
permitted by statutory regulation or exceeds the permitted use, you will need to obtain permission directly from
the copyright holder. To view a copy of this licence, visit http://creativecommons.org/licenses/by/4.0/.
© The Author(s) 2021
Scientific Reports | (2021) 11:1165 | https://doi.org/10.1038/s41598-020-80823-y 15
Vol.:(0123456789)You can also read