Coastal reclamation alters soil microbial communities following different land use patterns in the Eastern coastal zone of China - Nature
←
→
Page content transcription
If your browser does not render page correctly, please read the page content below
www.nature.com/scientificreports
OPEN Coastal reclamation alters
soil microbial communities
following different land use
patterns in the Eastern coastal
zone of China
Wen Yang1*, Nasreen Jeelani2, Andong Cai3, Xiaoli Cheng4* & Shuqing An2
Coastal reclamation seriously disturbs coastal wetland ecosystems, while its influences on soil
microbial communities remain unclear. In this study, we examined the impacts of coastal reclamation
on soil microbial communities based on phospholipid fatty acids (PLFA) analysis following the
conversion of Phragmites australis wetlands to different land use types. Coastal reclamation enhanced
total soil microbial biomass and various species (i.e., gram-positive bacterial, actinomycete, saturated
straight-chain, and branched PLFA) following the conversion of P. australis wetland to aquaculture
pond, wheat, and oilseed rape fields. In contrast, it greatly decreased total soil microbial biomass and
various species following the conversion of P. australis wetland to town construction land. Coastal
reclamation reduced fungal:bacterial PLFA, monounsaturated:branched PLFA ratios, whereas
increasing gram-positive:gram-negative PLFA ratio following the conversion of P. australis wetland to
other land use types. Our study suggested that coastal reclamation shifted soil microbial communities
by altering microbial biomass and community composition. These changes were driven primarily
by variations in soil nutrient substrates and physiochemical properties. Changes in soil microbial
communities following coastal reclamation impacted the decomposition and accumulation of soil
carbon and nitrogen, with potential modification of carbon and nitrogen sinks in the ecosystems, with
potential feedbacks in response to climate change.
Coastal wetlands are the transitional zone between terrestrial and marine ecosystems, which provide critical eco-
system services1, including biodiversity preservation, flooding and shoreline erosion control, and environmental
remediation2. In contrast, various anthropogenic activities, particularly coastal reclamation, are altering coastal
wetland ecosystems on a global scale3. Many Euro-American countries, for instance, the United States and Spain,
and Asian countries, such as South Korea and J apan4, have reported intensive coastal reclamation operations. The
coastal wetlands of China have been dramatically reclaimed for the development of agriculture, aquaculture3,
urbanization, and industrialization in an attempt to alleviate the conflict between a growing population and
limited land resources5. The total reclaimed coastal areas in China, from 1950–2008, was approximately 13,380
km26, which accounted for approximately half of its overall coastal wetlands. According to the land-use plan of
China, 5780 km2 of coastal wetlands will be reclaimed from 2010–2020. However, this immensely decreased
number of coastal wetland areas following reclamation has been accompanied by multiple negative effects on
coastal ecosystems, including a significant reduction in coastal habitats and biodiversity, and disrupted ecosystem
structure, processes and function, and has a far-reaching effect on their ecological s ervices6.
Coastal wetlands are recognized as one of the vital components of ‘blue carbon (C)’ sinks, as the result of
high primary productivity and low decomposition rates of soil organic matter (SOM)7. Hence, coastal wetlands
play a significant role in the global C cycle. Coastal reclamation can modify the morphologies, hydrodynamics,
1
College of Life Sciences, Shaanxi Normal University, No. 620 West Chang’an St., Chang’an Dist., Xi’an 710119,
Shaanxi, People’s Republic of China. 2School of Life Sciences and Institute of Wetland Ecology, Nanjing University,
Nanjing 210023, People’s Republic of China. 3Key Laboratory for Agro‑Environment, Ministry of Agriculture,
Institute of Environment and Sustainable Development in Agriculture, Chinese Academy of Agricultural Sciences,
Beijing 10081, People’s Republic of China. 4School of Ecology and Environmental Sciences, Yunnan University,
Kunming 650091, People’s Republic of China. *email: wenyang@snnu.edu.cn; xlcheng@fudan.edu.cn
Scientific Reports | (2021) 11:7265 | https://doi.org/10.1038/s41598-021-86758-2 1
Vol.:(0123456789)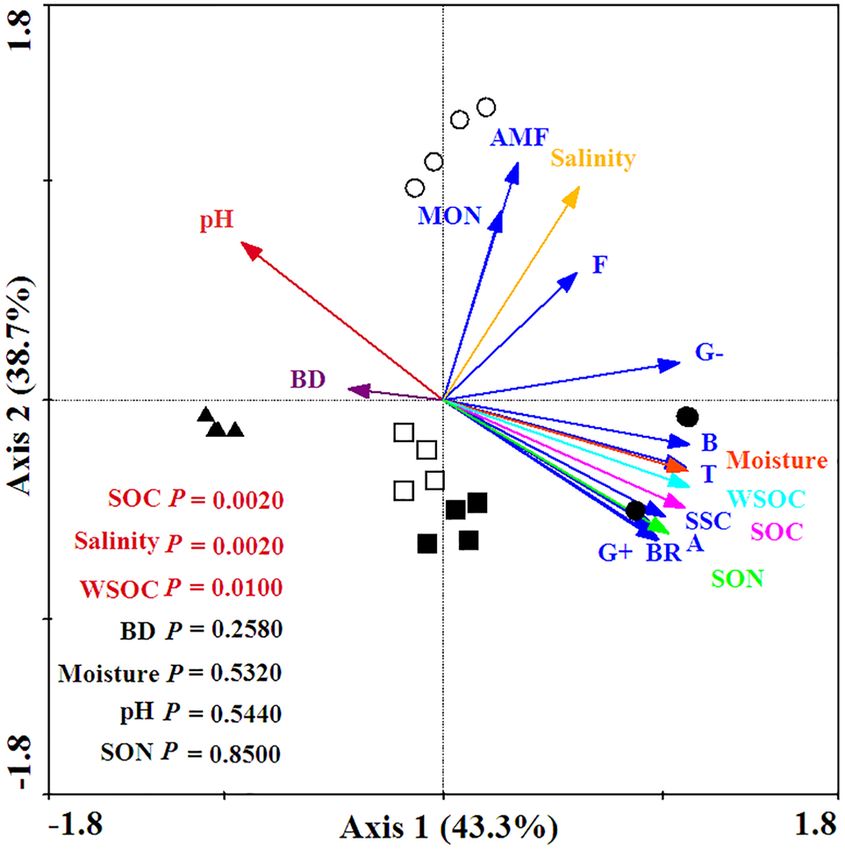
www.nature.com/scientificreports/
and sediment transport of coastlines8, toward the further alteration of the physicochemical properties of s oils6.
Ultimately, these changes alter soil organic carbon and nitrogen (SOC and SON, respectively) sequestration in
coastal wetlands9. Although the response of SOC and SON sequestration to coastal reclamation have been widely
documented2,10,11, there remains no definitive consensus. For example, Ding et al.10 revealed that SOC and SON
stocks were rapidly sequestered within an initial 50 years following the reclamation of coastal wetlands, and
then increased slowly within the reclaimed paddy soil of China’s Yangtze River Delta. However, a previous study
documented that the sequestration of soil C decreased, while C emissions accelerated, following the conversion
of coastal wetlands to farmlands and other land u ses12. These inconsistent results might have been attributed to
variable land use patterns, reclamation intensity, and field management p ractices6.
Soil microbes have vital roles in the regulation and control of soil C and nitrogen (N) cycling13. Soil micro-
bial communities are driven by topography, vegetation, soil nutrient substrates14, as well as physiochemical
properties15,16. Soil pH is considered to be one of the vital drivers that shifts the composition of microbial
communities15. Soil salinity has been observed to exert an inhibitory effect on most microbial p opulations17,
where high salinity reduces the osmotic potential of the soil, which further impacts microbial composition
and functionality16. Soil moisture has been reported to affect microbial abundance/population structures by
influencing soil aeration c onditions18. Yuan et al.19 demonstrated that high soil aeration stimulated microbial
biomass and shifted the composition of microbial communities in paddy fields. High soil aeration can increase
the fungi to bacteria ratio in farmlands. Previous investigations revealed that soil nutrient levels changed greatly,
soil pH and salinity decreased considerably, and soil aeration was enhanced following the conversion of coastal
wetlands to farmlands via diking, ditch drainage, and fresh water i rrigation5,6,20. Changes in nutrient levels and
physiochemical properties strongly drive variations in the microbial biomass and community compositions of
soils14,16. The alterations in soil microbial biomass and community composition, particularly the fungi to bac-
teria ratio, in turn, impact the turnover and sequestration of SOC and SON. Therefore, an accurate assessment
of the effects of coastal reclamation on soil microbial biomass and community compositions is critical to better
understand the influencing mechanisms of coastal reclamation on SOC and SON accumulation and decomposi-
tion in coastal wetlands.
Jiangsu province contains the most abundant coastal wetland resources in Eastern China, and is undergo-
ing intense coastal reclamation4. Currently, a large portion of the natural coastal wetlands in Jiangsu have been
reclaimed by embanking (e.g., construction of dikes, seawalls, and barriers along the coastline), and subsequent
conversion to aquaculture ponds, farmlands, and town construction lands (Fig. 1)4. Numerous studies have docu-
mented the effects of coastal reclamation on ecosystem C and N sinks, especially on SOC and SON sequestration
along the coasts of Eastern China9,11,21. Our previous study found that coastal reclamation greatly altered soil
total, labile and recalcitrant organic C and N following the conversion of coastal wetlands to different reclaimed
lands21. However, these studies set their focus primarily on the variations of SOC and SON, while their mecha-
nisms of influence on soil microbial ecology received little attention. The responses of soil microbial communities
to coastal reclamation, following the conversion of coastal wetland to aquaculture pond, farmlands, and town
construction land, and these responses whether drive the variations of SOC and SON have yet to be estimated.
We hypothesized that coastal reclamation modifies soil microbial biomass, as well as community composition by
altering soil nutrient substrates, e.g., SOC, water-soluble organic carbon (WSOC), SON and soil physiochemi-
cal properties, which in turn affects SOC and SON decomposition and accumulation following the conversion
of coastal wetland to aquaculture pond, farmland, and town construction land. To test this, we examined the
microbial biomass and community composition of the soils through phospholipid fatty acids (PLFA) analysis,
and a chloroform fumigation-extraction method. We analyzed SOC, WSOC, SON, soil moisture, salinity, pH,
and bulk density (BD) in reclaimed coastal aquaculture pond, wheat and oilseed rape fields, and town construc-
tion land by comparing them with an adjacent natural Phragmites australis wetland. The objectives of this study
were to: (1) evaluate whether the responses of soil microbial biomass and community composition to coastal
reclamation varied between different land use types; (2) identify the most important driving factors for causing
shifts in soil microbial biomass and community composition following coastal reclamation.
Results
Plant and soil physicochemical characteristics. The wheat and oilseed rape fields exhibited higher
aboveground biomass compared with the P. australis wetland (Table 1). The wheat field showed higher below-
ground biomass in contrast to the oilseed rape field (Table 1). The total biomass was highest in wheat field
followed by oilseed rape field, compared to the P. australis wetland (Table 1). The soil/sediment moisture was
highest in the aquaculture pond followed by the wheat field and oilseed rape field, in comparison with the P.
australis wetland and town construction land (Table 1). Soil/sediment pH was highest in the P. australis wetland
and lowest in the aquaculture pond (Table 1). Soil/sediment salinity in the P. australis wetland and aquaculture
pond was significantly (P < 0.05) higher than that of the wheat field, oilseed rape field, and town construction
land (Table 1). The highest soil/sediment bulk density was observed in the oilseed rape field between land use
types (Table 1). The concentrations of SOC, WSOC, and SON in the aquaculture pond, wheat field, oilseed rape
field, were significantly (P < 0.05) higher than those in the P. australis wetland (Table 1). Town construction land
revealed lower concentrations of SOC, WSOC, and SON compared to the P. australis wetland (Table 1).
Soil microbial biomass and community composition. The soil/sediment microbial biomass carbon
(MBC) concentration was highest in the aquaculture pond, followed by that of the wheat and oilseed rape fields,
relative to the P. australis wetland and the town construction land (Fig. 2a). The aquaculture pond, wheat and oil-
seed rape fields revealed higher microbial biomass nitrogen (MBN) concentration in contrast to the P. australis
wetland and the town construction land (Fig. 2b). The lowest MBC and MBN concentrations were observed in
Scientific Reports | (2021) 11:7265 | https://doi.org/10.1038/s41598-021-86758-2 2
Vol:.(1234567890)www.nature.com/scientificreports/
Figure 1. Location of the sampling site in different reclaimed coastal land use types, and a natural P. australis
wetland in the Eastern coastal zone of China. Figure generated in ArcGIS 9.3. URL link: http://desktop.arcgis.
com/zh-cn/desktop/.
Scientific Reports | (2021) 11:7265 | https://doi.org/10.1038/s41598-021-86758-2 3
Vol.:(0123456789)www.nature.com/scientificreports/
Land use types
Town construction
Characteristics P. australis wetland Aquaculture pond Wheat field Oilseed rape field land P-value
Moisture (%) 25.55 ± 0.37c 49.87 ± 1.11a 31.80 ± 1.03b 30.12 ± 1.20b 22.33 ± 0.07d < 0.001
pH 8.83 ± 0.06a 7.44 ± 0.05e 7.90 ± 0.06d 8.17 ± 0.02c 8.60 ± 0.01b < 0.001
Salinity (%) 0.53 ± 0.03a 0.31 ± 0.04b 0.07 ± 0.02d 0.18 ± 0.01c 0.03 ± 0.01d < 0.001
BD (g c m–3) 1.31 ± 0.03b 1.07 ± 0.01c 1.24 ± 0.05b 1.51 ± 0.08a 1.21 ± 0.02bc < 0.001
SOC (g k g–1) 3.43 ± 0.33d 15.07 ± 0.36a 9.50 ± 0.24b 6.90 ± 0.29c 1.86 ± 0.23e < 0.001
WSOC (mg k g–1) 82.40 ± 2.55d 125.00 ± 1.93a 107.25 ± 0.73b 98.21 ± 2.74c 57.64 ± 2.07e < 0.001
SON (g k g–1) 0.24 ± 0.02d 1.40 ± 0.05a 0.97 ± 0.02b 0.68 ± 0.02c 0.22 ± 0.03d < 0.001
–2)
AB (g m 1276 ± 120b – 2253 ± 66a 2335 ± 88a – < 0.01
–2)
BB (g m 982 ± 224ab – 1351 ± 101a 521 ± 101b – < 0.05
–2)
TB (g m 2258 ± 184c – 3604 ± 57a 2855 ± 167b – < 0.01
Table 1. Soil physiochemical properties of different land use types following coastal reclamation in the
Eastern coastal zone of China. Different superscript lower case letters indicate statistically significant
differences at the α = 0.05 level between land use types. BD bulk density, SOC soil organic carbon, WSOC soil
water-soluble organic carbon, SON soil organic nitrogen, AB aboveground biomass, BB belowground biomass,
TB total biomass.
the town construction land between land use types (Figs. 2a,b). The soil/sediment MBC:MBN ratio was highest
in the town construction land between land use types (Fig. 2c). The P. australis wetland and oilseed rape field
showed the lowest soil/sediment MBC:MBN ratio between land use types (Fig. 2c).
The total soil/sediment PLFA content in the aquaculture pond increased 1.37–5.49-fold, compared to the P.
australis wetland, wheat and oilseed rape fields, and town construction land (Fig. 3a). The contents of total, bac-
terial, gram-positive ( gram+) bacterial, actinomycete, and branched PLFA were highest in the aquaculture pond
followed by the wheat and oilseed rape fields, the P. australis wetland, and town construction land (Figs. 3 and
4). The contents of soil fungal, monounsaturated, and arbuscular mycorrhizal fungal (AMF) PLFA were highest
in the P. australis wetland between land use types (Figs. 3 and 4). The lowest total, bacterial, fungal, gram+ bacte-
rial, actinomycete PLFA contents were found in the town construction land (Figs. 3 and 4a). The soil/sediment
gram-negative (gram–) bacterial PLFA content in the aquaculture pond was significantly (P < 0.05) higher than
that in P. australis wetland, wheat and oilseed rape fields, and town construction land (Fig. 3f). The soil/sediment
gram– bacterial PLFA content in the P. australis wetland and wheat field was significantly (P < 0.05) higher than
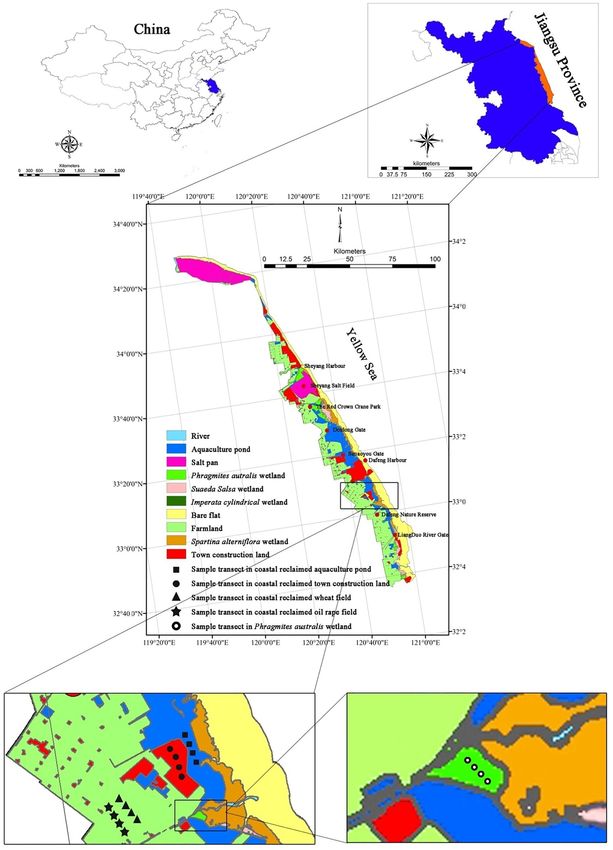
that in oilseed rape field and town construction land (Fig. 3f). The saturated straight-chain (SSC) PLFA content
was highest in the aquaculture pond between land use types (Fig. 4b). The contents of actinomycete and SSC
PLFA in wheat and oilseed rape fields was significantly (P < 0.05) higher than that in P. australis wetland and
town construction land (Fig. 4a,b).
The highest soil fungal:bacterial (F:B) PLFA ratio was observed in the P. australis wetland between land
use types (Fig. 3d). The soil F:B PLFA ratio in aquaculture pond, wheat field and town construction land was
significantly (P < 0.05) lower than that in oilseed rape field (Fig. 3d). The gram+:gram– PLFA ratio was highest
and lowest in the aquaculture pond and the P. australis wetland, respectively (Fig. 3g). The g ram+:gram– PLFA
ratio in wheat and oilseed rape fields was significantly (P < 0.05) higher than that in town construction land
(Fig. 3g). The P. australis wetland and town construction land exhibited a higher monounsaturated:branched
PLFA ratio, relative to the aquaculture pond and the wheat field (Fig. 4f). The bacterial stress index was highest
in the aquaculture pond followed by the wheat and oilseed rape fields, and town construction land, which was
lowest in the P. australis wetland (Fig. 4c).
Relationships between soil microbial communities and soil properties. Seven soil property vari-
ables that were present in the ordination explained 87.2% of the total variability of the PLFA (Fig. 5). The PLFA
variations were significantly (P < 0.05) related to SOC (F = 13.05, P = 0.0020), salinity (F = 33.20, P = 0.0020),
WSOC (F = 4.29, P = 0.0100) (Fig. 5). Pearson’s correlation analysis indicated that MBC, MBN, total PLFA, bac-
terial, gram+ bacterial, g ram− bacterial, actinomycete, saturated straight-chain, and branched PLFA had obvi-
ously positive correlations with soil moisture, SOC, WSOC, and SON, which had a negative correlation with
soil pH (Table 2). Soil AMF PLFA was highly related to soil salinity and pH (Table 2). The soil F:B PLFA ratio
was inversely associated with the SOC and SON (Table 2). The soil gram+:gram− PLFA ratio was highly corre-
lated with soil moisture, SOC, WSOC, and SON (Table 2). However, there was a significant negative correlation
between the gram+:gram− PLFA ratio and soil pH (Table 2). The soil monounsaturated:branched PLFA ratio had
a negative correlation with soil moisture (Table 2).
Discussion
Coastal reclamation enhanced the total microbial biomass (MBC, MBN and total PLFA) (Figs. 2 and 3a), and
the quantities of vast majority of microbial community composition following the conversion of P. australis
wetland to aquaculture pond, wheat, and oilseed rape fields (Figs. 3 and 4). Whereas, the MBC, MBN, bacterial,
fungal, gram– bacterial, AMF, actinomycete, and monounsaturated PLFA substantially decreased following the
Scientific Reports | (2021) 11:7265 | https://doi.org/10.1038/s41598-021-86758-2 4
Vol:.(1234567890)www.nature.com/scientificreports/
300
a
(a) P < 0.01
250
b
MBC (mg kg-1)
200
c
150
100 d
50 e
0
PW AP WF OR TC
100
(b) P < 0.01
80 a a
a
MBN (mg kg-1)
60
b
40
20
c
0
PW AP WF OR TC
8
(c)
P < 0.05
6 a
MBC : MBN ratio
ab
4
bc
c c
2
0
PW AP WF OR TC
Land use types
Figure 2. (a) Soil microbial biomass carbon (MBC), (b) Soil microbial biomass nitrogen (MBN) and (c) the
MBC:MBN ratio of different land use types following coastal reclamation in the Eastern coastal zone of China.
Different letters over the bars indicate statistically significant differences at α = 0.05 level between land use
types. PW Phragmites australis wetland, AP aquaculture pond, WF wheat field, OR oilseed rape field, TC town
constructive land. Statistically significant differences in this figure were carried out with SPSS statistical software
(Version 24.0, URL link: https://www.ibm.com/products/spssstatistics?lnk=STW_US_STESCH_P1_BLK&
lnk2=trial_SPSSstat&lot=1&pexp=def&psrc=none&mhsrc=ibmsearch_a&mhq=spss).
Scientific Reports | (2021) 11:7265 | https://doi.org/10.1038/s41598-021-86758-2 5
Vol.:(0123456789)www.nature.com/scientificreports/
4000 a 2000
Bacterial PLFA (ng g dry soil)
a
Total PLFA (ng g-1 dry soil)
(a) (b)
P < 0.01 P < 0.01
3000 1500
-1
2000 b 1000
b
c
cd c c
1000 500
d d
0 0
PW AP WF OR TC PW AP WF OR TC
160 .5
Fungal PLFA (ng g-1 dry soil)
140 (c) (d)
P < 0.01
P < 0.01 .4
120 a
F : B PLFA ratio
100 a
.3
80 b b
b
60 .2
40 bc c
c .1 c
c
20
0 0.0
PW AP WF OR TC PW AP WF OR TC
1200 1200
a
Gram+ PLFA (ng g-1 dry soil)
Gram- PLFA (ng g-1 dry soil)
1000 (e) 1000 (f)
P < 0.01 P < 0.01
800 800
a
600 b 600
c b b
400 400
d c
d c
200 200
0 0
PW AP WF OR TC PW AP WF OR TC
2.5 80
a
AMF PLFA (ng g-1 dry soil)
(g) (h)
Gram+ : Gram- PLFA ratio
2.0 P < 0.01 P < 0.01
60
b b
1.5 a
c 40
1.0
d
20 b
.5
c c c
0.0 0
PW AP WF OR TC PW AP WF OR TC
Land use types
Figure 3. (a) Soil total phospholipid fatty acids (PLFA), (b) Bacterial PLFA, (c) Fungal PLFA concentrations;
(d) Fungal:Bacterial (F:B) PLFA ratio; (e) Gram– PLFA, (f) Gram+ PLFA concentrations, (g) Gram+:Gram–
PLFA ratio and (h) the arbuscular mycorrhizal fungal (AMF) PLFA concentrations of different land use types
following coastal reclamation in the Eastern coastal zone of China. Different letters over the bars indicate
statistically significant differences at α = 0.05 level between land use types. See Fig. 2 for abbreviations.
Statistically significant differences in this figure were carried out with SPSS statistical software (Version 24.0,
URL link: https://www.ibm.com/products/spssstatistics?lnk=STW_US_STESCH_P1_BLK&lnk2=trial_SPSSs
tat&lot=1&pexp=def&psrc=none&mhsrc=ibmsearch_a&mhq=spss).
Scientific Reports | (2021) 11:7265 | https://doi.org/10.1038/s41598-021-86758-2 6
Vol:.(1234567890)www.nature.com/scientificreports/
Actinomycete PLFA (ng g-1 dry soil)
250 2500
a
(a) P < 0.01 a P < 0.01
SSC PLFA (ng g-1 dry soil)
(b)
200 b 2000
150 1500
c
100 d 1000
e b
b
50 500 c c
0 0
Monounsaturated PLFA (ng g-1 dry soil)
PW AP WF OR TC PW AP WF OR TC
16 500
a
14 (c) P < 0.01 (d) P < 0.01
400
Bacterial stress index
a
12 ab
10 300
8 b
bc 200 bc
6 bc
c
4
100
2 c c
0 0
PW AP WF OR TC PW AP WF OR TC
Monounsaturated : Branched PLFA ratio
1400 2.0
a
Branched PLFA (ng g dry soil)
1200 (e) P < 0.001 (f) P < 0.001
a
1000 1.5
-1
b
800
1.0
600 c b
400 d bc
d .5 c
200 c
0 0.0
PW AP WF OR TC PW AP WF OR TC
Land use types
Figure 4. (a) Soil actinomycete phospholipid fatty acids (PLFA), (b) Saturated straight-chain (SSC)
PLFA, (c) Bacterial stress index, (d) Soil monounsaturated PLFA, (e) Branched PLFA concentrations, (f)
Monounsaturated:branched PLFA ratio of different land use types following coastal reclamation in the Eastern
coastal zone of China. Different letters over the bars indicate statistically significant differences at α = 0.05 level
between land use types. See Fig. 2 for abbreviations. Statistically significant differences in this figure were carried
out with SPSS statistical software (Version 24.0, URL link: https://www.ibm.com/products/spssstatistics?lnk=
STW_US_STESCH_P1_BLK&lnk2=trial_SPSSstat&lot=1&pexp=def&psrc=none&mhsrc=ibmsearch_a&mhq=
spss).
conversion of P. australis wetland to town construction land (Figs. 2, 3 and 4). These variation trends of soil
microbial communities following coastal reclamation was in according with the results of our previous study
showing that coastal reclamation enhanced the accumulation of soil total, labile and recalcitrant organic C and
N following conversion of P. australis salt marsh into fishpond, wheat and rapeseed fi elds21. Whereas, coastal
reclamation decreased the sequestration of soil total, labile and recalcitrant organic C and N following conver-
sion of P. australis salt marsh into town construction land21. Previous studies reported that the SOC and SON
Scientific Reports | (2021) 11:7265 | https://doi.org/10.1038/s41598-021-86758-2 7
Vol.:(0123456789)www.nature.com/scientificreports/
Figure 5. RDA results of PLFA in the soil samples and environmental variables. The explanatory variables are
show via different arrows: PLFA profiles are solid blue arrows: total PLFA (T); bacterial PLFA (B); fungal PLFA
(F); gram-positive bacterial PLFA (G+); gram-negative bacterial PLFA ( G–); arbuscular mycorrhizal fungal
PLFA (AMF); actinomycete PLFA (A); saturated straight-chain PLFA (SSC), monounsaturated PLFA (MON);
branched PLFA (BR); and environmental variables are the solid colored arrows: moisture, pH, salinity, bulk
density (BD), soil organic carbon (SOC), soil water-soluble organic carbon (WSOC), soil organic nitrogen
(SON). Open circles represent P. australis soil, filled circles represent the sediment of the aquaculture pond,
filled squares represent the soil of the wheat field, open squares represent the soil of oilseed rape field, filled
triangles represent the soil of the town constructive land. The statistical significance of the RDA was tested using
the Monte Carlo permutation test (499 permutations; P < 0.05). Figure was carried out with CANOCO software
(Version 4.5, URL link: http://canoco.software.informer.com/4.5/).
Moisture pH Salinity BD SOC WSOC SON
MBC 0.863** –0.890** 0.109 –0.300 0.937** 0.912** 0.934**
MBN 0.626** –0.690** 0.146 0.049 0.752** 0.830** 0.754**
MBC:MBN ratio 0.147 –0.171 –0.370 –0.525* 0.060 –0.178 0.087
Total PLFA 0.949** –0.858** 0.222 –0.542* 0.929** 0.816** 0.895**
Bacterial PLFA 0.965** –0.831** 0.269 –0.559* 0.917** 0.811** 0.876**
Fungal PLFA 0.034 0.280 0.887** 0.107 –0.081 0.061 –0.181
Fungal:Bacterial (F:B) PLFA ratio –0.396 0.643** 0.677** 0.355 –0.496* –0.305 –0.570**
Gram+ bacterial PLFA 0.969** –0.926** 0.071 –0.526* 0.967** 0.858** 0.951**
Gram− bacterial PLFA 0.833** –0.651** 0.504* –0.523* 0.799** 0.744** 0.733**
Gram+ : Gram− PLFA ratio 0.769** –0.919** –0.367 –0.226 0.843** 0.777** 0.885**
AMF PLFA –0.163 0.508* 0.889** –0.001 –0.283 –0.171 –0.390
Actinomycete PLFA 0.897** –0.929** 0.001 –0.413 0.968** 0.919** 0.966**
Saturated straight-chain PLFA 0.965** –0.848** 0.178 –0.545* 0.902** 0.764** 0.872**
Monounsaturated PLFA –0.184 0.403 0.774** 0.062 –0.215 –0.046 –0.296
Branched PLFA 0.959** –0.938** 0.046 –0.505* 0.976** 0.877** 0.964**
Monounsaturated: Branched PLFA ratio –0.539** 0.777** 0.651** 0.172 –0.635** –0.489* –0.710**
Table 2. Correlation analysis of soil physiochemical properties and microbial communities between land
use types following coastal reclamation in the Eastern coastal zone of China. MBC microbial biomass carbon,
MBN microbial biomass nitrogen, PLFA phospholipid fatty acids, Gram+ gram-positive, Gram– gram-negative,
AMF arbuscular mycorrhizal fungal. See Table 1 for abbreviations. *P < 0.05; **P < 0.01.
Scientific Reports | (2021) 11:7265 | https://doi.org/10.1038/s41598-021-86758-2 8
Vol:.(1234567890)www.nature.com/scientificreports/
concentrations were determined by organic detritus input, sequestered C and N via bio-chemical and physical
processes, loss of organic C and N through SOM decomposition, and erosion and l eaching22. Chen et al.23 showed
that approximately 30% of the fish food introduced into aquaculture pond was not consumed, which eventually
settled into the sediment of aquaculture pond through a series of decomposition processes in the Jiangsu coast.
It was reasoned that SOC, WSOC, and SON were highest in the aquaculture pond between land use types, that
were largely due to the substantial amount of organic detritus (e.g., organism feces, feed remnants, and partial
residual bodies) inputting into the sediment of the aquaculture pond, and ultimately promoted sediment organic
C and N sequestration in the aquaculture pond (Table 1)21,23. In addition, sediment in the aquaculture pond
was immersed in water which provided an anaerobic environment in the sediment. We deduced that high sedi-
ment moisture and anaerobic environment in the aquaculture pond were beneficial for sediment organic C and
N accumulation over the long-term (Table 1)21,24, as SOM accumulated under anaerobic and/or waterlogged
conditions (e.g., aquaculture pond) exhibited a lower decomposition r ate25.
High alkalinity and salinity are basic features of coastal wetlands20, which are the primary limiting factors
for agricultural production in coastal zones5,26. Grybos et al.27 reported that high soil pH can lead to insuffi-
cient nutrients for crop growth owing to promoting the immobilization of manganese, iron, and zinc in soils.
Krishnamoorthy et al.28 documented that high soil salinity severely restricted plant growing, which caused
physiological drought to plants, cell toxicity, and nutrient imbalance for crops. Currently, fresh water irrigation
has been regarded as a very effective measure to dealkali and desalinate the soil to accommodate the growth of
crops following the reclamation of coastal wetlands5,20,21. In this study, we found that SOC and SON levels greatly
increased following conversion of P. australis salt marsh into wheat and rapeseed fields (Table 1). This result is
consistent with previous studies, which revealed that reclaimed farmlands effectually promoted SOC and SON
sequestration by altering hydrological regimes from ditch drainage, diking, and irrigation, and lower soil pH and
salinity relative to coastal wetlands11,21. It was inferred that greatly decreased soil pH and salinity, and increased
inputs of aboveground biomass, as well as the application of chemical fertilizers contributed to greater SOC and
SON accumulation in the wheat and oilseed rape fields compared to P. australis wetland (Table 1)21. Conversely,
SOC, WSOC, and SON levels were lowest in town construction land (Table 1), which may have been owing to
the loss of vegetative cover and without exogenous organic detritus entering the soil.
Coastal reclamation greatly shifted soil/sediment microbial biomass and community composition (Figs. 2,
3 and 4). In this study, the redundancy analysis (RDA) clearly showed that the variations in soil microbial com-
munity were the most intimately related to SOC, salinity, and WSOC (Fig. 5), which further demonstrated that
soil nutrient substrates (e.g., SOC, WSOC, and SON) were the overarching driving factors for soil microbial
communities29, especially for soil bacteria and fungi30, 31, as they provided a great quantity of available nutrients
for soil m icrobes32, and played crucial roles in altering the composition of microbial communities for resource
competition33. Additionally, previous studies demonstrated that high soil salinity has a considerable effect on
growth34, quantity and structure17 of soil microbes, as well as inhibited extracellular enzyme activity through
altering the habitat of soil m icrobes35. Aside from SOC, soil salinity, and WSOC, the Pearson’s correlation analy-
sis indicated that the total and the vast majority of soil microbial compositions were highly correlated with soil
moisture, which were significantly negatively related to soil pH (Table 2). This finding was supported by previous
studies suggesting that soil pH and moisture played vital roles in altering soil microbial biomass and community
composition15,18,19. Thus, we extrapolated that greatly increased soil/sediment microbial biomass (MBC, MBN
and total PLFA), as well as various microbial community composition (i.e., gram-positive bacterial, actinomycete,
saturated straight-chain, and branched PLFA) following the conversion of P. australis wetland to aquaculture
pond, wheat, and oilseed rape fields were primarily attributed to the higher level of soil nutrient substrates, and
decreased soil salinity and pH which lifted the restriction of high salinity and alkalinity on the growth of soil
microbial communities in aquaculture pond, wheat, and oilseed rape fields (Tables 1 and 2; Figs. 2, 3, and 4).
Among soil microbes, AMF community plays a crucial role in enhancement of nutrient uptake and the toler-
ance of their host plants to various environmental s tresses36,37. Interestingly, we found that the quantity of AMF
PLFA substantially reduced following the conversion of P. australis wetland to other soil land use types (Fig. 3h).
This result was supported by Cui et al.37 exhibiting that coastal reclamation negatively affects AMF community
structure and diversity in coastal saline-alkaline lands during the past 30 years of reclamations. Previous studies
demonstrated that soil salinity and pH were the dominant factors driving structure and the distribution of soil
AMF community37,38. Our Pearson’s correlation analysis displayed that soil AMF PLFA was highly related to soil
salinity and pH (Table 2). Coastal wetland is the buffer zone between the sea and land, and it is characterized
by its high salinity, high pH, low nutrient substrates, varied temperatures, and an unstable sandy s ubstrate39. It
was deduced that AMF community played a vital role in the coastal wetlands ecosystem, and the most enriched
AMF community in P. australis wetland can provide more nutrient elements (e.g., N and P) for P. australis com-
munity, and assist P. australis community to adapt oligotrophic and extreme environment with multiple stresses
(Table 1 and Fig. 3h)36,37. When soil properties tended to be stable and the needed nutrients for plant growth
raised (Table 1), the role of AMF community altered and their quantity became less (Fig. 3h)37.
The F:B PLFA ratio is considered to be a key index for evaluating the responses of fungal and bacterial bio-
mass to environmental v ariabilities32,40. Interestingly, coastal reclamation significantly (P < 0.05) increased soil
bacterial PLFA following the conversion of P. australis wetland to aquaculture pond and wheat field (Fig. 3b),
whereas soil fungal PLFA and the F:B PLFA ratio substantially decreased following coastal reclamation (Fig. 3c,d).
Previous studies have documented that the availability of soil nutrient is the dominating factor that impacts
the F:B PLFA r atio32. The responses of soil bacterial and fungal communities to the availability of soil nutrient
can entirely d iffer32,41–43. Generally, soil bacterial communities with higher organic matter inputs, combined
with plentiful available nutrients are more remarkably abundant compared with fungal communities32,43. Soil
fungal communities have the capacity to degrade more recalcitrant organic materials and prefer nutrient-poor
environments41,42. Wang et al.44 documented that the F:B PLFA ratio has significant negative correlation with
Scientific Reports | (2021) 11:7265 | https://doi.org/10.1038/s41598-021-86758-2 9
Vol.:(0123456789)www.nature.com/scientificreports/
soil nutrient availability. Thus, the highest quantity of soil fungal PLFA and F:B PLFA ratio in the P. australis
wetland may have been primarily attributed to low nutrient availability which promoted the growth of fungi
rather than bacteria, as bacteria favor nutrient-rich conditions45, while fungi prefer conditions with low nutrient
levels (Fig. 3c,d)46.
The gram+:gram– PLFA ratio is recognized as an important indicator for microbial community structures
and ecological f unctions47. In this study, the g ram+:gram– PLFA ratio ranged from 0.52 to 1.90 between land use
types (Fig. 3g), which exhibited that g ram− bacteria dominated in the P. australis wetland, and g ram+ bacteria
dominated in the reclaimed land use types. Coastal reclamation greatly raised gram+:gram– PLFA ratio follow-
ing the conversion of P. australis wetland to other land use types (Fig. 3g). Previous studies have reported that
gram+ bacteria are considered as oligotrophic K-strategists44,48, which prefer to utilize recalcitrant soil C (e.g.,
SOM-derived C) as an energy source, with slow growing rates49. Conversely, gram− bacteria favor soils with
easily degradable organic substances (e.g., plant materials and fungal exudates) as carbon s ources42, which
are viewed as copiotrophic r-strategists44,48. However, our the Pearson’s correlation analysis showed that the
gram+:gram− PLFA ratio was positively correlated with SOC, WSOC, and SON (Table 2), which was consistent
with the results presented by Xu et al.47 and Luo et al.50. Further, earlier study reported that soil pH plays a cru-
cial role in modifying the composition of bacterial c ommunities51. Rousk et al.15 confirmed that gram– bacteria
biomass increases, while g ram+ bacteria biomass decreases, in response to higher soil pH. It may be presumed
that the lowest gram+:gram– PLFA ratio in the P. australis wetland may be partly the result of the highest soil pH
in the P. australis wetland, which promoted g ram– bacteria growth (Fig. 3g)15,52. This deduction was supported
by our finding that the g ram+:gram− PLFA ratio exhibited a significant negative correlation to soil pH (Table 2).
Typically, the bacterial stress index may be employed to indicate the physiological status of gram– bacteria
communities53. A high bacterial stress index represents a slow growth phase a slow rate of growth and slow
turnover of g ram– bacteria, as the result of being affected by various stresses, such as low p H54,55. The bacterial
stress index was highest in the aquaculture pond (Fig. 4c), which suggested that a low rate of growth and slow
turnover of gram– bacteria was observed in the aquaculture pond relative to gram+ bacteria due to high stress
from the lowest soil pH (Table 1; Figs. 3g and 4c).
The soil monounsaturated:branched PLFA ratio can indicate the relative ratio of aerobic to anaerobic
microbes32,54,56. The soil monounsaturated:branched PLFA ratio was highest in the P. australis wetland (Fig. 4f),
which implied that P. australis wetland possessed the highest proportion of aerobic microbes between land use
types. This was tightly associated with the lowest soil moisture and high soil aeration in the P. australis wetland
(Table 1). Contrarily, the lowest soil monounsaturated:branched PLFA ratio was observed in the aquaculture
pond (Fig. 4f), which indicated that it had the highest proportion of anaerobic microbes between land use types.
This result was likely caused by high anaerobic state (i.e., flooded conditions) of the sediment in the aquaculture
pond (Table 1), which is beneficial for the growth of anaerobic microbes (Fig. 4e). The highest proportion of
anaerobic microbes were accompanied by high anaerobic environment can slow down the decomposition of
SOM (Fig. 4e)24, and promote SOC and SON sequestration in the aquaculture pond (Table 1)32.
In conclusion, this study emphasized the shifts in soil microbial biomass and community composition in P.
australis wetland that have been converted to different land use types in the Eastern coastal zone of China. Our
study suggested that coastal reclamation altered the soil microbial biomass and community composition through
the modification of soil nutrient substrates (SOC, WSOC, and SON) and physiochemical properties (e.g., soil
salinity, pH and moisture) of the soil. Coastal reclamation greatly altered the F:B PLFA, gram+:gram– PLFA, and
monounsaturated:branched PLFA ratios. These changes in microbial community structures were involved in
regulation of SOC and SON decomposition and accumulation. This study offers new insights toward a better
understanding of the consequences of coastal reclamation to ecosystem processes and functions, as well as the
further elucidation of variations in, and drivers of, soil microbial communities.
Methods
Study site and sampling. This study was conducted in the Yancheng Yellow Sea coast of Jiangsu Province,
China (Fig. 1). Specific sampling transects were located next to the Dafeng Nature Reserve (32°00′–33°15′ N,
120°40′–121°00′ E; Fig. 1). This area has an annual average temperature of 14.4 °C and an annual average pre-
cipitation of 1088 mm. The natural vegetations of the Yancheng Yellow Sea coast are listed from sea to inland:
Spartina alterniflora, Suaeda salsa, Imperata cylindrica, and P. australis communities (Fig. 1)32. Over the last
century, the wetlands of the Jiangsu coast have undergone intensive reclamation11. At present, most of coastal
wetlands have been reclaimed and converted to aquaculture ponds, farmlands, and town construction lands,
particularly in Dafeng and Sheyang counties (Fig. 1). Wheat (Triticum aestivum L.) and oilseed rape (Brassica
campestris L.) fields are widely distributed along the middle Jiangsu coast. P. australis wetlands are the easiest to
reclaim to other land use types due to their growing further inland, as they are farthest from the sea, relative to
S. alterniflora, S. salsa, and I. cylindrica salt marshes (Fig. 1)21.
In June 2016, four sample transects of 40 m × 40 m were selected in each land use type, i.e., P. australis wetland
(control), aquaculture pond, wheat field, oilseed rape field, and town construction land (Fig. 1), respectively,
where there was a distance of 100 m between any two adjacent sample transects in each land use type. Satellite
images (1975, 1991, 2000, 2006, 2010, and 2013 year) from the Landsat Thematic Mapper and historical records
of the Yancheng Yellow Sea coast of Jiangsu Province were analyzed to identify the reclamation time of land
use types and the types of natural salt marsh prior to coastal reclamation in the sampling region. The aquacul-
ture ponds, wheat fields, and oilseed rape fields in the sample transects had been reclaimed for approximately
25 years, and were originally P. australis wetlands21. The aquaculture ponds in the sample transects were mainly
used for raising silver carps. The wheat fields in the sample transects were used to plant winter wheats, and the
oilseed rape fields in the sample transects were planted with winter oilseed rapes, and their yields or biomass had
Scientific Reports | (2021) 11:7265 | https://doi.org/10.1038/s41598-021-86758-2 10
Vol:.(1234567890)www.nature.com/scientificreports/
reached the maximum due to the sampling time is the ripe season for winter wheats and winter oilseed rapes.
The town construction lands in the sample transects had been established for 6 years, which suffered continual
coastal reclamation from P. australis wetlands in 1975, to aquaculture ponds in 1991, and were further converted
to town construction lands in 2 01021. The town construction lands in the sample transects were selected in the
open spaces around the buildings of the urban construction, and the open spaces were the lands rather than
cement or brick floors, and the open spaces were little vegetation cover due to intensive artificial disturbance.
Due to the significant extent of P. australis wetlands being reclaimed to farmlands, aquaculture ponds, and town
construction lands, only a small area of P. australis wetland remained in the sampling region (Fig. 1). For this
study, we randomly selected three 2 m × 2 m plots in each transect, and three sites were selected for the collection
of soil samples from each plot. Subsequently, soil samples from each plot were thoroughly mixed to yield a final
soil sample. We randomly established three 0.5 m × 0.5 m quadrats to gather all aboveground plant materials
and dug three soil blocks (0.15 m long × 0.15 m wide × 0.30 m deep) to gather all of the roots from each transect
of the P. australis wetland, wheat field, and oilseed rape field.
Analysis of plant and edaphic properties. Each root-sampling block was put through a 0.15 mm sieve
and repeatedly flushed with water; the roots remaining in the sieve were then collected9. The aboveground plant
materials and roots were carefully cleaned and oven-dried at 65 °C to a constant weight to determine the plant
biomass. The soil BD was determined using a cutting ring method. Fresh soil subsamples were oven-dried at
105 °C to a constant weight to measure the soil moisture32. Plant debris, soil fauna, and rocks in the soil samples
were removed, which were then fully mixed and separated into three subsamples. The first subsample was air-
dried and sifted using 1 mm sieve to analyze the soil pH, salinity, SOC, and SON. The second subsample was
sifted using a 2 mm sieve and stored at 4 °C to examine WSOC, MBC and MBN. The third subsample was sifted
using a 2 mm sieve and stored at –80 °C after freeze-drying and was used to determine the PLFA. The soil pH
was determined in a 1:2.5 soil to water suspension using a digital pH meter. The soil salinity was determined in
a 1:5 soil to water suspension. The SOC and SON concentrations were quantified using a CN elemental analyzer
(Vario Micro CHNS analyzer, Germany), where prior to determination, the soil samples were added to 1 M HCl
to eliminate inorganic C and N. The determination of WSOC proceeded according to the technique described
by Yang et al.32.
Analyses of soil microbial biomass and community composition. The soil MBC and MBN were
measured via chloroform fumigation-extraction57. Fresh soil samples (25 g dry weight equivalent for soil micro-
bial biomass) were fumigated for 48 h with ethanol-free chloroform at 25 °C in the dark. Additional aliquots
of fresh soil were employed as unfumigated controls. Both the fumigated and unfumigated samples were then
extracted with 100 mL of 0.5 M K2SO4 by agitating for 30 min at 200 rpm using a reciprocal shaker, after which
the K2SO4 extracts were passed through 0.45 μm filters. Soil extractable organic C and total N by K 2SO4 extracts
was quantified with a Liqui TOCII analyzer and the Kjeldahl method, respectively. MBC and MBN were cal-
culated according to the equation: MBC = Ec/0.38, MBN = En/0.54, where Ec and En are organic C and total
nitrogen (TN) extracted from fumigated soil, subtracted organic C, and TN extracted from unfumigated soil,
respectively.
The PLFA analysis was used to determine soil microbial biomass and community composition58. The PLFA
was determined in accordance with the procedure previously described by Bossio and S cow58 and Yang et al.32.
Briefly, 8 g of a dry weight-equivalent of the soil subsamples was extracted in 23 mL of a chloroform: methanol:
phosphate buffer mixture (1:2:0.8, v/v/v). The extraction was decanted into a separatory funnel and added to
12 mL of C HCl3 and 12 mL of phosphate buffer following centrifugation. The separatory funnel was shaken for
2 min., and the extracts were layered overnight. The CHCl3 layer was collected and dried under N2 at 32 °C,
whereas the lipids were re-dissolved in chloroform and fractionated on a 0.5-g silica gel solid-phase extraction
column (Supelco, Bellefonte, PA). Neutral and glycol lipids were eluted by 5 mL of C HCl3 and 10 mL of acetone.
Polar lipids were collected via 5 mL of methanol, dried under N 2 at 32 °C, and then subjected to a mild-alkali
methanolysis to recover the PLFA as methyl esters. The samples were re-dissolved in 200 mL of hexane solvent
containing nonadecanoic acid methyl ester (19:0) as an internal standard. The samples were analyzed using a
Hewlett-Packard 6890 Gas Chromatograph equipped with an Ultra 2-methylpolysiloxane column with N 2 as
the carrier gas, and H 2 and air to support the flame. A 2-μL injection of the above dilution with a 1:50 split was
employed at 250 °C for the injector and 300 °C for the detector. The oven temperature was ramped from 170 °C
to 300 °C at 5 °C/min–1 and was maintained for 12 min.. The peaks were identified using bacterial fatty acid
standards and MIDI peak identification software (Version 6.2, MIDI Inc., Newark, DE, US, URL link: http://
midi-inc.com/index.html). The quantities (ng g–1 dry soil) of the PLFA in each sample were analyzed using an
internal standard (19:0, 5 μg mL–1). The quantities of the PLFA in each sample were expressed as ng PLFA g –1
dry soil and were used to estimate the microbial biomass. The bacterial biomass was indicated by the biomark-
ers i14:0, i15:0, a15:0, 15:0, i16:0, i17:0, a17:0, 17:0, cy17:0, 14:1ω5c, 15:1ω6c, 16:1ω7c, and 18:1ω7c44,56,58,59.
Indicators of gram+ bacteria included i13:0, i14:0, i15:0, a15:0, i16:0, a16:0, i17:0, and g ram– bacteria included
14:1ω5c, 15:1ω6c, 16:1ω7, 16:1ω9c, 17:1ω8c, 18:1ω7c, 12:0 2OH, 15:0 3OH, 16:1 2OH, cy17:0, cy19:0 ω8c, and
18:1ω7c 11-methyl32,56,60. The fungal biomass was quantified by the sum of the PLFA 18:1ω9c, 18:2ω6,9c, and
20:1ω9c59,60. The AMF biomass was assessed by the PLFA 16:1ω5c9,56,60. The 10me 16:0 and 10me 17:0 biomark-
ers were used as representatives of the Actinomycete b iomass54. The monounsaturated PLFA was quantified by
the sum of 14:1ω5c, 15:1ω6c, 16:1ω5c, 16:1ω7c, 16:1ω9c, 17:1ω8c, 18:1ω7c, 18:1ω9c, and 20:1ω9c9,54,56. The sum
of i13:0, i14:0, i15:0, a15:0, i16:0, a16:0, i17:0, a17:0, 10me 16:0, 10me 17:0, 12:0 2OH, 15:0 3OH, and16:1 2OH
were used as indicators of branched PLFA54,56,58. The SSC PLFA was indicated by the biomarkers 12:0, 13:0, 14:0,
15:0, 16:0, 17:0, 18:0, and 20:056,58. The total PLFA of soil microbial communities was calculated by the sum of
Scientific Reports | (2021) 11:7265 | https://doi.org/10.1038/s41598-021-86758-2 11
Vol.:(0123456789)www.nature.com/scientificreports/
the fungal PLFA, g ram+ bacterial PLFA, g ram– bacterial PLFA, AMF PLFA, actinomycete PLFA, SSC PLFA, and
20:4ω6,9,12,15c. The F:B PLFA, gram+:gram– PLFA, and monounsaturated:branched PLFA ratios were calculated
from the above PLFAs. Bacterial stress indexes, indicating the microbial physiological status under environmental
stresses, were typically represented by cy17:0:16:1ω7c9.
Statistical analyses. One-way analysis of variance (ANOVA) was employed to analyze the impacts of coastal
reclamation on soil and plant characteristics, SOC, SON, microbial biomass, and various types of PLFA using
SPSS statistical software (Version 24.0, URL link: https://www.ibm.com/products/spssstatistics?lnk=STW_US_
STESCH_P1_BLK&lnk2=trial_SPSSstat&lot=1&pexp=def&psrc=none&mhsrc=ibmse arch_a&mhq = spss).
Pearson’s correlation analysis was used to evaluate the relationship between the C and N fractions of the soil, and
microbial biomass with soil physiochemical properties. Linear regression analysis was performed to determine
the relationship between soil C and N, and the soil microbial biomass with plant biomass between the P. australis
wetland, wheat field, and oilseed rape fields. The relationships between the soil microbial communities (all types
of PLFA) and soil properties were conducted using RDA with CANOCO software (Version 4.5, URL link: http://
canoco.software.informer.com/4.5/). The statistical significance of the RDA was tested using the Monte Carlo
permutation test (499 permutations; P < 0.05). The map in the Fig. 1 was generated using the ArcGIS software
(Version 9.3, URL link: http://desktop.arcgis.com/zh-cn/desktop/).
Received: 12 October 2020; Accepted: 9 March 2021
References
1. Murray, N. J. et al. The global distribution and trajectory of tidal flats. Nature 565(7738), 222 (2019).
2. Bu, N. S. et al. Reclamation of coastal salt marshes promoted carbon loss from previously-sequestered soil carbon pool. Ecol. Eng.
81, 335–339 (2015).
3. Cui, B. S., He, Q., Gu, B. H., Bai, J. H. & Liu, X. H. China’s coastal wetlands: understanding environmental changes and human
impacts for management and conservation. Wetlands 36(Suppl 1), S1–S9 (2016).
4. Cao, Z. Q. et al. Heavy metal pollution and the risk from tidal flat reclamation in coastal areas of Jiangsu, China. Mar. Pollut. Bull.
158, 111427 (2020).
5. Yin, A. J. et al. Salinity evolution of coastal soils following reclamation and intensive usage, Eastern China. Environ. Earth Sci. 75,
1281 (2016).
6. Wang, W., Liu, H., Li, Y. Q. & Su, J. L. Development and management of land reclamation in China. Ocean Coast. Manage. 102,
415–425 (2014).
7. Laffoley, D. & Grimsditch, G. The Management of Natural Coastal Carbon Sinks (IUCN, 2009).
8. Cheong, S. et al. Coastal adaptation with ecological engineering. Nat. Clim. Change 3, 787–791 (2013).
9. Yang, W. et al. Seawall construction alters soil carbon and nitrogen dynamics and soil microbial biomass in an invasive Spartina
alterniflora salt marsh in eastern China. Appl. Soil Ecol. 110, 1–11 (2017).
10. Ding, L. J., Su, J. Q., Li, H., Zhu, Y. G. & Cao, Z. H. Bacterial succession along a long-term chronosequence of paddy soil in the
Yangtze River Delta, China. Soil Biol. Biochem. 104, 59–67 (2017).
11. Zhang, H. et al. Changes in surface soil organic/inorganic carbon concentrations and their driving forces in reclaimed coastal tidal
flats. Geoderma 352, 150–159 (2019).
12. Han, G. X. et al. Agricultural reclamation effects on ecosystem C O2 exchange of a coastal wetland in the Yellow River Delta. Agr.
Ecosyst. Environ. 196, 187–198 (2014).
13. Hargreaves, S. K. & Hofmockel, K. S. Physiological shifts in the microbial community drive changes in enzyme activity in a peren-
nial agroecosystem. Biogeochemistry 117, 67–79 (2014).
14. Ramirez, K. S., Lauber, C. L., Knight, R., Bradford, M. A. & Fierer, N. Consistent effects of nitrogen fertilization on soil bacterial
communities in contrasting systems. Ecology 91, 3463–3470 (2010).
15. Rousk, J., Brookes, P. C. & Bååth, E. The microbial PLFA composition as affected by pH in an arable soil. Soil Biol. Biochem. 42,
516–520 (2010).
16. Kamble, P. N., Gaikwad, V. B., Kuchekar, S. R. & Bååth, E. Microbial growth, biomass, community structure and nutrient limitation
in high pH and salinity soils from Pravaranagar (India). Eur. J. Soil Biol. 65, 87–95 (2014).
17. Gao, Y. C. et al. Effects of salinization and crude oil contamination on soil bacterial community structure in the Yellow River Delta
region, China. Appl. Soil Ecol. 86, 165–173 (2015).
18. Placella, S. A., Brodie, E. L. & Firestone, M. K. Rainfall - induced carbon oxide pulses results from sequential resuscitation of
phylogenetically cluster microbial groups. Proc. Natl. Acad. Sci. 109, 10931–10936 (2012).
19. Yuan, Y. et al. Responses of microbial community structure to land-use conversion and fertilization in southern China. Eur. J. Soil
Biol. 70, 1–6 (2015).
20. Iost, S., Landgraf, D. & Makeschin, F. Chemical soil properties of reclaimed marsh soil from Zhejiang Province P.R. China. Geo-
derma 142, 245–250 (2007).
21. Yang, W. et al. Shift in soil organic carbon and nitrogen pools in different reclaimed lands following intensive coastal reclamation
on the coasts of eastern China. Sci. Rep. 9, 5921 (2019).
22. Assefa, D. et al. Deforestation and land use strongly effect soil organic carbon and nitrogen stock in Northwest Ethiopia. Catena 153,
89–99 (2017).
23. Chen, G. X., Gao, D. Z., Wang, Z. P. & Zeng, C. S. Contents of carbon, nitrogen and phosphorus in sediments in aquaculture ponds
for different reclamation years in Shanyutan wetlands and its pollution risk assessment. Wetland Sci. 15, 309–314 (2017).
24. Whitting, G. J. & Chanton, J. P. Greenhouse carbon balance of wetlands: methane emission versus carbon sequestration. Tellus B.
53, 521–528 (2001).
25. Wissing, L. et al. Management-induced organic carbon accumulation in paddy soils: the role of organo-mineral associations. Soil
Tillage. Res. 126, 60–71 (2013).
26. Xing, W. L., Cheng, X. R., Xiong, J., Yuan, H. J. & Yu, M. K. Variations in soil biological properties in poplar plantations along
coastal reclamation stages. Appl. Soil Ecol. 154, 103649 (2020).
27. Grybos, M., Davranche, M., Gruau, G., Petitjean, P. & Pedrot, M. Increasing pH drives organic matter solubilization from wetland
soils under reducing conditions. Geoderma 154, 13–19 (2009).
28. Krishnamoorthy, R., Kim, K., Kim, C. & Sa, T. Changes of arbuscular mycorrhizal traits and community structure with respect to
soil salinity in a coastal reclamation land. Soil Biol. Biochem. 72, 1–10 (2014).
Scientific Reports | (2021) 11:7265 | https://doi.org/10.1038/s41598-021-86758-2 12
Vol:.(1234567890)www.nature.com/scientificreports/
29. Chodak, M., Gołębiewski, M., Morawska-Płoskonka, J., Kuduk, K. & Niklińska, M. Diversity of microorganisms from forest soils
differently polluted with heavy metals. Appl. Soil Ecol. 64, 7–14 (2013).
30. Peay, K. G., Baraloto, C. & Fine, P. V. Strong coupling of plant and fungal community structure across western Amazonian rain-
forests. ISME J. 7, 1852–1861 (2013).
31. Santonja, M. et al. Plant litter mixture partly mitigates the negative effects of extended drought on soil biota and litter decomposi-
tion in a Mediterranean oak forest. J. Ecol. 105, 801–815 (2017).
32. Yang, W. et al. Response of the soil microbial community composition and biomass to a short-term Spartina alterniflora invasion
in a coastal wetland of eastern China. Plant Soil 408, 443–456 (2016).
33. Anderson, C. R. et al. Biochar induced soil microbial community change: Implications for biogeochemical cycling of carbon,
nitrogen and phosphorus. Pedobiologia 54, 309–320 (2011).
34. Mavi, M. S. & Marschner, P. Salinity affects the response of soil microbial activity and biomass to addition of carbon and nitrogen.
Soil Res. 51, 68–75 (2013).
35. Xie, X. F. et al. Comparison of random forest and multiple linear regression models for estimation of soil extracellular enzyme
activities in agricultural reclaimed coastal saline land. Ecol. Indic. 120, 106925 (2021).
36. Mohammad, M. J., Malkawi, H. I. & Shibli, R. Effects of arbuscular mycorrhizal fungi and phosphorus fertilization on growth and
nutrient uptake of barley grown on soils with different levels of salts. J. Plant Nutr. 26, 125–137 (2003).
37. Cui, X. C., Hu, J. L., Wang, J. J., Yang, J. S. & Lin, X. G. Reclamation negatively influences arbuscular mycorrhizal fungal community
structure and diversity in coastal saline-alkaline land in Eastern China as revealed by Illumina sequencing. Appl. Soil Ecol. 98,
140–149 (2016).
38. Guo, X. & Gong, J. Differential effects of abiotic factors and host plant traits on diversity and community composition of root-
colonizing arbuscular mycorrhizal fungi in a salt-stressed ecosystem. Mycorrhiza 24, 79–94 (2014).
39. Yamato, M., Yagame, T., Yoshimura, Y. & Iwase, K. Effect of environmental gradient in coastal vegetation on communities of
arbuscular mycorrhizal fungi associated with Ixeris repens (Asteraceae). Mycorrhiza 22, 622–630 (2012).
40. Strickland, M. S. & Rousk, J. Considering fungal :bacterial dominance in soils: Methods, controls, and ecosystem implications.
Soil Biol. Biochem. 42, 1385–1395 (2010).
41. Collins, C. G., Stajich, J. E., Weber, S. E., Pombubpa, N. & Diez, J. M. Shrub range expansion alters diversity and distribution of
soil fungal communities across an alpine elevation gradient. Mol. Ecol. 27, 2461–2476 (2018).
42. Yang, W. et al. Soil fungal communities vary with invasion by the exotic Spartina alternifolia Loisel. in coastal salt marshes of
eastern China. Plant Soil 442, 215–232 (2019).
43. Yang, W. et al. Exotic Spartina alterniflora Loisel. invasion significantly shifts soil bacterial communities with the successional
gradient of saltmarsh in eastern China. Plant Soil 449, 97–115 (2020).
44. Wang, C. et al. Responses of soil microbial community to continuous experimental nitrogen additions for 13 years in a nitrogen-
rich tropical forest. Soil Biol. Biochem. 121, 103–112 (2018).
45. Högberg, M. N., Baath, E., Nordgren, A., Arnebrant, K. & Högberg, P. Contrasting effects of nitrogen availability on plant carbon
supply to mycorrhizal fungi and saprotrophs: A hypothesis based on field observations in boreal forests. New Phytol. 160, 225–238
(2003).
46. Joergensen, R. G. & Wichern, F. Quantitative assessment of the fungal contribution to microbial tissue in soil. Soil Biol. Biochem.
40, 2977–2991 (2008).
47. Xu, S. Q. et al. Comparison of microbial community composition and diversity in native coastal wetlands and wetlands that have
undergone long-term agricultural reclamation. Wetlands 37, 99–108 (2017).
48. Vangestel, M., Merckx, R. & Vlassak, K. Microbial biomass responses to soil drying and rewetting-the fate of fast-growing and
slow-growing microorganisms in soils from different climates. Soil Biol. Biochem. 25, 109–123 (1993).
49. Farrell, M. Microbial utilisation of biochar-derived carbon. Sci. Total Environ. 465, 288–297 (2013).
50. Luo, S. S. Aggregate-related changes in soil microbial communities under different ameliorant applications in saline-sodic soils.
Geoderma 329, 108–117 (2018).
51. Tripathi, B. M. et al. Tropical soil bacterial communities in Malaysia: pH dominates in the equatorial tropics too. Microb. Ecol. 64,
474–484 (2012).
52. Fierer, N. & Jackson, R. B. The diversity and biogeography of soil bacterial communities. Proc. Natl. Acad. Sci. USA 103, 626–631
(2006).
53. Huang, Y. M., Liu, D. & An, S. S. Effects of slope aspect on soil nitrogen and microbial properties in the Chinese Loess region.
Catena 125, 135–145 (2015).
54. Bossio, D. A., Fleck, J. A., Scow, K. M. & Fujii, R. Alteration of soil microbial communities and water quality in restored wetlands.
Soil Biol. Biochem. 38, 1223–1233 (2006).
55. Chang, E. H., Chen, C. P., Tian, G. L. & Chiu, C. Y. Replacement of natural hardwood forest with planted bamboo and cedar in a
humid subtropical mountain affects soil microbial community. Appl. Soil Ecol. 124, 146–154 (2018).
56. Cao, Y. S. et al. Soil microbial community composition under Eucalyptus plantations of different age in subtropical China. Eur. J.
Soil Biol. 46, 128–135 (2010).
57. Vance, E. D., Brookes, P. C. & Jenkinson, D. S. An extraction method for measuring microbial biomass C. Soil Biol. Biochem. 19,
703–707 (1987).
58. Bossio, D. A. & Scow, K. M. Impacts of carbon and flooding on soil microbial communities: Phospholipid fatty acid profiles and
substrate utilization patterns. Microbial. Ecol. 35, 265–278 (1998).
59. Bååth, E. & Anderson, T. H. Comparison of soil fungal/bacterial ratios in a pH gradient using physiological and PLFA-based
techniques. Soil Biol. Biochem. 35, 955–963 (2003).
60. Kourtev, P. S., Ehrenfeld, J. G. & Häggblom, M. Exotic plant species alter the microbial community structure and function in the
soil. Ecology 83, 3152–3166 (2002).
Acknowledgements
Funding for this study was supported by the National Natural Science Foundation of China (Grant No. 32071632;
31600427), the Fundamental Research Funds for the Central Universities (Grant No. GK202003051), the National
Basic Research Program of China (Grant No. 2013CB430400), and the Natural Science Foundation of Shaanxi
Province, China (Grant No. 2019JQ-666). We thank Zhihui Shi for supporting and assisting with this study.
Author contributions
W.Y., S.Q.A. and X.L.C. designed the research. W.Y. performed the experiment, analysed the data, and wrote the
manuscript. N. J. helped carry out the experiments and analysed the data. A.D. C. helped interpret the results
of the study.
Scientific Reports | (2021) 11:7265 | https://doi.org/10.1038/s41598-021-86758-2 13
Vol.:(0123456789)www.nature.com/scientificreports/
Competing interests
The authors declare no competing interests.
Additional information
Correspondence and requests for materials should be addressed to W.Y. or X.C.
Reprints and permissions information is available at www.nature.com/reprints.
Publisher’s note Springer Nature remains neutral with regard to jurisdictional claims in published maps and
institutional affiliations.
Open Access This article is licensed under a Creative Commons Attribution 4.0 International
License, which permits use, sharing, adaptation, distribution and reproduction in any medium or
format, as long as you give appropriate credit to the original author(s) and the source, provide a link to the
Creative Commons licence, and indicate if changes were made. The images or other third party material in this
article are included in the article’s Creative Commons licence, unless indicated otherwise in a credit line to the
material. If material is not included in the article’s Creative Commons licence and your intended use is not
permitted by statutory regulation or exceeds the permitted use, you will need to obtain permission directly from
the copyright holder. To view a copy of this licence, visit http://creativecommons.org/licenses/by/4.0/.
© The Author(s) 2021
Scientific Reports | (2021) 11:7265 | https://doi.org/10.1038/s41598-021-86758-2 14
Vol:.(1234567890)You can also read