Hot or not? connecting rhizosphere hotspots to total soil respiration
←
→
Page content transcription
If your browser does not render page correctly, please read the page content below
Plant Soil (2021) 464:489–499
https://doi.org/10.1007/s11104-021-04963-4

 REGULAR ARTICLE

Hot or not? connecting rhizosphere hotspots to total soil
respiration
Joscha N. Becker         &   Maire Holz

Received: 4 February 2021 / Accepted: 14 April 2021 / Published online: 29 April 2021
# The Author(s) 2021

Abstract                                                               before and after labelling. Enzyme activity (β-
Aims Soil organic carbon (C) efflux is tightly linked to               glucosidase) was quantified by soil zymography.
the rhizosphere, where soil microorganisms rapidly de-                 Results Bulk soil β-glucosidase activitiy negatively
compose organic compounds released from roots. Re-                     correlated to total CO2 efflux, and was the most impor-
cently, imaging approaches have greatly improved our                   tant predictor (R2 = 0.55). Total and rhizosphere specific
                                                                       14
understanding of small-scale C-turnover heterogeneity                    C-activity were solely correlated to 14CO2 efflux (r =
and promoted the term ‘rhizosphere hotspots’ for highly                0.51, r = 0.58). A combination of bulk soil β-
active areas. However, despite often assumed, the effect               glucosidase activity, rhizosphere-14C activity and root
of these hotspots on total soil C balances is still un-                biomass, explained about 75% of variance in CO2
known. We aim to bridge this gap by correlating rhizo-                 efflux.
sphere imaging data to soil respiration on individual                  Conclusions This indicates that root exudation and
plant scale.                                                           enzyme-activity hotspots are suitable predictors for total
Methods We grew 17 maize (Zea mays L.) plants in                       soil respiration, particularly when combined with root
rhizoboxes filled with sandy arable soil. After four                   biomass to account for three-dimensional variation, and
weeks, the plants were labelled with 14CO2 and root                    that hotspots on the rhizosphere scale are directly linked
exudation was visualized and quantified by 14C-imaging                 to larger scale C balances.
one day after labeling. The evolved CO2 was trapped in
NaOH and 14CO2 as well as total CO2 was quantified                     Keywords Zymography . 14C-imaging . Soil-plant
                                                                       interaction . Root exudation . Root activity

Joscha N. Becker and Maire Holz contributed equally to this work.
                                                                       Introduction
Responsible Editor: Elizabeth M Baggs

J. N. Becker (*)                                                       Soils are not only providing the largest terrestrial carbon
Institute of Soil Science, CEN Center for Earth System Research        (C) pool (Lal 2008), soil CO2 fluxes and belowground C
and Sustainability, Universität Hamburg, Hamburg, Germany
e-mail: joscha.becker@uni-hamburg.de                                   allocation are also major pathways in the global C cycle
                                                                       (Ryan and Law 2005). Soil respiration (microbial &
M. Holz                                                                root) is responsible for most soil C losses and largely
Group of Isotope Biogeochemistry and Gas Fluxes, Leibniz
Centre for Agricultural Landscape Research (ZALF) e.V,                 controls ecosystem C sequestration (Schlesinger 1997).
Müncheberg, Germany                                                    In turn, it strongly depends on energy inputs from
                                                                       aboveground C sources. The major interface of C input
                                                                       and turnover is the rhizosphere, where soil
490 Plant Soil (2021) 464:489–499
microorganisms rapidly decompose rhizodeposits Accordingly, cocentrations of rhizodeposits and mi-
(Hütsch et al. 2002; Gunina and Kuzyakov 2015). In crobial biomass decrease from the root towards the bulk
contrast to the bulk soil, the rhizosphere is characterized soil (Schenck zu Schweinsberg-Mickan et al. 2010;
by intensified C and nutrient turnover with high spatial Holz et al. 2019; Kuzyakov and Razavi 2019). Major
and temporal heterogeneity along and across the root C and N turnover processes were found to be signifi-
(Oburger and Schmidt 2015; Kuzyakov and Razavi cantly higher in rhizosphere soil compared to the bulk
2019). Recent application of imaging approaches have soil (Finzi et al. 2015). However, such findings do not
greatly improved our understanding of this small-scale consider the spatial complexity within the rhizospere,
heterogeneity, and established the term ‘rhizosphere and do not allow for conclusion on the effect of rhizo-
hotspots’ for particularly active areas (Kuzyakov and sphere processes on CO2 efflux because both measure-
Blagodatskaya 2015; Kuzyakov and Razavi 2019). De- ments are commonly not coupled. Quantifying CO2
spite often assumed, the direct relationship between efflux alone does not account for process dynamics
these small-scale hotspots and soil C balances on the whithin the rhizosphere hotspots, while the quantifica-
next higher scale level (i.e. plant individual) is still tion of rhizosphere hotspots alone might not translate to
unknown. CO2 balances on larger scale levels.
Rhizosphere properties are controlled by root activ- Assessing the importance of rhizosphere-imaging
ity and by rhizodeposition (Jones et al. 2009). The size derived information for the C balances in plant-soil
and extension of the rhizosphere have been well de- interactions, requires the application of flux measure-
scribed (Kuzyakov and Razavi 2019). Low molecular ments and imaging methods in unison. To bridge this
root exudates are mainly released from the root tip and gap between small-scale rhizosphere processes and in-
their concentration is highest within around 2 mm dis- dividual plant-soil interaction, we applied different im-
tance from the root surface (Holz et al. 2017; aging methods on the root area of maize (Zea mays)
Kuzyakov and Razavi 2019). As they serve as easily plants grown in sandy arable soil. Root exudation was
available energy sources for microorganisms (Gunina visualized by 14C-imaging (Pausch and Kuzyakov
and Kuzyakov 2015) and are linked to root growth 2011; Holz et al. 2017), and β-glucosidase activity
(Holz et al. 2017, 2018), the occurrence of low molec- was imaged by soil zymography (Spohn et al. 2013;
ular root exudates is likely associated with high CO2 Razavi et al. 2016). The cumulative 14CO2 and total
production. Usually, glucose is used as a model sub- CO2 efflux rates were quantified over 1 day before
stance to simulate root exudation, comonly increasing imaging.
CO2 efflux rates after application (Blagodatskaya et al. Our objectives were to assess (1) whether visibile
2011; Mason-Jones et al. 2018). This has established hotspots of root exudates and enzyme activity are a
the assumption, that increased rhizodeposition gener- dominant scource and thus suitable to predict total soil
ally results in higher microbial activity and soil respi- C respiration, and (2) whether it is possible to estimate
ration (Phillips et al. 2011). However, exudates not the contribution of different rhizophsere processes to C
only consist of monosaccharides but include a broad respiration by coupling imaging and CO 2 flux
variety of monomeric and polymeric substances. measurents. We hypothesize that the intensity of root
Chemically more complex root exudates (e.g. muci- exudate and enzyme hotspots coincide with high CO2
lage) and root necromass, are made bioavailable by fluxes and that hotspots of rhizosphere activities are
microbially produced exoenzymes which break down better predictors of CO2 efflux than bulk soil or plant
polymeric components, such as cellulose, hemicellu- related variables alone.
lose and other polysaccharides (Allison et al. 2011).
Previous studies have reported positive relationships
between enzyme activities and bulk soil CO2 efflux Material and methods
(Phillips et al. 2011; Mancinelli et al. 2013). Therefore,
it is assumed that this translates to spatially resolved Experimental setup
patterns in the rhizosphere. Those areas with high
activity of enzymes mediating SOC decomposting Rhizoboxes with an inner size of 20x40x1 cm were
(i.e., enzyme hotspots) might also indicate areas with filled with an arable soil (each about 1 kg soil with a
high CO2 production. bulk density of 1.41) collected from a field close toPlant Soil (2021) 464:489–499 491
Göttingen, Germany. All boxes were treated the same to moist filter paper was carefully removed from the
avoid clustering or covariate effects of confounding rhizobox surface and oven dried at 60 °C to avoid
factors. Soil organic carbon content was 20.0 g kg−1, microbial decomposition of root exudates collected in
total nitrogen was 1.7 g kg−1 and the pHH2O was 4.9. the filter paper. Imaging plates (Storage phosphor
Soil particle size was distributed as follows: Clay: 8.6%, screen, BAS-IP MS 2040 E, VWR, 20 × 40 cm) were
silt: 18.5%, sand: 73% (Holz et al. 2017). Maize seeds placed on the filter paper, which was covered by a thin
(Zea mays - KWS 2376) were immersed in a 10% H2O2 plastic film for 14 h. After this, the screens were scanned
solution for 10 min to avoid seed-borne diseases before (FLA 5100 scanner, Fujifilm) with a spatial resolution
germination. The seedlings were placed on a filter paper of 50 μm to visualize the distribution of 14C in root
and were germinated in a petri dish 3 days in the dark. exudates (hereafter referred to as “Rhizosphere 14C
After 3 days, one seedling was planted per rhizobox hotspots” – Fig. 1b). After removal of the filter paper,
(n = 17). During plant growth, the boxes were inclined the rhizobox surface was covered with a thin plastic film
by 55° to make the roots grow along the transparent and a storage phosphor screen was placed on each
front cover (Fig. 1a). This is relevant for measuring the rhizobox surface for 14 h. After this, the samples were
distribution of enzymes around the roots during scanned as described above to visualize 14C allocated to
zymography and for 14C imaging of roots and root roots and root exudates (hereafter referred to as “Total
exudates. The plants were kept in a climate chamber 14
C hotspots” – Fig. 1c).
during the total growth period and watered daily to To determine 14C-CO2 in the NaOH traps a scintilla-
maintain a volumetric water content of 20–23%. The tion cocktail (Eco Plus) was added to NaOH with the
temperature was 25 °C during the day, 22 °C during the ratio of 4:1. 14C activity in NaOH was determined using
night, the photoperiod was 14 h, and the light intensity a liquid scintillation counter (Hidex, 300 SL). Total CO2
was 300 μmol m−2 s−1. These growth conditions were respiration from soil was measured from a subsample
used as they represent optimal growth conditions for (2 ml) of the NaOH trap by a TOC analyzer (TOC 5050,
Zea mays. Shimadzu Corporation, Kyoto, Japan).
14
C labelling and CO2 measurements Soil Zymography
After four weeks of plant growth each plant was labelled The distribution of β-glucosidase activity was deter-
with 0.5 MBq 14CO2 (specific activity of mined by soil zymography. The measurements were
59.6 mCi mmol C−1) for 5 h. Before starting the label- conducted according to Spohn and Kuzyakov (2013)
ling, rhizoboxes were opened and a moist filter paper but without a agarose gel as in Razavi et al. (2016).
(Whatman, 1001–917, 11 μm) was attached in order to Briefly, polyamide membrane filters (Tao Yuan, China)
capture exudates from the exposed root surface. After with a pore size of 0.45 μm were cut into 20 × 40 cm
closing the rhizoboxes again, each rhizobox was packed pieces. Each membrane filter was placed in a solution of
in a plastic bag, which was closed with modelling clay at 20 mL of water containing 6 mg 4-Methylumbelliferyl-
the lower part of the stem of the plants. Inside the bag, a b-D-glucoside (MUF-G) which is a substrate for β-
20 mL 1 M NaOH trap was placed to trap the 14CO2 glucosidase. After hydrolysis of the substrate, fluores-
released from soil. For 14C labelling, plants were placed cence of MUF can be measured. The membrane was
in an acrylic glass chamber with a size of 0.6 × 0.6 × soaked with the solution and was then attached to the
0.8 m. A ventilating fan was used to distribute the 14CO2 rhizobox surface for 60 min. Subsequently, the mem-
homogenously within the chamber. The label brane was removed from the soil surface and the re-
(Na214CO3 dissolved in 1 M NaOH) was placed into a maining soil was carefully removed with a small brush.
glass vial, which was connected with the chamber by The membranes were placed under UV light, and pic-
plastic tubes. After adding phosphoric acid (50%) to the tures were taken at 360 nm wavelength (Fig. 1d) with a
label, 14CO2 was released and pumped into the chamber digital camera. In addition to the actual membrane, a
where it was circulated for 5 h. 24 h after beginning of small piece of membrane (1.5 × 6 cm) soaked with water
labelling the plastic bags were opened and the NaOH instead of substrate solution was also imaged to control
traps were removed for determination of total CO2 as for the background signal. The final images had a spatial
well as 14CO2. The rhizoboxes were opened and the resolution of 40 μm per pixel.492 Plant Soil (2021) 464:489–499
a) b) c) d)
8 900
7 800
Enzyme activity (pmol cm-2 h-1)
700
6
600
14
C activity (PSL)
5
500
4
400
3
300
2 200
1 100
2.5 cm 0 0
14 14
Rhizobox surface C activity - C activity - Betaglucosidase activity
roots and root exudates root exudates
14
Total 14C hotspots Rhizosphere C hotspots Enzyme hotspots
14
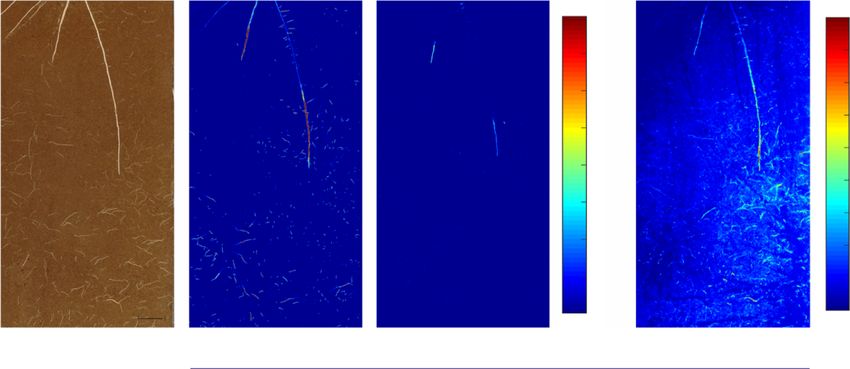
Fig. 1 Exemplary images of (a) maize roots in an open rhizobox, (b) distribution of C within the maize root system and in (c) root
exudates imaged by phosphor imaging and (d) distribution of β-glucosidase activity in the same sample
For calibration, solutions with increasing 4- (Tricarb, 3180, PerkinElmer). Shoot and root biomass
methylumbelliferone (MUF) concentrations were pre- was determined gravimetrically.
pared: 0, 386, 967, 1934, 2901 and 3868 pmol cm−2 h−1.
Pieces of membranes (4 × 4 cm) were cut, soaked with
the solution, and imaged as described for the soil Image analysis
zymography. From the amount of solution taken up
per cm of membrane and the MUF concentration of For quantification of 14C in images, the images were
the solution, the concentration of MUF per area was converted from a log into a linear system by applying
calculated. For the calculation of the β-glucosidase ac- the following equation:
tivity, the amount of MUF per area was divided by the
Res 2 4000
*10ð G − 2 Þ
QL 1
incubation time. The equation obtained from the cali- PSL ¼ * ð1Þ
bration was applied to all images to convert the grey 100 S
value to β-glucosidase activity. The signal of the control
membrane was subtracted from the image to remove the Where PSL (photo stimulated luminescence) is
background signal. the quantified value of the image in linear scale,
Res is the resolution of the image in μm (Res =
50 μm), S is the sensitivity (S = 5000), L is the
Plant harvest latitude (L = 5) and G is the gradation (G =
65,535). After conversion of the images, the back-
After zymography measurements, plant shoots were cut ground noise was removed: The part of the image
and dried at 40 °C. The roots were taken out of the soil where the screen was not in contact with the sample
and the soil attached to the roots after being gently was selected and subtracted from the part of the
shaken (rhizosheath) was collected by carefully washing image where the root system was visible to remove
it from the roots. Roots were dried at 40 °C. Rhizosphere the background noise. Rhizosphere 14C hotspots as
soil and bulk soil (the soil not adhering to the roots) were well as total 14C hotspots were identified based on
freeze dried to avoid microbial degradation of labile the contrast between regions of high 14C activity and
carbon compounds. To measure 14C activity, ground regions with low 14C activity and based on the
shoots, roots, rhizosheath and bulk soil samples were longitudinal shape of the roots using the program
combusted in an Oxymat OX500. The released 14CO2 Roottracker2D. A detailed description of the ap-
was captured in a scintillation cocktail (C400, Zinsser) proach can be found in Menon et al. (2007). The
and quantified using a liquid scintillation analyzer hotspot area and intensity were calculated usingPlant Soil (2021) 464:489–499 493
MATLAB (The MathWorks). Enzyme hotspots were Results
also identified using the program Roottracker2D
(Menon et al. 2007). For an objective selection of Data verification and range
rhizosphere hotspots, rhizosphere extension was
specified to the location where phosphatase activity Exept for shoot biomass, all predictor and explanatory
had decreased to 5% of its maximum activity at the variables followed a normal distribution among the
root center (Holz et al. 2020). As for 14C imaging, boxes (Supplementary Fig. 1), and no data annomalies,
hotspot area and intensity were calculated using such as outliers or clustering, occured. The maize plants
MATLAB (The MathWorks). reached an average shoot drymass of 1.6 g
(Supplementary Table 1). Their average root biomass
was 0.67 g, ranging between 0.2 and 1.4 g, with a visible
Statistics surface area between 0.8 and 8.2% of the whole
rhizobox surface. From these boxes, we measured total
All data were checked for normal distribution and con- CO2-efflux rates between 2 and 5 mg kg−1 soil d−1
sistency, and measures of central tendency and disper- (Supplementary Table 1). The cummulative 14CO2 ac-
sion were calculated (Supplementary Table 1). Variable tivity after 24 h ranged between 15 and 53 kBq. The
14
interrelations were assessed by Pearson correlation and C-imaging provided a data range of 34,817 to
visualized by multidimensional scaling of the 3,238,628 PSL for the total hotspots, and 25,537 to
correlationmatrix (network plot), where stronger corre- 145,708 PSL for the rhizosphere hotspots alone. The
lated variables are ordinated closer to each other. Single β-glucosidase activities in bulk soil ranged between 556
effects of predictor variables (biomass and imaging and 2541 μmol h−1, while rhizosphere specific activities
parameters) on soil respiration (CO2 and 14CO2 efflux) ranged between 5.16 and 114.93 μmol h−1. The average
were univariately assessed by simple linear regression. areas of rhizosphere and bulk soil were 4.29% and
Residual diagnostics were conducted visually, as well as 95.71% respectively.
by using Shapiro-Wilk test and Cook’s distance = 0.5. The response variables (CO2 and 14CO2 efflux) were
For all analyses the significance level was defined as positively correlated to each other (r = 0.41, p = 0.02).
p < 0.05. Between the explanatory variables, significant interac-
We used random forest models (RF) to preselect tions were detected (Fig. 2): The shoot and root biomass
explanatory variables for multiple linear regression. were directly related (r = 0.80, p = 0.001) and root bio-
Variables with no, or negative % increase in mean mass weakly correlated with total 14C hotspots (r = 0.46,
square error were excluded. To avoid excess degrees p = 0.06). The total number of 14C hotspots strongly
of freedom due to missing values, 14C activity in the correlated with rhizosphere 14C hotspots (r = 0.72, p =
rhizosheath was tested and compared iteratively. Var- 0.002). No interactions were found between biomass
iables in each multiple linear regression model were variables and rhizosphere 14C hotspots as well as en-
checked for variance inflation (VIC) and stepwise zyme activities. Correlations between 14C-imaging var-
removed if VIC > 10. The akaike information criteri- iables and zymography variables were weak or
on (AIC) was used to select the best performing completely absent.
multiple linear model. Models with better AIC values Biomass related variables (i.e. root surface area,
were only considered when significant (p < 0.05). shoot and root biomass) showed strong correlation be-
The final model was visualized by partial regression tween each other, but where weakly related to CO2 flux
plots, each showing the effect of one predictor vari- and imaging variables (Fig. 2). Zymography derived
able on the response variable while other variable variables clustered with total CO2 efflux, while 14C
effects were kept constant. imaging variables clustered with 14CO2 efflux.
All statistical analyses were conducted in R v3.6.1 (R
Core Team 2017) using ‘randomForest’ package for Variable effects on total CO2 and 14CO2 efflux
building random forest model (Liaw & Wiener 2002),
‘corrr’ package for correlation and network analyses Zymography showed a clear negative effect of β-
(Kuhn et al. 2020), and ‘ggplot2’ for data visualization glucosidase activitiy on total CO2 efflux (Fig. 3a, b).
(Wickham 2016). Bulk and rhizosphere enzyme activity each explained494 Plant Soil (2021) 464:489–499
rhizo enz 0.68* R 2 adj = 0.56 (AIC = 25.1) compared to the best
0.78**
bulk enz
root surface
performing single explanatory variable (i.e. total en-
-0.71**
zyme activity). Adding root biomass as a 3rd predictor
-0.74** 0.84*** for total CO2 efflux, strongly increased model perfor-
0.71**
total CO2
1.0 mance (R2adj = 0.75, AIC: 18.8) (Fig. 5). The 14CO2
shoot bm
0.5 efflux explained by rhizosphere-enzyme acitivtiy and
0.80***
0.0 total 14C hotspots was R2adj = 0.65 (AIC: 82.0), com-
0.41* −0.5 pared to R2adj = 0.29 by total 14C hotspots alone (AIC =
rhizo 14C root bm −1.0 124.0). Combinig enzyme variables to explain total
0.51* CO2, and 14C hotspots to explain 14CO2 efflux, lead to
14CO2 lower R 2 adj values or non-significance due to
0.58*
0.72** multicolliniarity effects, respectively.
total 14C
Fig. 2 Network plot of Pearsson correlations. Stronger correla-
tions between variables are indicated by stronger paths (red = Discussion
negative, blue = positive), and by appearing closer to each other
(distances are determined by multidimensional scaling). Only
correlations with |r| > 0.4 are shown and significance levels are
There is an emerging view that plants, and in particular
indicated by * = 0.05, ** =0.01 and *** = 0.001 the allocation of C to roots and rhizosphere, strongly
control soil C cycling (Kuzyakov and Cheng 2001;
more than 50% of the total CO2 efflux variance. The Hütsch et al. 2002; Jones and Hinsinger 2008).
14
C-imaging hotspots were not related to the total soil Rhizosphere-imaging approaches are powerful tools
respiration, neither in the whole soil, nor in the rhizo- for spatially allocating hotspots of the major controlling
sphere specific area (Fig. 3c, d). The total CO2 efflux processes (Oburger and Schmidt 2015; Roose et al.
was also independent from root surface area and bio- 2016). Yet, the overall importance of these hotspots
mass (Fig. 3e, f), although the latter showed a positive for larger-scale C balances remains unclear. We used a
tendency (p = 0.08). In contrast to total CO2 efflux, the combination of imaging approaches as proxies for root
measured 14CO2 efflux was completely independent exudation and exo-enzymatic C turnover, to bridge the
from zymography variables (Fig. 4a, b). The number gap between rhizosphere-scale hotspots and soil C res-
of 14C activities in the total root zone and in the rhizo- piration on an individual plant scale.
sphere, however, were positively related to 14CO2 efflux Bulk soil β-glucosidase activities in combination
and explained 33% and 26% of the response variance, with rhizosphere 14C activity and root biomass, ex-
respectively (Fig. 4c, d). Yet again, the root biomass and plained up to 75% of total CO2 efflux variance. This
root surface area had no effect on the efflux rate (Fig. indicates that combining imaging hotspots of root exu-
4e, f). The 14C activity of root-attached soil was unre- dation with hotspots of β-glucosidase activity allows to
lated to CO2 or 14CO2 efflux (Supplementary Fig. 2). roughly predict soil respiration rates. Complementing
these variables with root biomass measurements ac-
counts for three-dimensional variability in the rhizo-
Variable importance sphere which may not be well depicted by 2D images.
However, other variables – such as rhizosheath 14C-
Root surface area, 14C activity of root-attached soil and activity – did not seem to fulfil the same purpose.
shoot biomass showed either negative or no effects on In our study, root exudates were visualized through
RF predictive accuracy for total CO2 as well as 14CO2 increased 14C-activity outside the root specific area.
fluxes and were excluded from further analyes. This These exudates serve as easily available energy sources
equally applied for root biomass in 14CO2 predictions. for microorganisms in the rhizosphere and are therefore
The best performing models for predicting total CO2 expected to enhance SOM turnover and CO2 efflux
and 14CO2 efflux from imaging methods alone, included (Kuzyakov and Cheng 2001; Hütsch et al. 2002;
enzyme acitivtiy and total 14C hotspots. This variable Gunina and Kuzyakov 2015). This effect has been fre-
combination slightly increased the explained variance of quently reported, and is directly related to microbial
total CO2 efflux from R2adj = 0.50 (AIC = 25.9) to activity and thus microbial respiration. Furthermore,Plant Soil (2021) 464:489–499 495
Fig. 3 Effect of β-glucosidase
5 (a) (b)
activities in bulk soil (a) and rhi-
zosphere (b), 14C-hotspots (c, d),
soil]
total CO2 [mg kg−1
and belowground-biomass vari- 4
ables (e, f) on total CO2 efflux
over 24 h. Significance level (p),
3
coefficient of determination (R2)
and area of 95% confidence
(grey) for simple linear regression 2
are annotated p=0.006**, R²=0.55 p=0.01**, R²=0.50
1
500 1000 1500 2000 2500 0 30 60 90 120
bulk enzyme act. [µmol h−1] rhizosphere enzyme act. [µmol h−1]
p=0.51, R²=0.0 (c) p=0.18, R²=0.06 (d)
soil]
total CO2 [mg kg−1
4
3
2
40000 80000 120000 0e+00 1e+06 2e+06 3e+06
rhizosphere 14C activity [PSL] total 14C activity [PSL]
p=0.08', R²=0.12 (e) p=0.76, R²=0.0 (e)
soil]
total CO2 [mg kg−1
4
3
2
0.5 1.0 2 4 6 8
root biomass [g] root surface area [%]
root exudation can be linked to root growth, i.e. is a that high root exudation leads to reduced enzyme activ-
proxy for fine root activity and root respiration (Sun ity, counterbalancing effects on total soil respiration.
et al. 2017). Both of these CO2 sources can explain This contradicts our initial expectation, considering that
why increasing rhizosphere 14C activity (i.e., increased β-glucosidase activity promotes SOM break down in
root exudation) directly led to higher total soil respira- bulk soil (Wick et al. 2002), and also contradicts the
tion rates, when other variables were kept constant (Fig. observation in previous studies where β-glucosidase
5). activity was positively related to CO2 efflux (Gispert
In contrast to rhizosphere 14C activity, β-glucosidase et al. 2013; Liang et al. 2015). However, Gispert et al.
activities were negatively related to total CO2 efflux and (2013) also reported a negative relationship between β-
were the only variables to show significant univariate glucosidase activity and CO2/SOC ratio, indicating that
relationships. Given the equally negative correlations these positive correlations may actually be artifacts of
between β-glucosidase and 14C activities, this suggests SOC to CO2 relationships. Since our study design496 Plant Soil (2021) 464:489–499
Fig. 4 Effect of β-glucosidase 60
p=0.18, R²=0.17 (a) p=0.20, R²=0.16 (b)
activities in bulk soil (a) and rhi-
zosphere (b), 14C-hotspots (c, d), 50
and belowground-biomass vari-
CO2 [kBq d−1]
ables (e, f) on 14CO2 efflux. Sig-
nificance level (p), coefficient of 40
determination (R2) and area of
95% confidence (grey) for simple 30
14
linear regression are annotated
20
500 1000 1500 2000 2500 0 30 60 90 120
bulk enzyme act. [µmol h−1] rhizosphere enzyme act. [µmol h−1]
60
p=0.04*, R²=0.26 (c) p=0.015*, R²=0.33 (d)
CO2 [kBq d−1] 50
40
30
14
20
40000 80000 120000 0e+00 1e+06 2e+06 3e+06
rhizosphere 14C activity [PSL] total 14C activity [PSL]
60
p=0.13, R²=0.15 (e) p=0.58, R²=0.02 (f)
50
CO2 [kBq d−1]
40
30
14
20
0.5 1.0 2 4 6 8
root biomass [g] root surface area [%]
1.0
1.0
1.0
total CO2 | others
total CO2 | others
total CO2 | others
0.5
0.5
0.5
0.0
0.0
0.0
−1.0 −0.5
−1.0 −0.5
−1.0 −0.5
−500 0 500 1000 −40000 0 20000 −0.4 0.0 0.2 0.4
rhizosphere enzyme act. | others rhizosphere 14C activity | others root biomass | others
Fig. 5 Partial regression plot for total CO2 efflux explained by bulk β-glucosidase activity, rhizosphere 14C activity and root biomass. Each
trenline shows an explanatory variable effect when other variables are kept constantPlant Soil (2021) 464:489–499 497
(mostly) eliminates the impact of different bulk soil related to bulk enzyme activity (i.e., SOC turnover),
SOC contents, the negative β-glucosidase – CO2 rela- while 14C-hotspots mainly accounted for plant derived
tionships might instead be a result of soil microbial and rhizosphere 14CO2 efflux. However, the relation-
reaction to substrate availability. Microbes predomi- ships between hotspots and total soil respiration contain
nantly invest in producing exo-enzymes for OM decom- large uncertainties, and a combination of methods is
position when labile C sources (such as root exudates) required to achieve a meaningful representation of relat-
are scarce, leading to higher β-glucosidase activity and ed processes. Further research is needed to evaluate
lower bacterial growth rate (del Giorgio and Cole 1998). these results concerning type, function and distribution
Consequently, we found lower β-glucosidase activity in of soil and rhizosphere hotspots as well as relationships
the presence of root exuates (i.e. rhizosphere 14C activ- to nutrient fluxes and root morphology. Increasing the
ity) and a stronger relation between bulk β-glucosidase range of values by including treatments, such as plant
activity and CO 2 than between rhizosphere β- varieties differing in root exudation (Tawaraya et al.
glucosidase activity and CO2. In turn, this suggests that 2013; Holz et al. 2017) or fertilization levels, may also
zymography β-glucosidase hotspots might be associat- lead to stronger statistical relationships.
ed with turnover of native SOC rather than plant derived
C. This is supported by the strong relationships between
β-glucosidase hotspots and total CO2 efflux. In contrast,
14
C imaging variables were closely related to 14CO2
efflux, emphasizing their importance for root, as well Supplementary Information The online version contains sup-
plementary material available at https://doi.org/10.1007/s11104-
as rhizo-microbial respiration (de Vries et al. 2019).
021-04963-4.
Those variables that are directly dependent on the
presence of plant roots (i.e. root surface area and root
biomass) where weakly correlated to total CO2 and
14
CO2 efflux, as well as to all imaging variables (Fig. Acknowledgements The authors acknowledge the German Re-
2). Because root exudation strongly varies along the root search Foundation for granting the project CA 921/3-1. We further
axis, with maximum intensities directly at the tip and thank the Dept. Biogeochemistry of Agroecosystems and the
Laboratory for Radioisotopes, University of Göttingen, for
shortly behind the tip (Dennis et al. 2010; Holz et al. allowing usage their facilities.
2017), exudation effect on CO2 fluxes and related im-
aging variables are presumably decoupled from root Code availability Not applicable.
biomass and root surface area. However, using solely
imaging-derived variables to explain total soil respira-
tion provided medium correlation strength and predic- Authors’ contributions Both authors have equally contributed
to the manuscript and nobody who qualifies for authorship has
tive power of simple, as well as multiple regression been excluded.
models, with just about half the variance explained.
The inclusion of root biomass significantly increased
the predictive power of the model. This might also Funding Open Access funding enabled and organized by
indicate that a mediating factor is required to translate Projekt DEAL. The study was supported by a grant from the
results from 2D-imaging methods to processes on a 3D- German Research Foundation (DFG: CA 921/3–1).
scale.
Data availability A data summary is available as an electronic
supplementary.Supplementary Information The online version
contains supplementary material available at https://doi.
Conclusions org/10.1007/s11104-021-04963-4.
In this study, we used imaging methods to relate Declarations
hotspots of root exudation and enzyme activity to total
Conflicts of interest/competing interests The manuscript is the
soil respiration on an individual plant scale. We con- authors own work without any breach of copyright and the authors
clude that these hotspots are reasonable predictors for have no conflicts of interest to declare.
soil CO2 efflux and perform better than static variables,
such as root biomass alone. Soil respiration was mainly498 Plant Soil (2021) 464:489–499
References Kuhn M, Jackson S, Cimentada J (2020) corrr: Correlations in R.
R package version 0.4.2. https://CRAN.R-project.
org/package=corrr
Allison SD, Weintraub MN, Gartner TB, Waldrop MP (2010) Kuzyakov Y, Blagodatskaya E (2015) Microbial hotspots and hot
Evolutionary-Economic Principles as Regulators of Soil moments in soil: concept & review. Soil Biol Biochem 83:
Enzyme Production and Ecosystem Function. In: Shukla G, 184–199
Varma A (eds) Soil Enzymology. Soil Biology, vol 22. Kuzyakov Y, Cheng W (2001) Photosynthesis controls of rhizo-
Springer, Berlin, Heidelberg. https://doi.org/10.1007/978-3- sphere respiration and organic matter decomposition. Soil
642-14225-3_12 Biol Biochem 33:1915–1925
Blagodatskaya E, Yuyukina T, Blagodatsky S, Kuzyakov Y Kuzyakov Y, Razavi BS (2019) Rhizosphere size and shape:
(2011) Three-source-partitioning of microbial biomass and temporal dynamics and spatial stationarity. Soil Biol
of CO2 efflux from soil to evaluate mechanisms of priming Biochem 135:343–360
effects. Soil Biol Biochem 43:778–786 Lal R (2008) Carbon sequestration. Philos Trans R Soc B: Biol Sci
de Vries FT, Williams A, Stringer F et al (2019) Changes in root- 363:815–830
exudate-induced respiration reveal a novel mechanism Liang G, Houssou AA, Wu H et al (2015) Seasonal patterns of soil
through which drought affects ecosystem carbon cycling. respiration and related soil biochemical properties under
New Phytol 224:132–145 nitrogen addition in winter wheat field. PLoS One 10:1–15
del Giorgio PA, Cole JJ (1998) Bacterial growth efficiency in Liaw A, Wiener M (2002) Classification and Regression by
natural aquatic systems. Annu Rev Ecol Syst 29:503–541 Random Forest. R News 2:18–22
Dennis PG, Miller AJ, Hirsch PR (2010) Are root exudates more
Mancinelli R, Marinari S, Di Felice V, Savin MC, Campiglia E
important than other sources of rhizodeposits in structuring rhizo-
(2013) Soil property, CO2 emission and aridity index as
sphere bacterialcommunities? FEMS MicrobiolEcol72:313–327
agroecological indicators to assess the mineralization of cov-
Finzi AC, Abramoff RZ, Spiller KS, Edward R. (2015) er crop green manure in a Mediterranean environment. Ecol
Rhizosphere processes are quantitatively important compo-
Indic 34:31–40
nents of terrestrial carbon and nutrient cycles. Glob Change
Mason-Jones K, Schmücker N, Kuzyakov Y (2018) Contrasting
Biol 21:2082–2094. https://doi.org/10.1111/gcb.12816
effects of organic and mineral nitrogen challenge the N-
Gispert M, Emran M, Pardini G, Doni S, Ceccanti B (2013) The
mining hypothesis for soil organic matter priming. Soil Biol
impact of land management and abandonment on soil enzy-
Biochem 124:38–46
matic activity, glomalin content and aggregate stability.
Menon M, Robinson B, Oswald SE, Kaestner A, Abbaspour KC,
Geoderma 202–203:51–61
Lehmann E, Schulin R (2007) Visualization of root growth in
Gunina A, Kuzyakov Y (2015) Sugars in soil and sweets for
heterogeneously contaminated soil using neutron radiogra-
microorganisms: review of origin, content, composition and
phy. Eur J Soil Sci 58:802–810
fate. Soil Biol Biochem 90:87–100
Holz M, Zarebanadkouki M, Kuzyakov Y, Pausch J, Carminati A Oburger E, Schmidt H. (2015) New Methods To Unravel
(2017) Root hairs increase rhizosphere extension and carbon Rhizosphere Processes. Trends Plant Sci 21:243–255.
input to soil. Ann Bot 121:61–69 https://doi.org/10.1016/j.tplants.2015.12.005
Holz M, Zarebanadkouki M, Kaestner A, Kuzyakov Y, Carminati Pausch J, Kuzyakov Y (2011) Photoassimilate allocation and
A (2018) Rhizodeposition under drought is controlled by root dynamics of hotspots in roots visualized by 14C phosphor
growth rate and rhizosphere water content. Plant Soil 423: imaging. J Plant Nutr Soil Sci 174:12–19
429–442 Phillips RP, Finzi AC, Bernhardt ES (2011) Enhanced root
Holz M, Zarebanadkouki M, Carminati A, Howind J, Kaestner A, exudation induces microbial feedbacks to N cycling in a
Spohn M. (2019) Increased water retention in the rhizo- pine forest under long-term CO2 fumigation. Ecol Lett
sphere allows for high phosphatase activity in drying soil. 14:187–194
Plant Soil 443:259–27. https://doi.org/10.1007/s11104-019- R Core Team (2017) R: A language and environment for statistical
04234-3 computing. R Foundation for Statistical Computing, Vienna,
Holz M, Zarebanadkouki M, Carminati A, Becker JN, Spohn M Austria. URL https://www.R-project.org/
(2020) The effect of root hairs on rhizosphere phosphatase Razavi BS, Zarebanadkouki M, Blagodatskaya E (2016)
activity. J Plant Nutr Soil Sci 183:382–388 Rhizosphere shape of lentil and maize : spatial distribution
Hütsch BW, Augustin J, Merbach W (2002) Plant rhizodeposition of enzyme activities. Soil Biol Biochem 96:229–237
- an important source for carbon turnover in soils. J Plant Nutr Roose T, Keyes SD, Daly KR, Carminati A, Otten W, Vetterlein
Soil Sci 165:397–407 D, Peth S (2016) Challenges in imaging and predictive
Jones DL, Hinsinger P (2008) The rhizosphere: complex by de- modeling of rhizosphere processes. Plant Soil 407:9–38
sign. Plant Soil 312:1–6 Ryan MG, Law BE (2005) Interpreting, measuring, and modeling
Jones DL, Nguyen C, Finlay RD (2009) Carbon flow in the soil respiration. Biogeochemistry 73:3–27
rhizosphere: carbon trading at the soil–root interface. Plant Schenck Zu Schweinsberg-Mickan M, Joergensen RG, Müller T
Soil 321:5–33 (2010) Fate of 13C- and 15N-labelled rhizodeposition ofPlant Soil (2021) 464:489–499 499
Lolium perenne as function of the distance to the root surface. Tawaraya K, Horie R, Saito A, Shinano T, Wagatsuma T, Saito K,
Soil Biol Biochem 42:910–918 Oikawa A (2013) Metabolite profiling of shoot extracts, root
Schlesinger WH (1997) Biogeochemistry. An Analysis of Global extracts, and root exudates of Rice Plant under phosphorus
Change. 2nd Edition, Academic Press, San Diego, London, deficiency. J Plant Nutr 36:1138–1159
Boston, New York, Sydney, Tokyo, Toronto. p 588 Wick B, Kühne RF, Vielhauer K et al (2002) Temporal variability
Spohn M, Kuzyakov Y (2013) Distribution of microbial-and root- of selected soil microbiological and biochemical indicators
derived phosphatase activities in the rhizosphere depending under different soil quality conditions in South-Western
on P availability and C allocation–coupling soil zymography Nigeria. Biol Fertil Soils 35:155–167
with 14C imaging. Soil Biol Biochem 67:106–113 Wickham H (2016) ggplot2: Elegant Graphics for Data Analysis.
Spohn M, Carminati A, Kuzyakov Y (2013) Soil zymography - a Springer-Verlag New York. https://doi.org/10.1007/978-3-
novel in situ method for mapping distribution of enzyme 319-24277-4
activity in soil. Soil Biol Biochem 58:275–280
Sun L, Ataka M, Kominami Y, Yoshimura K (2017)
Publisher’s note Springer Nature remains neutral with regard to
Relationship between fine-root exudation and respiration
jurisdictional claims in published maps and institutional
of two Quercus species in a Japanese temperate forest.
affiliations.
Tree Physiol 37:1011–1020You can also read