Effect of environmental conditions and genotype on nectar secretion in sunflower (Helianthus annuus L.)
←
→
Page content transcription
If your browser does not render page correctly, please read the page content below
OCL 2020, 27, 51
© S. Chabert et al., Hosted by EDP Sciences, 2020
https://doi.org/10.1051/ocl/2020040                                                                                                      OCL
                                                                                                                                          Oilseeds & fats Crops and Lipids

                                                                                                                                    Available online at:
                                                                                                                                    www.ocl-journal.org

    RESEARCH ARTICLE

Effect of environmental conditions and genotype on nectar
secretion in sunflower (Helianthus annuus L.)
Stan Chabert1,*, Christopher Sénéchal2, André Fougeroux2, Jérémy Pousse2, Fabien Richard1,
Emma Nozières2, Olivier Geist1, Vincent Guillemard2, Solenne Leylavergne2, Constance Malard3,
Alexandre Benoist4, Gabriel Carré2, Édith Caumes3, Charlotte Cenier4, Alain Treil2,
Sébastien Danflous2 and Bernard E. Vaissière1
1
  Institut national de recherche pour l’agriculture, l’alimentation et l’environnement (INRAE), UR406 Abeilles et Environnement, site
Agroparc, domaine Saint-Paul, CS 40509, 84914 Avignon cedex 9, France
2
  Syngenta, 12 chemin de l’Hobit, 31790 Saint-Sauveur, France
3
  Arterris Innovation, 24 avenue Marcel-Dassault, 31500 Toulouse, France
4
  Agrosolutions, 17 rond-point de l’Europe, 51430 Bezannes, France

             Received 1 May 2020 – Accepted 21 August 2020

             Abstract – The sunflower crop provides an important honey flow for beekeepers. In France, beekeepers
             observed a decrease in honey yield from this crop these past years compared to the 1980s–1990s. They
             suspect the new cultivars to be less productive in nectar compared to the older ones, but no data is available
             to support this, and it is known that climate conditions have a strong impact on nectar secretion. This study
             aimed to explore the effect of abiotic environmental conditions on nectar secretion in sunflower, as well the
             range of variation of this secretion in a sample of current cultivars. Thirty-four current sunflower hybrid
             cultivars were sampled in test plots for their nectar secretion under varying conditions of temperature, air
             humidity and soil moisture. Air humidity controlled the sugar concentration of nectar, and thus its volume.
             To study nectar secretion independently from this effect, analyses subsequently focused on nectar sugar
             mass per floret. The nectar sugar mass increased with temperature up to an optimum of 32 °C, while the
             variation range of soil water tension was not sufficient to detect an effect on nectar sugar mass. This varied
             by up to 100% among the 34 cultivars (from 101 to 216 mg sugar per staminate floret in average), with
             a similar range to those reported in the literature for older cultivars. Likewise, oleic cultivars, a new type
             introduced since the early 2000s, were found to secrete the same amounts of nectar as linoleic cultivars, an
             older conventional type. The more self-fertile cultivars also showed no reduction in nectar secretion. Finally,
             we tested the method that measures the nectar gross secretion rate in one hybrid, and we observed that this
             hybrid secreted in average 28 mg sugar per hour per staminate floret. The potential benefits of this method
             were discussed.

             Keywords: nectar / sunflower / cultivars / abiotic conditions / methodology

             Résumé – Effet des conditions environnementales et du génotype sur la sécrétion de nectar chez le
             tournesol (Helianthus annuus L.). Le tournesol constitue une miellée importante pour les apiculteurs. En
             France, les apiculteurs ont constaté des baisses de miellées sur cette culture ces dernières années par rapport
             aux années 1980–1990. Ils suspectent les nouvelles variétés d’être moins nectarifères que les plus anciennes,
             mais aucune donnée ne permet de l’établir, et l’on sait que les conditions climatiques ont un fort impact sur la
             sécrétion de nectar. Cette étude avait pour objectif d’explorer l’effet des conditions environnementales
             abiotiques sur la sécrétion de nectar chez le tournesol, ainsi que la gamme de variation de cette sécrétion sur
             un échantillon de variétés courantes. Trente-quatre variétés hybrides actuelles de tournesol ont été
             échantillonnées dans des micro-parcelles pour leur sécrétion nectarifère dans des conditions variables de
             température et d’humidité de l’air et du sol. L’humidité de l’air contrôlait la concentration du nectar et donc
             son volume. Pour s’affranchir de cet effet, l’analyse a porté ensuite sur la masse de sucres sécrétée par

*Correspondence: stan.chabert@inrae.fr

This is an Open Access article distributed under the terms of the Creative Commons Attribution License (https://creativecommons.org/licenses/by/4.0), which permits
                           unrestricted use, distribution, and reproduction in any medium, provided the original work is properly cited.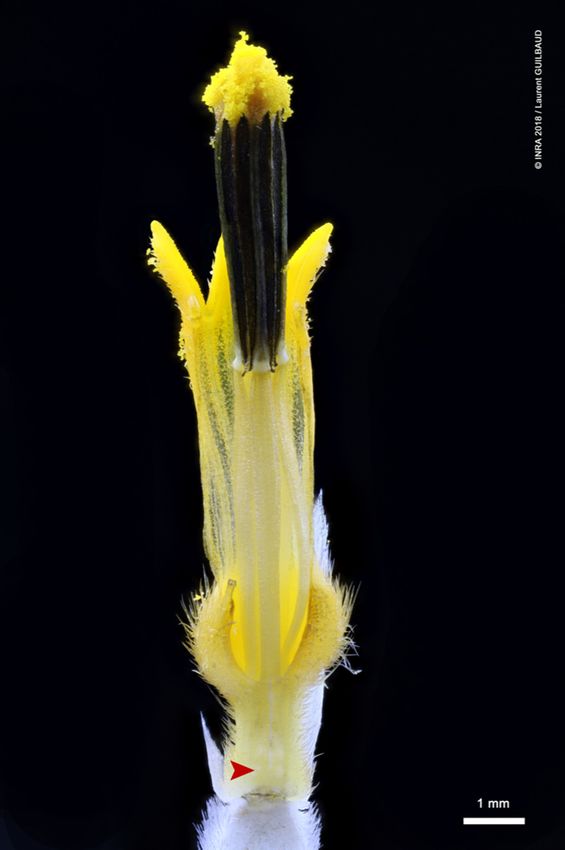
S. Chabert et al.: OCL 2020, 27, 51

           fleuron. Cette masse de sucres a augmenté avec la température jusqu’à un optimum de 32 °C, tandis que la
           gamme de variation de la tension hydrique du sol n’a pas été suffisamment importante pour observer une
           diminution de la masse de sucres par fleuron. Cette masse de sucres a varié du simple au double parmi les
           trente-quatre variétés étudiées (de 101 à 216 mg de sucres par fleuron staminé en moyenne), mais la gamme
           de variation observée n’était pas différente de celles rapportées dans la littérature pour des variétés plus
           anciennes. De même, les variétés oléiques, type nouveau introduit depuis le début des années 2000, ne
           se sont pas révélées moins nectarifères que le type linoléique conventionnel, plus ancien. Les variétés
           plus auto-fertiles n’étaient pas non plus moins nectarifères. Enfin, nous avons testé la méthode qui
           mesure le taux de sécrétion brut du nectar sur un hybride, et nous avons observé que cet hybride sécrétait
           en moyenne 28 mg de sucres par heure par fleuron staminé. Les potentiels avantages de cette méthode
           ont été discutés.

           Mots clés : nectar / tournesol / variétés / conditions abiotiques / méthodologie

1 Introduction                                                        1999; Bertazzini and Forlani, 2016; Carruthers et al., 2017;
                                                                      Ouvrard et al., 2017), Pierre and Emeillat (2009) found that the
    Studying floral nectar secretion of entomophilous crops            low numbers of honey bee visits to flowers observed by
can be of importance for crop production, as the more a crop          beekeepers in the early 2000s were due more to adverse
secretes floral nectar, the more it is visited by pollinators          weather conditions than to new cultivars which were not
(Prasifka et al., 2018). It is especially so in the case for          particularly unproductive in nectar. Indeed, nectar secretion is
sunflower (Helianthus annuus; Asteraceae) (Tepedino and                directly dependent on temperature and soil moisture. Nectar
Parker, 1982; Mallinger and Prasifka, 2017), for which an             secretion increases with temperature up to an optimum, and
average of 0.2 bees per head is sufficient to maximise seed            then decreases (Kenoyer, 1917; Findlay et al., 1971; Villarreal
yield and oil content (Chabert et al., 2019, in prep). Therefore,     and Freeman, 1990; Nicolson, 1995; Petanidou and Smets,
entomophilous crops need to be attractive enough to get               1996; Takkis et al., 2015, 2018; Chabert et al., 2017).
enough pollinator visits so that their yields are not limited by      It decreases as soil water tension or plant water stress increase
a pollination deficit.                                                 (Villarreal and Freeman, 1990; Carroll et al., 2001; Descamps
    On the other hand, entomophilous crops can be a source of         et al., 2018, 2020; Phillips et al., 2018), and thus increases with
nectar relied upon by beekeepers to produce honey, especially         soil moisture (Wyatt et al., 1992; Waser and Price, 2016;
oilseed crops such as sunflower (Breeze et al., 2019).                 Gallagher and Campbell, 2017; Mueller et al., 2020).
In France, to explain the decrease of honey yields observed           However, Gillespie et al. (2015) observed an optimum of
in this crop since the 1980’s and 1990’s (Cerrutti and Pontet,        soil moisture beyond which nectar secretion decreased. This
2016), some beekeepers suspect recent cultivars to secrete less       sensitivity to soil water tension varies with the genotype
nectar compared to the older ones, in particular oleic cultivars,     (Boose, 1997; Leiss and Klinkhamer, 2005; Suni et al., 2020),
carrying a type introduced since the early 2000s (Tonin, 2018).       or with stresses applied on plants (Lindström et al., 2018).
Some beekeepers also suspect breeding for self-fertility to           In particular, genotypes that develop a large root mass may be
have led to cultivars that are less productive in nectar.             more tolerant to high soil water tensions than genotypes which
Unfortunately, no official data is available to support these          have a smaller root mass (Leiss and Klinkhamer, 2005;
contentions.                                                          Masalia et al., 2018).
    Several studies observed differences in the quantities of             Sugar concentration of nectar is also directly dependent on
nectar secreted between lines or cultivars of sunflower, at the        relative humidity (RH) of ambient air: low RH leads to fast
floret or the whole plant scale (Tepedino and Parker, 1982;            evaporation of nectar water, and thus to a high sugar concentration,
Hadisoesilo and Furgala, 1986; Vear et al., 1990; Zajácz et al.,      while conversely high RH limits evaporation of nectar water and
2006; Ion et al., 2007; Mallinger and Prasifka, 2017). These          maintains a lower sugar concentration (Pacini and Nepi, 2007),
differences may be explained in part by differences in nectary        close to that of phloem sap, as the nectaries are supplied by the
size between genotypes (see Dafni et al., 1988; Petanidou             phloem in the Asteraceae (Sammataro et al., 1985; Pacini et al.,
et al., 2000; Galetto and Bernardello, 2004). This was the            2003; Wist and Davis, 2006, 2008).
hypothesis adopted by Sammataro et al. (1985) for sunflower.               This study aimed to explore (i) the effect of abiotic
Additionally, there does not seem to be a difference in the           environmental conditions on nectar secretion in sunflower, i.e.
quantity of nectar secreted at the floret level between male           air humidity, air temperature, soil moisture, and time of day,
sterile lines on one hand, and male fertile lines on the other        and (ii) the range of variation of nectar secretion among several
hand (see Fig. 1; Tepedino and Parker, 1982; Vear et al., 1990;       current sunflower hybrids. In particular, the nectar secretion of
Mallinger and Prasifka, 2017), unlike for instance oilseed rape       some oleic cultivars was compared to that of several linoleic
(Brassica napus L.) (Pierre et al., 1999; Chabert et al., 2017).      cultivars (the linoleic type being a more conventional and older
No differences in floret size, and even more, in nectary size          type than the oleic one), and we also tested the possible
have been reported between these two genetic types in                 correlation between the level of nectar secretion and the level
sunflower.                                                             of self-fertility in this pool of cultivars. Finally, we tested
    In oilseed rape, despite differences of nectar secretion also     another method to measure the nectar secretion, the one which
observed between lines or cultivars (Szabo, 1982; Pierre et al.,      measures the gross secretion rate.

                                                              Page 2 of 12
S. Chabert et al.: OCL 2020, 27, 51
Fig. 1. Comparison of apparent nectar secretion between different types of sunflower genotypes, from three studies. A line: genic or cytoplasmic
male sterile line; B line: male fertile line; R line: male fertile line provided with the restorer nuclear gene of fertility. Male sterile F1 hybrid: result
of a cross between a cytoplasmic male sterile line and a B line. Male fertile F1 hybrid: result of a cross between a genic male sterile line (recessive
allele) and a B line, or between a cytoplasmic male sterile line and an R line. The reference studies are given with the sampled floret stage and the
method of nectar extraction. The sugar mass data of Tepedino and Parker (1982) and Vear et al. (1990) were calculated using the formula of
Cruden and Hermann (1983) from the nectar volume and the sugar concentration (measured by gas chromatography in Vear et al., 1990) given
for each genotype in the respective Tables 1 of these studies. The data of Mallinger and Prasifka (2017) were recovered using Plot Digitizer 2.6.8
(http://plotdigitizer.sourceforge.net/) from their Figure 1a.
2 Materials and methods where M is the sugar mass in mg, V the nectar volume in nL,
and C the sugar concentration in g of sugar per 100 g of
2.1 Nectar sampling solution (% Brix). This method made it possible to assess the
apparent nectar secretion rate (Corbet, 2003), hereafter called
To meet these objectives, 34 current oilseed F1 hybrid ASR.
cultivars of sunflower,® coded from 1 to 34, were sampled in test
plots of the Syngenta site of Lombez, France. Twenty-three of
these cultivars were oleic, and the remaining 11 others were
linoleic. Two plots per cultivar were sown two weeks apart in 2.2 Abiotic environmental conditions
April each year to extend the sampling period during flowering Air temperature and relative humidity were recorded every
and they were distributed at random among the plots. The hour during flowering with one sensor placed in a shelter in the
measures were made in July 2016–2019, between 07:00 h and centre of the plots. Soil moisture was measured with a
17:00 h GMT on at least four dates per cultivar each year. ®
Watermark sensor (Irrometer , USA) that recorded soil water
Plants were regularly watered to avoid an excessive water tension at a depth of 30 and 60 cm once a day.
stress. For each cultivar and each sampling date, three heads
chosen at random among those in the R5.3–R5.6 stage
(reproductive stage with 30–60% of the head florets open)
were isolated under tulle bags of 1 mm mesh size (cloth F510, 2.3 Rate of self-fertility
Diatex, France) the day before to prevent insect foraging. As
The self-fertility rate of twenty cultivars was measured in
nectar secretion can be very variable from one floret to another ®
test plots of the Syngenta site of Grisolles, France, in 2018
depending on the head region, four florets at the staminate
and 2019. Each cultivar was sown on two plots side by side
stage (Fig. 2) were sampled per head from four regions: at the
each year. One plot was covered by a cage made of screen
top, bottom, left and right of the head.
with 1 1 mm2 mesh opening during flowering to isolate
Nectar volume was extracted and measured in each floret ® heads from insect pollination, while the other plot was left for
with microcapillary tubes of 1 mL (intraEND, Blaubrand®,
® open pollination. Twenty heads chosen at random were
Germany; or® microcaps , Drummond, USA; or minicaps ,
harvested at physiological maturity in each plot each year to
Hirschmann , Germany; Fig. 3). Sugar concentration was
assess the mean seed set per pollination treatment per year.
measured with hand-held refractometers Eclipse 45–81 (0–
The self-fertility rate was calculated for each year and each
50% Brix) or 45–82 (45–80% Brix), adapted for small volumes
cultivar by dividing the number of seeds obtained on the
(Bellingham and Stanley Ltd., UK). Nectar volume and sugar
20 heads isolated under the cage by the number of seeds on
concentration were then converted into sugar mass per floret
the 20 open pollinated heads. The self-fertility rates
with the formula of Cruden and Hermann (1983):
calculated each year per cultivar were averaged over all of
M ¼ V C ð0:000046 C þ 0:009946Þ ð1Þ the years per cultivar.
Page 3 of 12S. Chabert et al.: OCL 2020, 27, 51
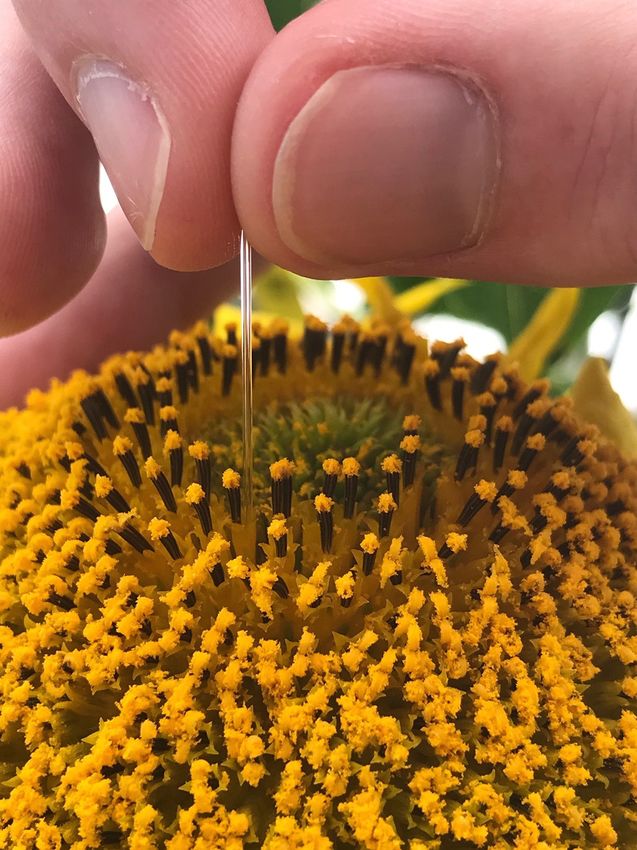
Fig. 3. Nectar extraction in a sunflower floret at the staminate stage
®
with a microcapillary tube of 1 mL. © Mathieu Mourereau, Syngenta .
Fig. 2. Sunflower floret at the staminate stage. Red arrow shows the the floret (within half an hour) was analysed by comparing two
nectary position, located at the very base of the floret, just above the models, each using a different variable to describe air humidity.
ovule (according to Sammataro et al., 1985). © Laurent Guilbaud, The first model used the relative drought (RD) of ambient air as
INRAE. explanatory variable, which was calculated as follows:
RD ¼ 100 RH
2.4 Other measure of nectar secretion: the gross where RD is the relative drought in %, and RH is the relative
secretion rate humidity in %.
The second model used the vapour pressure deficit (VPD)
The measure of the nectar gross secretion rate (Corbet,
of ambient air as explanatory variable, which measures the gap
2003), hereafter called GSR, was tested on one date (July 24,
between the saturation vapour pressure and the observed
2018) on one oleic cultivar (cv. 31), with four staminate florets
vapour pressure. VPD integrates that the amount of water
per head on six heads. This method consisted first in emptying
vapour that the air can hold varies with temperature (see
the florets of their nectar at 07:30 h GMT, which was
Grossiord et al., 2020). The VPD was calculated as follows
equivalent to measure the ASR at this time, then again
(Allen et al., 1998):
extracting the nectar in the same florets at 10:30 h GMT, then
again at 13:30 h GMT. This method enabled us to assess the 17:27 T
quantity of nectar secreted per floret during three hours, V PD ¼ 0:6108e ð237:3þT Þ ð1 RH =100Þ
between 07:30 h and 10:30 h GMT and then between 10:30 h
and 13:30 h GMT, and thus to calculate the quantity of nectar where VPD is the vapour pressure deficit in kPa, and T is the
secreted per hour. temperature in °C.
We used the two models to analyse the relation between
2.5 Data analysis sugar concentration and humidity with a piecewise polynomial
2.5.1 Air humidity function with one breakpoint (Bolker, 2008): when sugar
concentration is not in equilibrium with the air humidity level
The relation between the nectar sugar concentration per of the air humidity (Pacini and Nepi, 2007), the sugar
floret and the air humidity at the time of nectar extraction from concentration C increases linearly with RD or VPD up to reach
Page 4 of 12S. Chabert et al.: OCL 2020, 27, 51
a maximum beyond which nectar water can no longer cultivar, year, date, plot and plant set as random variables. The
evaporate. This function is written as follows: correlation between the sugar mass per floret and the rate of self-
( cmax co fertility per cultivar was tested with a Pearson correlation test.
if X < d 0 ; C ¼ x þ c0
do ð2Þ
if X > d 0 ; C ¼ cmax 2.5.5 Gross secretion rate
The mean nectar volume, sugar concentration and sugar
where C is the sugar concentration, X is the air drought level mass per floret were compared between the ASR measured at
expressed either by RD or VPD, c0 is the intercept, cmax is the 07:30 h GMT and the GSR measured at 10:30 h and 13:30 h
maximum sugar concentration beyond which nectar water can GMT on July 24, 2018 on the cultivar 31 with three linear
no longer evaporate, and d0 is the air drought level at which C mixed models, with the plant and the floret set as random
reaches cmax. variables.
2.5.2 Air temperature 2.5.6 Statistical methods, software, packages and P-
The relation between the mass of nectar sugar per floret and value threshold
the air temperature at the time of nectar extraction from the The parameters of the mechanistic models were estimated
floret (within half an hour) was analysed by using the equation with the nonlinear least squares (Bolker, 2008). These models
proposed by Yin et al. (1995) and Yan and Hunt (1999) to were compared between them and with the null model with
model the temperature response of plants following a beta Akaike information criterion (AIC; Burnham and Anderson,
distribution from the cardinal temperatures (Eq. (8c) in Yin 2002). The coefficients of determination of these models were
et al., 1995; Eq. (3) in Yan and Hunt, 1999): calculated by the deviance ratio R2D (Nakagawa and Schielzeth,
8 2
> topt tmin 3a 2013).
>
> All the statistics were computed with the software R,
< 6 tmax T T tmin tmax topt 7
if T tmax ;M ¼ mmax4 5 version 3.2.0 (R Core Team, 2015). Asymptotic 95%
> tmax topt topt tmin confidence intervals (95% CI) of mechanistic model param-
>
>
: eters were estimated with the package nlstools, version 1.0-2
if T > tmax ;M ¼ 0
(Baty et al., 2015). The mixed effects models were computed
ð3Þ with the package lme4, version 1.1-15 (Bates et al., 2015). The
P-values of the linear mixed effects models were obtained with
where T is the ambient air temperature, mmax is the maximum the package lmerTest, version 2.0-36 (Kuznetsova et al.,
sugar mass secreted per floret at the optimum temperature topt, 2017). The chosen P-value threshold for statistical significance
tmin is the minimum temperature below which nectar secretion was 0.005, as recommended by Johnson (2013) and Benjamin
is nil, tmax is the maximum temperature above which nectar et al. (2018).
secretion is nil again, and a is a parameter that determines the
shape of the curve. 3 Results and discussion
2.5.3 Soil moisture and time of day 3.1 Air humidity
The effects of soil water tension and time of day were Nectar sugar concentration was very variable, from 8% up
tested on the sugar mass per floret with two linear mixed to almost 80%, with a VPD ranging from 0.1 to 4.4 kPa. VPD
models. The cultivar, year, date, plot and plant were set as was more suitable than RD to explain the variation of sugar
random variables. concentration (Tab. 1). Sugar concentration increased with
VPD, from a predicted mean concentration of 23.2% when the
2.5.4 Genotype air was saturated in humidity, a concentration probably close to
that at which the nectar is secreted, to a mean maximum
The cultivars were sorted in ascending order of mean sugar concentration of 55.6% at a VPD of 0.75 kPa (Tab. 1; Fig. 4a).
mass secreted per floret. Their range of mean sugar masses was VPD explained 55.6% of the variation in sugar concentration.
compared descriptively with those of Hadisoesilo and Furgala To study nectar secretion independently of this effect, the
(1986), Vear et al. (1990), Zajácz et al. (2006), and Ion et al. quantity of nectar was subsequently analysed based on the
(2007) for hybrids. The data of sugar mass per floret of Vear sugar mass produced, and not according to the volume
et al. (1990) were obtained using equation (1) from the nectar secreted. For information, sugar concentration was also
volume and the dry matter percentage measured by gas showed in relation with relative humidity (Fig. 4b).
chromatography (as the authors recommend this method
compared with that using enzyme electrode) given in their
Table 1. Hadisoesilo and Furgala (1986) measured sugar mass 3.2 Soil moisture
by centrifugation of florets at the pistillate stage, while Vear
et al. (1990) used microcapillary tubes on florets at the Despite a large variation of soil water tension (from 0 to
staminate stage, and Zajácz et al. (2006) and Ion et al. (2007) 240 Centibars at 30 cm deep and from 0 to 200 Centibars at 60 cm
used microcapillary tubes on florets of unspecified stage. deep), the sugar mass did not vary with the increase in water
The mean sugar mass per floret was compared between oleic tension, measured either at 30 cm deep (t = 2.58; P = 0.012;
and linoleic cultivars with a linear mixed model, with the Fig. 5a) or at 60 cm (t = 2.49; P = 0.017; Fig. 5b). This is probably
Page 5 of 12S. Chabert et al.: OCL 2020, 27, 51
Table 1. Statistics of the piecewise polynomial models (Eq. (2)) between nectar sugar concentration in the floret and air humidity, approximated
either by the relative drought or by the vapour pressure deficit.
Model k Parameter values ± 95% CI R2D AIC Model rank DAIC
d0 c0 cmax
Null 2 54,574 3 23,363
Relative drought 4 28.1 ± 1.0 17.1 ± 2.8 55.7 ± 0.4 0.552 31,485 2 274
Vapour pressure deficit 4 0.750 ± 0.033 23.2 ± 2.3 55.6 ± 0.4 0.556 31,211 1 0
k: number of estimated parameters per model; CI: confidence interval; R2D: coefficient of determination calculated by the deviance ratio; model
rank: model ranking by increasing AIC value; DAIC: AIC value minus the lowest AIC; d0: drought level at which the sugar concentration
reaches cmax; c0: intercept; cmax: maximum sugar concentration beyond which nectar water can no longer evaporates. The model in bold is the
one with the minimum AIC value.
Fig. 4. Relation between sugar concentration per floret and the vapour Fig. 5. Relation between nectar sugar mass per floret and the soil
pressure deficit (VPD) (a) or the relative air humidity (b) at the time of water tension at 30 (a) or 60 (b) cm deep.
nectar extraction. Solid line depicts Eq. (2) with parameters given in
Table 1. on the overall range of cultivars sampled (±3.8, 95% CI;
t = 4.16; P < 0.005; Fig. 6).
due to the fact that plants were regularly watered, avoiding
excessive water stress. Higher soil water tensions would 3.4 Air temperature
probably have been necessary to detect a threshold of water
stress impacting nectar secretion. Nectar sugar mass per floret increased with air temperature
over the range of 16–32°C and appeared to decrease beyond
3.3 Time of day 32 °C on the overall range of cultivars sampled (Tab. 2; Fig. 7).
However, a true estimation of topt, tmin and tmax would have
Nectar sugar mass per floret increased with the time of day required temperatures below 16 °C and also above 35 °C.
between 07:00 h and 17:00 h GMT at a mean rate of 8.0 mg.h1 Furthermore, the temperature at the time of nectar extraction
Page 6 of 12S. Chabert et al.: OCL 2020, 27, 51
Fig. 6. Relation between nectar sugar mass per floret and the time of Fig. 7. Relation between nectar sugar mass per floret and the
day. Solid line depicts the predictions of the linear mixed model. temperature at the time of nectar extraction. Solid line depicts the
predictions of Eq. (3) with parameters given in Table 2.
Table 2. Statistics of the beta distribution model (Eq. (3)) between nectar sugar mass per floret and air temperature.
Model k Parameter values ± 95% CI R2D AIC Model rank DAIC
a mmax tmin topt tmax
Null 2 32 029 2 118
Temperature 4 0.618 ± 0.515 180 ± 8 11.0 ± 86.7 32.0 ± 0.5 36.3 ± 0.8 0.046 31 911 1 0
k: number of estimated parameters per model; CI: confidence interval; R2D: coefficient of determination calculated by the deviance ratio; model
rank: model ranking by increasing AIC value; DAIC: AIC value minus the lowest AIC; a: parameter that determines the shape of the curve;
mmax: maximum sugar mass secreted per floret at the optimum temperature topt; tmin, tmax: respectively minimum, maximum, temperature below
and above which nectar secretion is nil.
from the floret does not depict the real temperature range met sugars from damaged plant tissue cells (Mesquida et al., 1988;
by the floret during all the secretion process. To test this Vear et al., 1990). From these few elements of literature, it is
variable correctly, the method that measures the nectar GSR therefore not possible to assert that current hybrids secrete less
should have been used instead, by associating the sugar mass nectar than those from the 1980’s or 2000’s.
measured in the floret with the average of the temperatures met Furthermore, the data available show no evidence for a
by the floret between the time it was emptied and the time of negative correlation between the amount of nectar secreted and
measurement (see for instance Nicolson, 1995; Chabert et al., the level of self-fertility of the hybrids studied (R = -0.17;
2017). P = 0.473; Fig. 9). If these two traits are not genetically linked,
there is no reason to expect that they should be inversely
correlated. While it is true that nectar secretion can be costly
3.5 Genotype
for plants (Southwick, 1984; Pyke, 1991), natural selection
As in other studies, the nectar sugar mass secreted per floret does not operate alone in crop selection programs. More
varied among cultivars sampled, ranging from 101 to 216 mg investigations are necessary to conclude on this link since the
sugar per floret on average (Fig. 8), with no difference between rate of self-fertility can be quite variable for one cultivar
the oleic and linoleic types (t = 0.46; P = 0.649). This range is according to where it is grown (Chabert et al., in prep). Nectar
similar to those observed by Vear et al. (1990) with eight secretion and self-fertility should be measured in the same
hybrids (ranging from 36 to 190 mg sugar per floret; see Fig. 8), field, which was not the case in our study.
by Zajácz et al. (2006) with 19 hybrids (ranging from 40 to
100 mg sugar per floret), and by Ion et al. (2007) with 3.6 Other measure of nectar secretion: the gross
33 hybrids (ranging from 70 to 250 mg sugar per floret; see secretion rate
Fig. 8). However, this range is lower than that observed by
Hadisoesilo and Furgala (1986) with 18 oilseed hybrids, By emptying the florets with the method that measures the
ranging from 303 to 491 mg sugar per floret. But in their study, nectar GSR, sugar concentration was 20.4% at 10:30 h GMT
the nectar was extracted by centrifugation of pistillate florets, and 14.6% at 13:30 h GMT, while it was 50.1% at 07:30 h
while this method artificially dilutes the nectar and it may add GMT with the ASR method (Tab. 3; Fig. 10b). As the mean
Page 7 of 12Page 8 of 12
Fig. 8. Sugar mass per floret according to the F1 hybrid cultivar (coded name from 1 to 34 for the results of this present study). The data of Vear et al. (1990) and Ion et al. (2007) on
the left are displayed for comparison. The nectar was extracted with microcapillary tubes in staminate florets of F1 hybrids in Vear et al. (1990), as in our study, or in florets of
unspecified stage in Ion et al. (2007).
S. Chabert et al.: OCL 2020, 27, 51S. Chabert et al.: OCL 2020, 27, 51
Table 3. Pairwise comparisons of the mean nectar quantity and sugar concentration per floret between the two measure methods used and the
three times of measurement (see Fig. 10).
Compared treatments Nectar volume (nL) Sugar concentration (%) Sugar mass (mg)
b ± SE t P b ± SE t P b ± SE t P
GSR 10:30 versus ASR 07:30 242 ± 50 4.84S. Chabert et al.: OCL 2020, 27, 51
inhibits the resorption process which occurs concomitantly that are subject of this study were coded for confidentiality
with the secretion process (Nepi and Stpiczyń ska, 2008). reasons.
Therefore, to estimate the total sugar mass produced by one
hectare of sunflower crop foraged by bees, one should estimate Authors’ contributions
the GSR of this crop and multiply it by the nectar secretion
period (e.g. Chabert et al., 2018), the number of florets per B.E.V., C.S., A.F., A.B., G.C., E.C., C.C. and A.T.
head and the number of plants per ha. conceived the study, J.P., F.R., E.N., O.G., V.G., S.L. and C.M.
performed field work, S.D. sowed and monitored the sunflower
4 Conclusions test plots, S.C. analysed the data, S.C. and B.E.V. wrote the
manuscript. All authors gave final approval for publication.
Our study showed that abiotic environmental conditions,
such as air temperature, impacted the secreted sugar mass per
sunflower floret, with minimum, optimum and maximum References
temperatures that remain to be accurately assessed. The air
humidity impacted sugar concentration, highlighting the need Allen RG, Pereira LS, Raes D, Smith M. 1998. Crop evapotranspira-
to analyse nectar secretion based upon sugar mass rather than tion. Guidelines for computing crop water requirements. FAO
nectar volume. However, we could not observe a soil water Irrigation and drainage paper 56. FAO 300(9): D05109.
Bates D, Maechler M, Bolker B, Walker S. 2015. Fitting linear mixed-
tension effect, probably due to a limited range of variation
effects models using lme4. J Stat Soft 67(1): 1–48.
encountered for this factor.
Baty F, Ritz C, Charles S, Brutsche M, Flandrois JP, Delignette-
We also were able to highlight a variation range of more Muller ML. 2015. A toolbox for nonlinear regression in R: the
of 100% in sugar mass secreted per floret between different package nlstools. J Stat Soft 66: 1–21.
current sunflower hybrids, but with no evidence for reduced Benjamin DJ, Berger JO, Johannesson M, et al. 2018. Redefine
sugar yield between oleic and linoleic cultivars, between statistical significance. Nat Hum Behav 2(1): 6–10.
current cultivars compared to those grown in 1980–2000, or Bertazzini M, Forlani G. 2016. Intraspecific variability of floral nectar
between very self-fertile and less self-fertile cultivars. volume and composition in rapeseed (Brassica napus L. var.
Studies therefore remain to be carried out to assess and oleifera). Front Plant Sci 7: 288.
potentially explain the poor honey yields reportedly Bolker BM. 2008. Ecological models and data in R. Princeton:
encountered at present by beekeepers placing their honey Princeton University Press.
bees on sunflower crops. Other variables may need to be Boose DL. 1997. Sources of variation in floral nectar production rate
considered, such as the floret length, which could limit the in Epilobium canum (Onagraceae): implications for natural
access of bees to nectar when florets are too long (see selection. Oecologia 110(4): 493–500.
Mallinger and Prasifka, 2017; Portlas et al., 2018), or the Breeze TD, Boreux V, Cole L, et al. 2019. Linking farmer and
number of colonies per crop unit area, since the sunflower beekeeper preferences with ecological knowledge to improve
crop area in France was divided by almost two between the crop pollination. People Nat 1(4): 562–572.
1985–1995 and the 2000–2010 years (FAOSTAT, 2020; see Burnham KP, Anderson DR. 2002. Model selection and multimodel
Figure 1 in Chabert et al., 2019). inference: a practical information-theoretic approach. Berlin
Finally, the advantages of using the method that measures (Germany): Springer.
the nectar gross secretion rate were discussed, as the urquez A, Corbet SA. 1991. Do flowers reabsorb nectar? Funct Ecol
B
5(3): 369–379.
assessment of a secretion rate in mg of sugar per hour.
Carroll AB, Pallardy SG, Galen C. 2001. Drought stress, plant water
status, and floral trait expression in fireweed, Epilobium
angustifolium (Onagraceae). Am J Bot 88(3): 438–446.
Funding sources Carruthers JM, Cook SM, Wright GA, et al. 2017. Oilseed rape
®
(Brassica napus) as a resource for farmland insect pollinators:
This work was supported by Syngenta , Arterris Innova- quantifying floral traits in conventional varieties and breeding
tion and Agrosolutions. These sponsors contributed to the systems. GCB Bioener 9(8): 1370–1379.
study design and to the data collection. Castellanos MC, Wilson P, Thomson JD. 2002. Dynamic nectar
replenishment in flowers of Penstemon (Scrophulariaceae). Am J
Acknowledgements. We thank Isabelle Besse and Angélique Bot 89(1): 111–118.
Nicoli for the administrative management of the sunflower test Cerrutti N, Pontet C. 2016. Differential attractiveness of sunflower
plots, Mathieu Mourereau for providing meteorological data, cultivars to the honeybee Apis mellifera L. OCL 23(2): D204.
and Marc Amiot, Jean-Paul Andrieu, Gilles Gree, Attila Chabert S, Lemoine T, Fronteau L, Vaissière BE. 2017. Mesurer la
Kovacs, Sylvain Lascabettes and Alexandr Tsybulskiy for sécrétion nectarifère : exemple d’une lignée hybride F1 et de son
providing the data on self-fertility rate of sunflower. We are parent mâle stérile chez le colza d’hiver (Brassica napus L.). OCL
also very grateful to Felicity Vear for critical reading of the 24(6): D602.
manuscript. We thank one anonymous reviewer for her/his Chabert S, Lemoine T, Cagnato MR, Morison N, Vaissière BE. 2018.
constructive comments that enabled us to improve the Flower age expressed in thermal time: is nectar secretion
manuscript. synchronous with pistil receptivity in oilseed rape (Brassica
napus L.)? Environ Exp Bot 155: 628–640.
Conflicts of interest. The authors declare that they have no Chabert S, Sénéchal C, Benoist A, et al. 2019. Tournesol : la
conflicts of interest in relation to this article. The cultivars pollinisation au service du rendement. Phytoma 729: 45–49.
Page 10 of 12S. Chabert et al.: OCL 2020, 27, 51
Corbet SA. 2003. Nectar sugar content: estimating standing crop and seedling growth in cultivated sunflower (Helianthus annuus L.)
secretion rate in the field. Apidologie 34(1): 1–10. under well-watered and water-limited conditions. PLoS One 13
Cruden RW, Hermann SM. Studying nectar? Some observations on (9): e0204279.
the art. In: Bentley B, Elias T, eds. The biology of nectaries. New Mesquida J, Marilleau R, Minh-Hà PD, Renard M. 1988. A study of
York (USA): Columbia University Press, 1983, pp. 223–241. rapeseed (Brassica napus L. var. oleifera Metzger) flower nectar
Cruden RW, Hermann SM, Peterson S. Patterns of nectar production secretions. Apidologie 19(3): 307–318.
and plant-pollinator coevolution. In: Bentley B, Elias T, eds. The Mione T, Diaz, IA. 2020. Dracula’s mistress: removal of blood-red
biology of nectaries. New York (USA): Columbia University floral nectar results in secretion of more nectar. Plant Ecol Evol
Press, 1983, pp. 80–125. 153(1): 59–66.
Dafni H, Lensky Y, Fahn A. 1988. Flower and nectar characteristics of Mueller AL, Berger CA, Schittenhelm S, Stever-Schoo B, Dauber J.
nine species of Labiatae and their influence on honeybee visits. 2020. Water availability affects nectar sugar production and insect
J Apic Res 27(2): 103–114. visitation of the cup plant Silphium perfoliatum L. (Asteraceae).
Descamps C, Quinet M, Baijot A, Jacquemart AL. 2018. Temperature J Agron Crop Sci, in press.
and water stress affect plant-pollinator interactions in Borago Nepi M, Stpiczyń ska M. 2008. The complexity of nectar: secretion
officinalis (Boraginaceae). Ecol Evol 8(6): 3443–3456. and resorption dynamically regulate nectar features. Naturwis-
Descamps C, Marée S, Hugon S, Quinet M, Jacquemart AL. 2020. senschaften 95(3): 177–184.
Species-specific responses to combined water stress and Nakagawa S, Schielzeth H. 2013. A general and simple method for
increasing temperatures in two bee-pollinated congeners obtaining R2 from generalized linear mixed-effects models.
(Echium, Boraginaceae). Ecol Evol 10(13): 6549–6561. Methods Ecol Evol 4: 133–142.
FAOSTAT. 2020. Food and Agriculture Organization of the United Nicolson SW. 1993. Low nectar concentrations in a dry atmosphere:
Nations Statistics Division. Available from http://www.fao.org/ a study of Grevillea robusta (Proteaceae) and Callistemon
faostat/en/#home. viminalis (Myrtaceae). S Afr J Sci 89(10): 473–477.
Findlay N, Reed ML, Mercer FV. 1971. Nectar production in Abutilon Nicolson SW. 1995. Direct demonstration of nectar reabsorption in
III. Sugar secretion. Aust J Biol Sci 24(3): 665–675. the flowers of Grevillea robusta (Proteaceae). Funct Ecol 9(4):
Galetto L, Bernardello G. 2004. Floral nectaries, nectar production 584–588.
dynamics and chemical composition in six Ipomoea species Ouvrard P, Quinet M, Jacquemart AL. 2017. Breeding system and
(Convolvulaceae) in relation to pollinators. Ann Bot 94(2): 269–280. pollination biology of Belgian oilseed rape cultivars (Brassica
Gallagher MK, Campbell DR. 2017. Shifts in water availability napus). Crop Sci 57(3): 1455–1463.
mediate plant-pollinator interactions. New Phytol 215(2): 792– Pacini E, Nepi M. Nectar production and presentation. In Nicolson
802. SW, Nepi M, Pacini E, eds. Nectaries and nectar. Dordrecht (The
Gillespie S, Long R, Williams N. 2015. Indirect effects of field Netherlands): Springer, 2007, pp. 167–214.
management on pollination service and seed set in hybrid onion Pacini E, Nepi M, Vesprini JL. 2003. Nectar biodiversity: a short
seed production. J Econ Entomol 108(6): 2511–2517. review. Plant Syst Evol 238(1–4): 7–21.
Grossiord C, Buckley TN, Cernusak LA, et al. (2020). Plant responses Petanidou T, Goethals V, Smets E. 2000. Nectary structure of Labiatae
to rising vapor pressure deficit. New Phytol 226(6): 1550–1566. in relation to their nectar secretion and characteristics in a
Hadisoesilo S, Furgala B. 1986. The effect of cultivar, floral stage and Mediterranean shrub community—Does flowering time matter?
time of day on the quantity and quality of nectar extracted from Plant Syst Evol 225(1–4): 103–118.
oilseed sunflower (Helianthus annuus L.) in Minnesota. Am Bee J Petanidou T, Smets E. 1996. Does temperature stress induce nectar
126(9): 630–632. secretion in Mediterranean plants? New Phytol 133(3): 513–518.
Ion N, Stefan V, Ion V, Fota V, Coman R. 2007. Results concerning the Phillips BB, Shaw RF, Holland MJ, et al. 2018. Drought reduces
melliferous characteristics of the sunflower hybrids cultivated in floral resources for pollinators. Glob Change Biol 24(7): 3226–
Romania. Sci Pap Anim Sci Biotech 40(2): 80–90. 3235.
Johnson VE. 2013. Revised standards for statistical evidence. Proc Pierre J, Emeillat R. 2009. Les variétés de colza actuelles sont-elles
Natl Acad Sci 110(48): 19313–19317. peu nectarifères pour les abeilles ? Bull Tech Apic 36(1): 17–24.
Kenoyer LA. 1917. Environmental influences on nectar secretion. Bot Pierre J, Mesquida J, Marilleau R, Pham-Delègue MH, Renard M.
Gaz 63: 249–365. 1999. Nectar secretion in winter oilseed rape, Brassica napus—
Kuznetsova A, Brockhoff PB, Christensen RHB. 2017. lmerTest quantitative and qualitative variability among 71 genotypes. Plant
package: tests in linear mixed effects models. J Stat Soft 82(13): Breed 118(6): 471–476.
1–26. Portlas ZM, Tetlie JR, Prischmann-Voldseth D, Hulke BS, Prasifka JR.
Leiss KA, Klinkhamer PGL. 2005. Genotype by environment 2018. Variation in floret size explains differences in wild bee
interactions in the nectar production of Echium vulgare. Funct visitation to cultivated sunflowers. Plant Genet Res 16(6): 498–503.
Ecol 19(3): 454–459. Prasifka JR, Mallinger RE, Portlas ZM, et al. 2018. Using nectar-
Lindström SAM, Klatt BK, Smith HG, Bommarco R. 2018. Crop related traits to enhance crop-pollinator interactions. Front Plant
management affects pollinator attractiveness and visitation in Sci 9: 812.
oilseed rape. Basic Appl Ecol 26: 82–88. Pyke GH. 1991. What does it cost a plant to produce floral nectar?
Luo EY, Ogilvie JE, Thomson JD. 2014. Stimulation of flower nectar Nature 350(6313): 58–59.
replenishment by removal: a survey of eleven animal-pollinated Raw GR. 1953. The effect on nectar secretion of removing nectar
plant species. J Pollinat Ecol 12(7): 52–62. from flowers. Bee World 34(2): 23–25.
Mallinger RE, Prasifka JR. 2017. Bee visitation rates to cultivated R Core Team. 2015. R: a language and environment for statistical
sunflowers increase with the amount and accessibility of nectar computing. Vienna, Austria: R Foundation for Statistical
sugars. J Appl Entomol 141(7): 561–573. Computing. Available from http://www.R-project.org/.
Masalia RR, Temme AA, de leon Torralba N, Burke JM. 2018. Sammataro D, Erickson EH, Garment MB. 1985. Ultrastructure of the
Multiple genomic regions influence root morphology and sunflower nectary. J Apic Res 24(3): 150–160.
Page 11 of 12S. Chabert et al.: OCL 2020, 27, 51
Southwick EE. 1984. Photosynthate allocation to floral nectar: a Villarreal AG, Freeman CE. 1990. Effects of temperature and water
neglected energy investment. Ecology 65(6): 1775–1779. stress on some floral nectar characteristics in Ipomopsis longiflora
Suni SS, Ainsworth B, Hopkins R. 2020. Local adaptation mediates (Polemoniaceae) under controlled conditions. Bot Gaz 151(1):
floral responses to water limitation in an annual wildflower. Am J 5–9.
Bot 107(2): 209–218. Waser NM, Price MV. 2016. Drought, pollen and nectar availability,
Szabo TI. 1982. Nectar secretion by 28 varieties and breeder’s lines of and pollination success. Ecology 97(6): 1400–1409.
two species of rapeseed (Brassica napus and Brassica campest- Wist TJ, Davis AR. 2006. Floral nectar production and nectary
ris). Am Bee J 122(9): 645–647. anatomy and ultrastructure of Echinacea purpurea (Asteraceae).
Takkis K, Tscheulin T, Petanidou T. 2018. Differential effects of Ann Bot 97(2): 177–193.
climate warming on the nectar secretion of early-and late- Wist TJ, Davis AR. 2008. Floral structure and dynamics of nectar
flowering Mediterranean plants. Front Plant Sci 9: 874. production in Echinacea pallida var. angustifolia (Asteraceae).
Takkis K, Tscheulin T, Tsalkatis P, Petanidou T. 2015. Climate change Int J Plant Sci 169(6): 708–722.
reduces nectar secretion in two common Mediterranean plants. Wyatt R, Broyles SB, Derda GS. 1992. Environmental influences on
AoB PLANTS 7: plv111. nectar production in milkweeds (Asclepias syriaca and A.
Tepedino VJ, Parker FD. 1982. Interspecific differences in the relative exaltata). Am J Bot 79(6): 636–642.
importance of pollen and nectar to bee species foraging on Yan W, Hunt LA. 1999. An equation for modelling the temperature
sunflowers. Environ Entomol 11(1): 246–250. response of plants using only the cardinal temperatures. Ann Bot
Tonin P. 2018. Les productions françaises d’oléagineux de spécialité: 84(5): 607–614.
des démarches en filière pour créer de la valeur dans nos Yin X, Kropff MJ, McLaren G, Visperas RM. 1995. A nonlinear
territoires. OCL 25(2): D203. model for crop development as a function of temperature. Agric
Vear F, Pham-Delegue M, Tourvieille de Labrouhe DT, et al. 1990. Forest Meteorol 77: 1–16.
Genetical studies of nectar and pollen production in sunflower. Zajácz E, Zaják Á, Szalai EM, Szalai T. 2006. Nectar production of
Agronomie 10: 219–231. some sunflower hybrids. J Apic Sci 50(2): 109–113.
Cite this article as: Chabert S, Sénéchal C, Fougeroux A, Pousse J, Richard F, Nozières E, Geist O, Guillemard V, Leylavergne S, Malard C,
Benoist A, Carré G, Caumes É, Cenier C, Treil A, Danflous S, Vaissière BE. 2020. Effect of environmental conditions and genotype on nectar
secretion in sunflower (Helianthus annuus L.). OCL 27: 51.
Page 12 of 12You can also read