THE LANDER VISION SYSTEM FOR MARS 2020 ENTRY DESCENT AND LANDING* - NASA
←
→
Page content transcription
If your browser does not render page correctly, please read the page content below
(Preprint) AAS XX-XXX

               THE LANDER VISION SYSTEM FOR MARS 2020
                     ENTRY DESCENT AND LANDING*

            Andrew Johnson, Seth Aaron, Johnny Chang, Yang Cheng,
              James Montgomery, Swati Mohan, Steven Schroeder,
                Brent Tweddle, Nikolas Trawny and Jason Zheng†

              In January 2016, the Mars 2020 project added Terrain Relative Navigation to the
              project baseline. This new capability helps the mission avoid large hazards in
              the landing ellipse, which enables the consideration of landing sites that more
              geologically diverse than before. This diversity should improve the quality of
              the samples collected by Mars 2020 for possible future return to earth. The
              Lander Vision System (LVS) is the sensor that provides the position fix that is
              used to determine where to land between hazards identified in orbital data prior
              to landing. This paper describes the LVS flight design for Mars 2020, a high-
              fidelity simulation used as a design tool and the expected LVS performance for
              Mars 2020.

INTRODUCTION
   The Mars 2020 rover will collect samples of Mars that could be returned to Earth in the future
as part of a potential Mars Sample Return campaign. Mars 2020 therefore needs to land in or near
regions of Mars that are likely to provide a diverse and compelling set of samples. Most of the
best regions for sample collection happen to contain landing hazards including scarps, canyons,
mesas, dune fields, rock fields and craters.
    Mars 2020 is using the Mars Science Laboratory (MSL) Entry, Descent and Landing (EDL)
system. This system generates an inertial position by propagating an IMU from the ground
navigation position fix prior to entry; the error on this position can be as large as 3.2km. The
Lander Vision System is being added to Mars 2020 to decrease this position error down to 40m
relative to a map of the landing site. Using this position, the Guidance, Navigation, and Control
(GNC) system selects a landing point that is reachable given the fuel onboard and that also avoids
hazards identified a-priori in the map. With this approach, sites that were previously considered
too hazardous for landing, but very desirable scientifically, are now viable candidates for Mars
2020 and future missions.
   The Lander Vision System (LVS) has been in development for many years starting with initial
proof of concept algorithms and culminating with a closed loop pin-point landing demo on a

* This research was carried out at the Jet Propulsion Laboratory, California Institute of Technology, under a contract
with the National Aeronautics and Space Administration. © 2017 California Institute of Technology. Government
sponsorship acknowledged..
† Jet Propulsion Laboratory, California Institute of Technology, 4800 Oak Grove Drive, Pasadena, CA 91109

                                                            1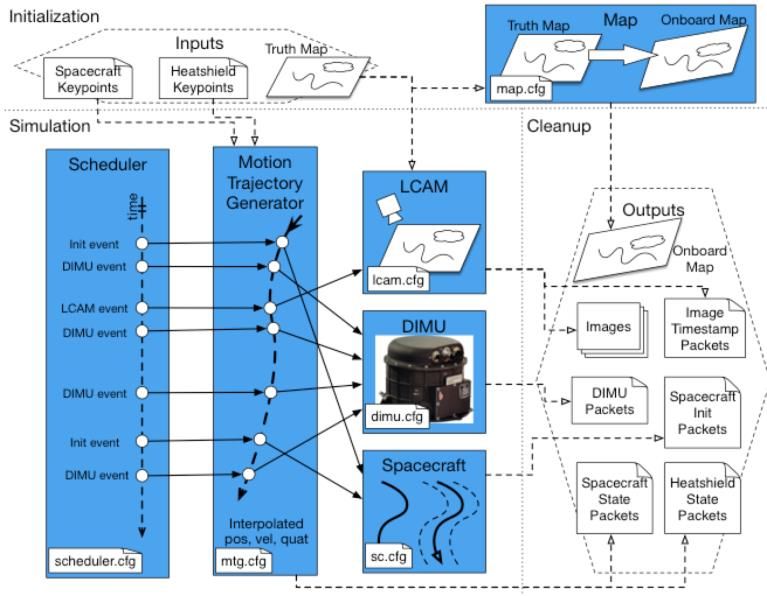
terrestrial vertical take-off and landing rocket.1,2,3,4,5 Mars 2020 picked up the technology in
January 2016 after it achieved Technology Readiness Level 6, but there is still significant effort
required to develop and validate the flight system. This paper will describe the new components
required for the LVS including a high-performance compute element, descent imager, and flight
software architecture that can acquire and process mega-pixel images at ~1Hz. It will also give
detailed position estimation performance results and sensitivity analyses for the LVS across its
operational envelope based on a recently developed high fidelity simulation.

LANDER VISION SYSTEM DESIGN
    The sole purpose of the LVS is to estimate position relative to map during Mars EDL. As
shown in Figure 1, the LVS needs to reduce an initial 3.2km position error down to 40m and do
this in 10 seconds. There is also a requirement to provide an answer with less accuracy (54m) at
6 seconds to deal with off nominal conditions where the LVS is started late in the EDL timeline
or to recover quickly from a reboot of the LVS during its operational time window.
   The Map Relative Localization (MRL) algorithms that run inside the LVS estimate position
by fusing landmark matches between descent images and a map with inertial measurement unit
(IMU) data. The process occurs in a coarse to fine fashion. First, the LVS processing is seeded
with an initial estimate of the position, attitude, velocity and altitude of the vehicle; this is used as
the starting point for inertial propagation of the LVS state. The position estimate is also used to
crop the on-board map of the landing site for subsequent image processing. The cropped map
accounts for the initial position error, image footprint, off nadir viewing and the drift during LVS
operation. Currently the map is around 12km on a side. Computational constraints limit
processing to maps that are at most 1024x1024 pixels.

                                  Figure 1. LVS Problem Statement
   Once the lander reaches 4200m above ground level (AGL) altitude, a coarse landmark
matching phase begins. Five large patches in each of three descent images are matched to a
coarse on-board map.2,4 These landmark matches are fused with the propagated IMU data
between images to compute a horizontal position correction for the LVS state. 4 Because the
coarse map is around 12 m/pixel this coarse horizontal position does not meet the 40m position
error requirement, so the coarse position correction is used to crop the onboard map to a map that

                                                     2
is 6km on a side with 6m/pixel and a fine matching phase is started. In fine matching, up to 150
small patches from each descent image are matched to the fine map. These matches are input as
measurements to an Extended Kalman Filter (EKF) that estimates LVS position, velocity, attitude
and IMU biases.1 The EKF constantly propagates the IMU data so that the best LVS state is
available for the next image exposure and landmark match update. LVS landmark matching
achieves the 40m position error after three fine images and continues processing until 2000m
AGL or the spacecraft tells LVS that back shell separation has occurred.
    The LVS must operate correctly for all possible EDL conditions. These include vertical
velocities between 65 and 115 m/s and horizontal velocities up to 70 m/s. Attitude rates can be as
high as 50˚/s and off nadir angles up to 45˚. The impact of terrain is bounded by the terrain
properties within a coarse landmark footprint of 1500m x 1500m. Within this footprint, the mean
slope of a best fit plane can be up to 15˚ and the standard deviation of the elevation residual from
this plane (terrain relief) can be as high as 150m. Much of the potential landing sites are rough
and have high contrast but there are bland regions that have appearances with entropy as low as
3.0 (roughly a contrast of 8 DN within a 256 DN image). Although the landing will occur in the
mid afternoon, variation in the landing date, time or day and latitude induce a variability in the
sun vector at the time of landing. Sun elevations can be between 25˚ and 55˚ above the horizon
and sun azimuths can be between 240˚ and 310˚ clockwise from north. These illumination
variations will introduce differences between the map image and the descent image that must be
dealt with robustly during landmark matching.
Mars 2020 LVS Architecture
   The LVS, as originally conceived, was a self-contained sensor with a low frequency de-
coupled interface, so that the LVS could be developed and tested independently from the rest of
the spacecraft.2. For Mars 2020, it also has the additional benefit of not significantly impacting
the MSL EDL architecture6. The Mars 2020 LVS architecture (Figure 2) maintains a simple
spacecraft interface while making some exceptions to reduce overall risk.

                                  Figure 2. LVS Block Diagram.
   Processing hundreds of landmarks in less than 10 seconds cannot be done on a standard flight
processor, so the LVS has a dedicated Vision Compute Element (VCE). The VCE interfaces to
both rover compute elements through 1553 interfaces. For testing and transfer of large data
products there are also high speed serial LVDS interfaces. During EDL, the rover compute
element sends the spacecraft state estimates at 8Hz to initialize the LVS. When the LVS detects

                                                   3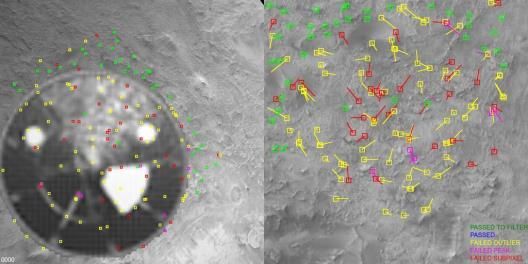
it has passed its initialization altitude it begins to send LVS computed state at 8Hz. Just before
back shell separation the last valid LVS estimate is used by the EDL/GNC flight software to
compute a landing target that avoids hazards and the back shell.
    For sensor data, the VCE interfaces to a new LVS camera (LCAM) over LVDS for images
and the existing Descent IMUs (DIMU) over RS-422 for inertial data. Early in the architecture
development it was decided that interfacing to the DIMUs was the lowest mass and highest
reliability approach to providing IMU data to the LVS. * The DIMU data is sent though a Y-
splitter and passed to the VCE and the rover compute elements. The VCE and LCAM are on the
rover while the DIMUs are on the descent stage. A consequence of using the DIMUs is the
relatively large separation between the LCAM and DIMUs, which can result in larger errors in
alignment knowledge. Later in this paper we show that the LVS position estimate is not very
sensitive to even the worst-case expected misalignments.
Vision Compute Element
    The Vision Compute Element (VCE) was designed to maximize heritage from the MSL
avionics suite while also providing the processing required to meet the LVS requirements. Mass
and volume, within reason, were secondary considerations. As shown in Figure 3, the VCE has
three cards that fit in a custom 6U chassis and interface over a standard cPCI backplane. The
28VDC provided to the VCE is converted to the necessary internal voltages by the Compute
Element Power Conditioning Unit 1 (CEPCU1). The CEPCU1 provides power to the other cards
in the box as well as the LCAM. A BAE RAD750 flight processor board provides a general
purpose processing capability that runs the VCE flight software described below. Both the
CEPCU1 and the RAD750 are build-to-print designs from MSL.

                               Figure 3. VCE Block Diagram and Chassis
   The Computer Vision Accelerator Card (CVAC) is a new card developed for LVS on Mars
2020. As shown in Figure 3, the CVAC provides all of the data interfaces for the VCE including:
DIMU, LCAM, 1553 and ITC/ICC. It also provides serial UART and Ethernet ports for use
during testing and an LCAM test interface for real-time testing of the LVS on the flight vehicle.
The CVAC has two FPGAs and significant memory for rad-hard non-volatile storage (32 MB
NOR), intermediate processing (1 GB DDR2 SDRAM) and data products (16 GB NAND).

* An option with a high reliability IMU dedicated to the LVS and on the rover was considered but then thrown out
because it was too massive and voluminous to accommodate on Mars 2020. Lower mass IMUs were also considered
but they did not have the reliability required for EDL.

                                                         4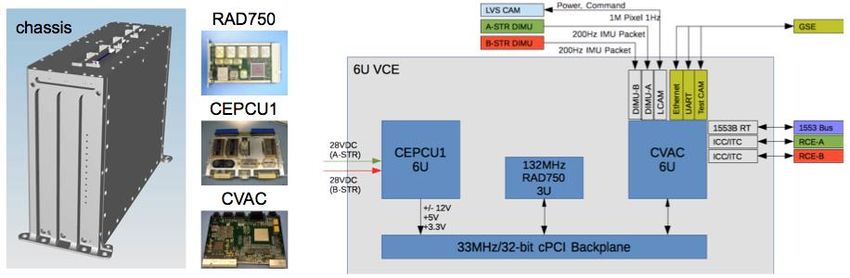
The Vision Processor FPGA (VP) on the CVAC is a Virtex5QV FPGA containing image
processing modules required to match landmarks at high rate to achieve the LVS processing time
requirements.2 The VP controls access to the DDR2 and NAND memory and it contains the logic
to interface to the LVS sensors: the LCAM through an asynchronous serial command interface
and channel-link for image data, and the DIMU data through RS-422. The VP is fully re-
programmable, and it is loaded by the second “Housekeeping” FPGA (HK) on the CVAC. The
HK is a burn once RTAX 2000 which handles the time synchronization with the spacecraft,
power management, VP configuration, NOR memory management, ADC and the 1553 and
ICC/ITC spacecraft interfaces.
   A breadboard of the VCE using a commercial chassis and power has been in use for the last
year. The first VCE EM is currently being fabricated and will be ready for testing to support an
M2020 Critical Design Review in spring 2017.
LVS Camera
   The LVS Camera (LCAM) is a new development because it has some challenging driving
requirements that cannot all be met by cameras flown to date on JPL space missions. The LCAM
must take crisp images under high attitude rates and velocities, so it must have a global shutter
with a low exposure time. It needs to provide images quickly to the VCE with low latency so that
they can be processed in time to meet the LVS processing requirements. To ensure enough
landmarks are matched per image, it must have a field of view large enough to image a significant
area of the map even when the camera is pointed up to 45˚ off-nadir. To provide enough high
quality information across each landmark for accurate and robust landmark matching the detector
must have a significant number of pixels and the image SNR must be high. The actual
specification values for the LCAM are shown in Table 1.
                            Table 1.   LCAM Driving Requirements
 Parameter                                      Value
 Detector Type                                  Global shutter and grayscale
 Number of Pixels                               1024 x 1024 pixels
 Field of View                                  90˚ x 90˚
 SNR                                            80 at half full well depth
 Exposure Time                                  ~1ms
 Latency                                        ~100ms
    Accommodation of the LCAM into the M2020 flight system presents some challenges as well.
Given the limited space inside the rover, the LCAM must be a single box located on the outside
of the rover and it must weigh less than 1kg. Fortunately, since the LCAM is used only during
EDL, it does not have to survive diurnal cycles on the Mars surface, which provides some relief
to thermal qualification requirements. Figure 4 shows the size and location of the LCAM on the
rover. Currently the LCAM is in the detailed design phase with engineering models to be
delivered in late 2017.

                                                 5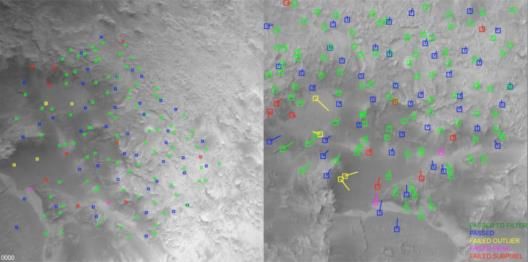
Figure 4. LCAM location on the front left corner of the rover body.
Vision Compute Element Flight Software for EDL
The VCE Flight Software for EDL (VCEFSWE) runs on the RAD750 in the VCE under the
VxWorks operating system. VCEFSWE is a mixture of software modules inherited from the
MSL and Soil Moisture Active Passive (SMAP) missions at JPL and new software developed
specifically to implement the Map Relative Localization function. VCEFSWE interfaces to the
DIMU, LCAM and RCE and implements the MRL processing and mode transitions. Specific to
MRL it coordinates the image processing flow between the RAD750 and VP FPGA, provides
image processing results and IMU data to the state estimation functions, stores data products and
EVRs for download through the RCE after landing, and uploads the LVS map. It must also
implement standard software functions like receiving commands and transmitting telemetry
between the RCE, fault detection and recovery, and loading and storing of new VCEFSWE and
VP executables.
Figure 5 shows a VCEFSWE block diagram with the details specific to MRL processing. The
pink blocks are libraries that perform the MRL algorithms including sequencing of data (seqlib),
image processing (iplib) and state estimation (filterlib). LVS Main is the controlling executive
thread but it also has to interact through messages with a manager of the IP functions on the VP
(IP MGR), a timing thread (tim) and a thread the that controls the estimation processes that may
take longer than a real-time software interval (filterbtp). LVS main uses device driver libraries to
interface to the LCAM, DIMU and RCE.
Unlike the LVS prototype, the VCEFSWE architecture generates processing results on a
deterministic time-line. Events like image exposures and landmark match updates occur at
specific times relative to the start of LVS initialization. This determinism standardizes the
behavior to the LVS as it interacts with the RCE and should simplify integration and testing.
Figure 5. VCEFSWE Block Diagram for MRL Processing.
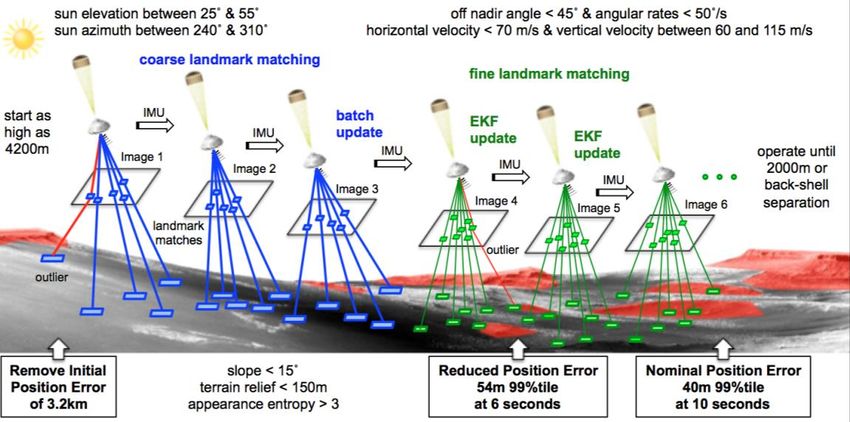
LVS SIMULATION
Past work has tested the LVS extensively with real data. 3,5 This field testing proved that LVS
works in its relevant environment, but the data collected was not extensive enough to prove that
the LVS works over its entire operational envelope. The typical work around for this problem is
to develop a high fidelity simulation, certify the simulation with field test data and then use the
6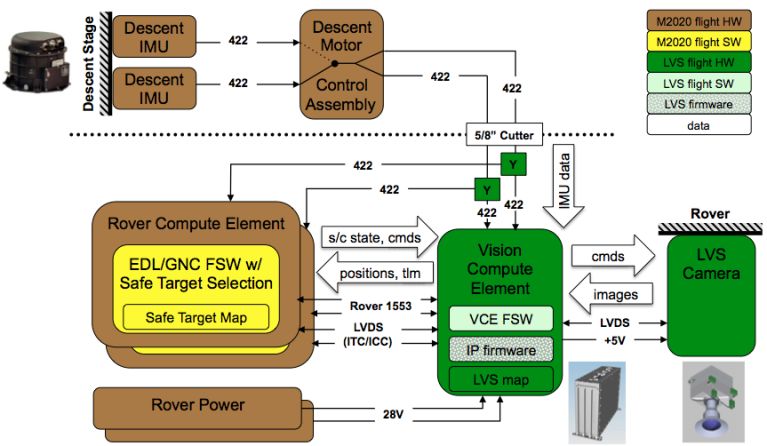
simulation to span the operational envelope. The simulation can also be used in development to
perform sensitivities studies to support design decisions. Over the past year we have developed a
high fidelity LVS Simulation (LVSS) where sensor, trajectory and map models feed data to MRL
code for position estimation over time.
   As shown in Figure 6, the inputs to LVSS are trajectories for the spacecraft and heat shield in
the form of discrete timed poses and a truth map which is a digital elevation map with a co-
registered appearance map. The outputs from LVSS are timed LCAM images, timed DIMU
inertial data, a sequence of timed spacecraft initialization packets and the on-board LVS map.
These inputs are stored as files that can then be fed to the MRL code in sequence using the LVS
replayer function; replayer works with the LVS prototype hardware3, a software only version of
the code that runs on a linux station and an initial prototype of VCEFSWE in VxWorks with
MRL code that runs on the VCE bread board. The LVSS models and independent verification are
described below.

                            Figure 6. LVS Simulation block diagram.
Scheduler, Motion Trajectory Generator, DIMU and Spacecraft Models
   As mentioned above, LVS runs on a deterministic timeline. The purpose of the scheduler
model is to define the time of each event (e.g., image acquisition, DIMU data packet) based on a
parametric table of event times and the rate of the DIMU and spacecraft interface. Because the
scheduler is straightforward it was possible to verify it by checking event times by hand.
   The motion trajectory generator takes as input a set of discrete timed positions and attitudes.
These keypoints can be at asynchronous times and/or at a high rate; the outputs are the position
velocity and attitude of the spacecraft at the events identified by the scheduler model. The
keypoint positions are interpolated with a cubic spline to generate position and velocities while
the keypoint quaternions are interpolated using the SQUAD algorithm.7 The trajectory generator
was verified by generating a 200Hz event schedule and then comparing that result back to the
original truth trajectory that was generated at 1000Hz.

                                                  7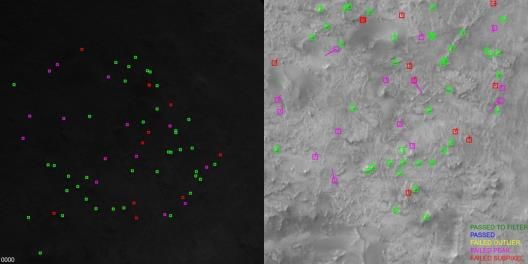
The high fidelity DIMU model generates inertial accelerations and angular rates given the
trajectory provided in a Mars-centered Mars-fixed frame. It models the performance of the
Honeywell MIMU and is the same code that was developed and certified for MSL. 8
   The purpose of the spacecraft model is to simulate the spacecraft initialization packet that
kicks off the LVS processing. This packet contains position velocity and attitude measurements.
The model simply adds a random bias and Gaussian noise in all axes to the truth trajectory at
spacecraft init events. The attitude error is less than 0.5˚ per axis because it is based on DIMU
propagation from an accurate attitude estimate prior to entry. Velocity is based on the Doppler
radar on board which is typically better than 2 m/s per axis at the LVS operational altitudes.
Vertical position is provided by the Doppler radar range measurements and is in error by less than
100m. Horizontal position, as discussed above can be in error by as much as 3.2km in both axes.
The spacecraft model was verified by using a chi-square test on the Gaussian errors generated.
LCAM Model
    The LCAM model generates synthetic images by rendering the truth map. Given a camera
pose and projection function, multiple rays are cast out from each pixel and intersected with the
truth map. The brightness for each ray is a brightness of the appearance map at the intersection
multiplied by the ratio of radiance to irradiance light, which is a function of the phase, emission
and phase angles of the illumination and surface.9 This reflectance function includes the
opposition effect and surface shading. All the rays for each pixel are averaged together to obtain
the single brightness of the pixel; this finite element approach minimizes aliasing and provides a
simple method to balance image rendering time against image fidelity. The camera projection
function models pin-hole perspective along with radial distortion. 10 The LCAM is a 90˚ field of
view across 1024 pixels and has 18% distortion at the edge of the image. Figure 7 shows a
rendered image and other non-ideal camera effects.

                                                  8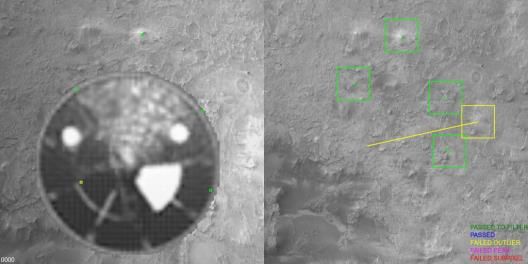
Figure 7. LCAM Model Effects.
   The rendering was verified by synthesizing a high-resolution image of a checker-board on a
sinusoidal terrain and then independently projecting the corners of the checker board into this
image. The projected points were then manually inspected and shown to line up with the grid in
the image thereby verifying the rendering has at least sub-pixel accuracy.
    Multiple effects are added to the rendered image to bring it closer to a real camera image. The
first effect is the heat shield descending away from the spacecraft. Keypoints for the heat shield
trajectory are input into the motion trajectory generator, which creates a heat shield pose for every
image exposure event generated by the scheduler model. An image of the heat shield taken by
MARDI on MSL was used to obtain the appearance of the heat shield. A scaled and shifted
version of this image is added to the LCAM image based on the bearing and distance between the
lander and the heat shield. Manual spot checks of the heat shield size and position in rendered
images were used to verify that the heat shield model was working properly.
    After adding the heat shield, multiple camera specific effects are added in the order in which
they physically effect the camera image. First the radiometric fall off due to vignetting in the
optics scales the pixels to darker values toward the edge of the image. In LVSS, radiometric fall
off can be modeled with cos4 of the field angle or with quadratic and linear terms. The LCAM
optics design is tailored to reduce radiometric fall off and it is no worse than 80% brightness at
the edge of the images. Next, shot noise, drawn from a Poisson distribution, is added to each
pixel. For the LCAM, the shot noise at full well is 2.5 DN* one sigma. The LCAM uses a global
shutter CMOS detector which are known to have slight variations in the signal chain that converts
each column of pixels to DN. This results in a fixed pattern of brightness variations across the
image. This effect is implemented by applying a Gaussian random scale factor to each column;
LCAM is expected to have variations between columns of less than 0.5%. The LCAM model also
adds hot or dark pixels to the image by selecting random pixels and setting them to either to 0 or
255. The LCAM is expected to have very few bad pixels but 10 hot pixels are typically added in
all simulations. These image-based effects were verified independently by rendering fixed
brightness scenes and comparing the image pixels to the true scene brightness. For shot and fixed
pattern noise the noise standard deviations were estimated from the image brightness and
compared to the true value with a chi-square test.
   In addition to the image effects, the LCAM model contains terms for the misalignment
between the DIMU and the LCAM. This shows up as a change in the true pose of the camera and
the subsequent rendered images. It also allows for errors in the estimate of the focal length.
Instead of changing the focal length of the true images, this effect was added by changing the
camera model parameters used by MRL. LCAM to DIMU misalignment was checked by
comparing pixel shifts between rendered images with and without the errors while the focal
length error was checked with manual inspection of the camera model parameters.
Map Model
   The LVS map is an imperfect representation of the actual Mars surface. The map elevations
are generated through stereo reconstruction between orbital images; the appearance map is
typically one of the images used for stereo reconstruction. Errors in the orbit and attitude of the
spacecraft, camera calibration and stereo correlation errors will all result in errors in the map. The
map model attempts to simulate these errors with respect to inertial space through a set of global

*   Digital Number or DN is the term for pixel values that have not been converted into physical units.

                                                               9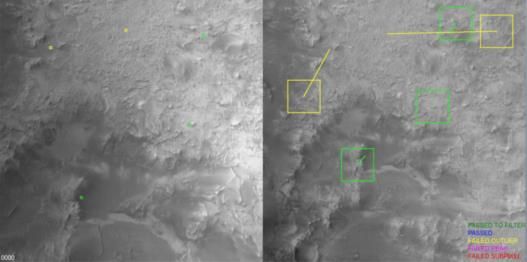
and local transformation applied to the truth map. The truth map can be translated and rotated in
3D space to model biases in the spacecraft attitude and position during image collection. The
truth map can also undergo local distortions due to spacecraft jitter not captured in the spacecraft
attitude profile as well as stereo correlation errors. These are modeled as a random field of
horizontal distortions that are correlated locally and pixel to pixel Gaussian elevation noise.
   The LVS map will be constructed from Mars Reconnaissance Orbiter Context camera (CTX)
images, which are nominally 6m/pixel and have a 30km swath. It is likely that multiple stereo
pairs will be needed to provide seamless coverage of the landing ellipse and LCAM footprint. As
shown in Figure 8, the map position error will be less than 150m horizontally and 20m vertically
while the orientation error will be less than 1 mrad. The local distortions will be less than 6m
over distances less than 120m and 12m for distances greater than that. Pixel to pixel elevation
error will be less than 2m (1 sigma). It should be noted that the hazards in the landing ellipse are
co-registered with the LVS map, so the horizontal map error essentially cancels out in the larger
system context.
    The global position and attitude shift were verified by comparison of LCAM images rendered
from the truth map to the LVS map. The local distortion as a function of point separation
(baseline) was verified by randomly sampling two points and computing the relative
displacement. This was done for many pairs of points at each baseline and an average distortion
was computed. This was then compared to the desired distortion at that baseline. Random
elevation errors were verified by computing the standard deviation of the difference between the
truth and LVS map elevations at each pixel.

                                           Figure 8. Map Model Errors

LVS ANALYSIS WITH SIMULATION
   After verifying the individual models in LVSS, it is ready to produce data for analysis. First,
studies were conducted to identify the parameters that are major contributors to the LVS error
budget. Next, a Monte Carlo simulation for North East Syrtis landing site was executed and
compared to the error budget. Finally, sensitivity studies were conducted to assess the boundaries
of LVS performance.
Error Budget Analysis
    Initially LVSS was used to determine the effect of each error source independently. The first
study determined the effect, if any, of assumptions and simplifications in the MRL algorithms. * A
flat truth map with random and high contrast surface reflectance was generated. The spacecraft
was made to descend straight down with the camera pointed nadir at 25 different locations across

*   For example, the MRL algorithms resample the descent image, which prevents perfect correlation with the map.

                                                            10
the map. All sensor and map errors sources were turned off. As show on Table 2 the resulting
error was zero mean and less than 0.6m. This error is one tenth of a map pixel, so the algorithm
itself does not introduce significant errors.
The effect of the DIMU noise and quantization was investigated next. The appearance map
was replaced with an image of the North East Syrtis (NES) landing site, the same 25 straight
down trajectories were used but with the DIMU errors turned on. Even after adding these errors
and changing the appearance map the position error was still very small.
Next, LCAM specific errors were investigated. This included all the detector errors (e.g, shot
noise, hot pixels, etc.), optical effects (radial distortion and radiometric fall off) and surface
reflectance (zero phase opposition effect). The LCAM specification was used to set the LCAM
parameters except for radial distortion. At the time of this study, the initial LCAM optical design
was not complete, so the LVS field test3 camera was used to define a radial distortion of 7.5%.
Since then the LCAM design has settled on 18% distortion; to mitigate this large distortion a look
up table based radial distortion correction module is being implemented. For the study, the truth
map was once again NES but his time it included terrain relief. In addition, an attitude profile
representative of parachute dynamics was added to the descent trajectories. All told the LCAM
errors introduce around 1.1m of error to the position estimate.
The LCAM projection function is determined by taking multiple images of a grid of dots on a
flat target board. The estimate of the LCAM focal length from this process can be as large as 1%.
To simulate this error, +/- 1% errors were added to the MRL parameters that define the LCAM
focal length. MRL is able to match landmarks with this level of error, but the focal length error
shifts the point where all the landmark bearing vectors intersect; When the LCAM looks off nadir
this results in horizontal and vertical position errors. As shown in Table 2, these errors can be as
large as 17m horizontally. In the future, more accurate calibration methods will be investigated to
reduce this error.
The LCAM is on the rover while the DIMU is on the descent stage. The rover and descent
stage are rigidly connected, but with a cup/cone interface that can slip. Shock events, parachute
dynamics and thermal drift can introduce relatively large errors (0.75˚/axis) into the knowledge of
the alignment of the DIMU and LCAM. The errors were simulated in LVSS, but in contrast to
the focal length error, the LVS state estimator pushes these errors into the LVS attitude estimate
so the effect on the position error is no more than 3.0m
The final contributor to the error budget comes from the LVS map. A global shift in the LVS
map will just shift the LVS position by the same amount. As discussed previously, this error
cancels out at the system level, so it was not included in this study. However, errors in the
attitude of the map, horizontal distortions in the map appearance and local elevation errors were
simulated by converting the NES truth map based on the LVS map requirements. The resulting
position errors are no more than 3.4m.
Table 2. LVS Error Budget
Error Budget Source (29-Sep-2016) Current Best Estimate Allocation
(99%tile) (99%tile)
Algorithm (resampling, warping, correlation) 0.6m 1m
DIMU (accel and gyro noise) 0.4m 1m
LCAM (image noises, radial distortion) 1.1m 5m
LCAM Focal Length Error 16.9m 20m
LCAM to DIMU Misalignment 3.0m 15m
Map (distortions, rotation) 3.4m 12m
11Error Budget Total (RSS) 17.3m 28.2m
Monte Carlo Result (15-Oct-2016) 14.8m
LVS Field Test Result (19-Oct-2016) 16.0m
As shown in Table 2, the RSS of these LVS error budget contributions is 17.3m compared to a
28.2m allocation. This agrees well with the LVS Field Test results also shown in the table. As
LVSS increases in fidelity more error sources will come into play. Given that the allocation and
CBE are much less than the 40m requirement, there is plenty of room for the error to grow.
Monte Carlo Analysis
The error budget approach applies each error source independently at its maximum value with
the other errors turned off. This works well to determine the relative contribution of different
error terms assuming they are independent. Any coupling between terms will come out in Monte
Carlo analysis where all the error sources are on at once and drawn from their expected
distributions.
The LVSS Monte Carlo analysis used 256 landing trajectories provided by the POST
simulation for a Mars 2020 EDL on the Northeast Syrtis landing site.11 As shown in Figure 9, the
trajectories varied in position across the landing ellipse, vertical velocity and attitude profiles.
For each trajectory, LVS was kicked off at 4200m altitude and a sequence of LCAM images,
DIMU data and spacecraft init packets were generated. The NES map was used to render the
images while a single distorted LVS map was generated for use by all runs. The LCAM had all its
errors with different random seeds for each run. The LCAM focal length error varied according
to a Gaussian distribution between +/- 1% while the LCAM to DIMU misalignment varied
according to a Gaussian between +/- 0.75˚ in each axis. The spacecraft init packet had a Gaussian
distribution on all parameters. Horizontal errors were less than +/- 3.2km, vertical errors were
between +/- 100m, velocity errors were less than +/- 2 m/s per axis and attitude errors were less
0.5˚ per axis. All of these errors were set based on the current LVS requirements.
Figure 9. LVS Monte Carlo Simulation Trajectories
12Figure 10. LVS Monte Carlo Simulation Results
Figure 10 shows the scatter plots of the horizontal and vertical errors from the Monte Carlo.
The horizontal position error at the end of 6 images is less than 14.8m and the vertical errors are
less than 45m. Since the Monte Carlo results are less than the RSS of the error budget the
individual error sources do not seem to amplify each other.
Sensitivity Studies
The Error budget and Monte Carlo analysis showed that LVS meets its requirements within its
expected operational envelope, but how does LVS perform outside of this envelope? The purpose
of sensitivity studies is to determine how performance degrades as inputs are varied and what
values will cause LVS to completely fail to estimate position. Described below are some
sensitivity studies that were focused on potential areas of concern. In all these studies the LCAM
and Map errors were turned on.
Spacecraft Initialization Errors. The first study looked into the magnitude of spacecraft init
errors. Horizontal position error was increased from zero to 5km with no effect on LVS
performance. Given that the coarse map is only +/-6km, it is not expected that LVS will work
much above 5km but it does not need to since this error is expected to be no more than 3.2km.
The vertical position error was varied between +/- 500m in 50m increments and LVS performed
well except at +400m. 350m is still well above the 100m requirement. The errors in the off nadir
and about nadir attitude angles were increased from zero to 5˚ in steps of 0.5˚. LVS was able to
take out all of these attitude errors showing that it is not very sensitive to the initial attitude input.
Table 3 summarizes these results.
Table 3. Initial Input State Errors.
Horizontal Vertical Off Nadir About Nadir
Position Error Position Error Angle Error Angle Error
Performance 5km 350m 5˚ 5˚
Upper Limit
Operational < 3.2km < 100m < 0.5˚the maps serves as the truth map from which LCAM images are rendered while the other is the
LVS map. In addition to illumination differences this method will have different errors in the two
maps, so it also assesses the effect of map distortions on matching.
Two NES maps were made and trajectories were generated that spanned the two maps. LVS
worked for all positions across the map, and Figure 11 shows the matching results for the worst
performing of all the cases. This is in region of the map that is somewhat bland and could
challenge LVS. In each pair of images, the left image is the descent image and the right image is
the map image. The colored boxes are correspondences between the two images. The left pair is
the first coarse match image which has two incorrect matches out of 5. The right pair is the first
fine match, which shows more than 100 landmarks matched indicating accurate performance.
coarse match fine match
Figure 11. Performance with different sources for truth map and LVS map.
Exposure Time. The LCAM does not have automatic exposure control, so great care must be
taken to set the exposure correctly. This process combines detailed testing of the LCAM optical
transmission combined with analysis of the Mars surface reflectance, atmospheric scattering and
solar illumination. Past experience shows that this modeling can be quite accurate if done
correctly9, but it is complicated and mistakes can happen. This process will have independent
verification, but it is also important to know how sensitive the LVS is to an incorrect exposure.
For this study, a sequence of truth maps were generated with brightness values scaled from 1x
to 1/64x of nominal. LCAM images were rendered from each map as a simple way to model
exposure since it is not yet implemented in the LCAM model. LVS matching worked from 1x
with a mean map brightness of 128 DN down to 1/8x with a mean map brightness of 16 DN. In
Figure 12 a match result with this 1/8x condition shows decent coarse matching and just enough
fine matches to obtain a position estimate. These results indicate that the exposure time could be
off by a factor of 4 either too long or too short and LVS would still perform well. This relative
insensitivity to exposure time is a solid mitigation against potential modeling errors when setting
exposure time.
coarse match fine match
Figure 12. Exposure Time Sensitivity. Matching works down to mean brightness of 16 DN.
14Scene Contrast. Dust in the atmosphere scatters light and will reduce the contrast of the terrain
imaged by LCAM. The amount of dust in the Martian atmosphere varies seasonally and
fortunately Mars 2020 will land in a Martian season with typically low atmospheric dust.
However, since there is a chance the predictions are wrong or a local dust storm appears it is
important to understand what contrast is required for LVS to operate.
For this study, truth maps were made with decreasing brightness variability (i.e., contrast).
The NES map has an appearance entropy of 5 which corresponds to 32 DN of contrast. Maps
were made with entropy decreasing by 1 down to an entropy of 1 which corresponds to 2 DN of
contrast. As shown in Figure 13, LVS worked down to an entropy of 2 which is 4 DN of
contrast. The Mars 2020 landing sites have entropies at 5 or higher, so this is a factor of 8 margin
against reduced contrast. Future work will link contrast reduction to optical opacity so that the
LVS performance bound can be related to measureable atmospheric properties.
coarse match fine match
Figure 13. Scene Contrast Sensitivity. Matching works down to a scene entropy of 2.
Heat shield. The LVS will be initialized after the heat shield has been ejected. There is a
chance that the heat shield will be visible in the LCAM images, although, since it falls
ballistically while the lander is on a parachute, it should be hundreds of meters away from the
lander when the LCAM images are taken. Nevertheless we need to understand the sensitivity of
LVS to the heat shield being in the image.
Trajectories that kept the heat shield a fixed distance and position from the lander were
generated. As shown in Figure 14, even at 3m distance the LVS can reject the heat shield
components of the image and only match the descent image to the background map. At 2m
distance the heat shield covers the entire image and matching cannot occur. So, even in the highly
unexpected case that the heat shield stays close to the lander, LVS will reject it.
coarse match fine match
Figure 14. Heat shield Sensitivity. Heat shield is rejected at 3m distance and greater.
15CONCLUSION
The LVS flight design maintains the architecture of the prototype proven in the technology
development program while maximizing the heritage of its components to minimize risk. Like
the prototype electronics, the compute element has a flight processor and a reprogrammable
Virtex 5 FPGA. Like the prototype the LCAM has a 90˚ FOV across a 1024x1024 pixel image
with short exposure times and fast readout times. The LVS does not have its own dedicated IMU,
but it does receive high accuracy IMU data from the high reliability DIMU. The VCEFSW
encapsulates the MRL code that was developed for the prototype while providing the new
interfaces to the VCE and spacecraft.
The recently developed high fidelity LVS simulation has already been put to good use to show
that LVS meets its position estimation requirements when all errors are present. The error
budget, Monte Carlo simulation and past field test results all agree which indicates that the LVS
error sources are well understood. Now that the Monte Carlo simulation results span the operation
envelope of Mars 2020 and performance meets requirements, the Map Relative Localization
algorithms are solidly at Technology Readiness Level 6.
ACKNOWLEDGMENTS
This research was carried out at the Jet Propulsion Laboratory, California Institute of
Technology, under a contract with the National Aeronautics and Space Administration. The Mars
and Outer Planets Programs in the NASA Science Mission Directorate and the Game Changing
Technology Development Program in the NASA Space Technology Mission Directorate funded
this work.
REFERENCES
1A. Mourikis, N. Trawny, , S. Roumeliotis, A. Johnson, A. Ansar and L. Matthies, “Vision Aided Inertial
Navigationfor Spacecraft Entry Descent and Landing, IEEE Transactions on Robotics and Automation 25(2), 264-280,
April 2009.
2A. Johnson, C. Bergh, Y. Cheng, et al., “Design and Ground Test Results for the Lander Vision System,” 36th Annual
AAS Guidance and Control Conference, AAS 13-042, 2013.
3A. Johnson, Y. Cheng , J. Montgomery , Nikolas Trawny , B. Tweddle, and J. Zheng, “Real-Time Terrain Relative
Navigation Test Results from a Relevant Environment for Mars Landing”, Proc. AIAA SciTech Conference, January
2015.
4A. Johnson, S. Aaron, Y. Cheng, J. Montgomery, N. Trawny, B. Tweddle, G. Vaughan, J. Zheng, “Design and
Analysis of Map Relative Localization for Access to Hazardous Landing Sites on Mars,” Proc. AIAA SciTech
Conference, January 2016.
5N. Trawny et al., “Flight testing of terrain-relative navigation and large-divert guidance on a VTVL rocket ,” Proc.
AIAA Space Conference, 2015
6A. San Martin, S. Lee and E. Wong , The Development of the MSL Guidance, Navigation, and Control System for
Entry, Descent, and Landing,” Advances in the Astronautical Sciences Volume 148, AAS 13-238, 2013.
7 K. Shoemake. “Animating rotation with quaternion calculus”, ACM SIGGRAPH Course Notes, 10:101-121, 1987.
8P. D. Burkhart, J. Casoliva, and B. Balaram, “Mars Science Laboratory Entry Descent and Landing Simulation using
DSENDS,” Proc. AAS/AIAA Space Flight Mechanics Meeting, AAS 13-421, 2013.
9 R. Willson, A. Johnson and J. Goguen, “MOC2DIMES: A camera simulator for the Mars Exploration Rover Descent
Image Motion Estimation System,” Proc. 8th Int’l Symp. Artificial Intelligence, Robotics and Automation in Space
(iSAIRAS’05), September 2005.
1610D. Gennery, “Generalized Camera Calibration Including Fish-Eye Lenses,” Int. J. Comput. Vision 68(3), 239-66,
2006.
11D. Way, J. Davis, and J. Shidner, “Assessment of the Mars Science Laboratory Entry Descent and Landing
Simulation,” Proc. AAS/AIAA Space Flight Mechanics Meeting, AAS 13-420, 2013.
17You can also read