Effects of Cities on Local Climates
←
→
Page content transcription
If your browser does not render page correctly, please read the page content below

Proceedings of Workshop of IGES/APN Mega-City Project
                                                                                   23-25 January 2002 (Rihga Royal Hotel Kokura, Kitakyushu Japan)
                                                                                             © 2002 Institute for Global Environmental Strategies All rights reserved.

                              Effects of Cities on Local Climates

Matthias ROTH *a

1. Introduction
    For the first time, about half of the world’s population is living in urban areas (Population Reference Bureau, 2001).
95% of the growth over the next three decades will occur in less developed countries, 60% of which will be in Asia
(especially China and India). By 2015, 16 of the world’s 24 megacities (cities with more than 10 million people) will be
located in Asia. The urban transition now underway in Asia involves a volume of population much larger than any other
region in the world and is taking place on a scale unprecedented in human history.
    Many of these people will be added to cities whose infrastructure is often already at or beyond its limit which will
lead to an inevitable decline in the quality of life and the urban environment. Several of these problems are directly or
indirectly related to the climate of these cities. In mid-latitude cities, heat stress in summer can lead to increased
mortality and loss of productivity. Increase in pollutant sources both stationary (e.g. industries) and non-stationary (e.g.
vehicles) result in worsening atmospheric conditions. The situation is more dramatic in the less developed world and the
tropics. Industrial areas are often located with little regard to ventilation and operate with little or no emission control.
Many cities in the tropics experience weak winds and limited circulation of air which helps the accumulation of
pollutants. High temperatures increase the production of secondary, photochemical pollutants and the high humidity
contributes to a hazy atmosphere. In addition cities are a major source of greenhouse gases which are thought to be
responsible for the observed global warming trend.
    There are compelling practical issues relating to human health and well-being for which it is important to
comprehend the physical basis of urban climates and thence to ensure a pleasant and healthy environment for city
dwellers and to reduce the harmful effects of urbanization on large-scale climates. Some of the observed urban climate
changes, e.g. temperature increase, have already occurred at a magnitude similar to that projected on a global scale into
the future. Knowledge of urban weather and climate modification holds lessons for global climate change issues. The
purpose of this paper is to summarize current knowledge of urban influence on the local climate and discuss practical
implications of such understanding. Section 2 briefly introduces the background needed to understand why the presence
of a city changes the local atmospheric environment. Examples of modifications are given in Section 3. The relationship

* Corresponding author. Tel: +65-6874-6103, Fax: +65-6777-3091, E-mail: geomr@nus.edu.sg;
a
  Associate Professor, Department of Geography, National University of Singapore, 1 Arts Link, Singapore 117570

                                                                         1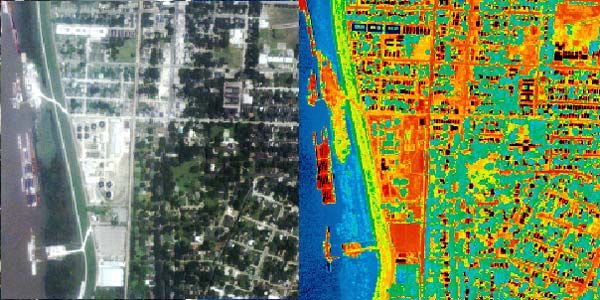
between urban climate and global environmental change is discussed in Section 4, and Section 5 concludes with
examples of efforts to mitigate some of the adverse effects.

2. Nature of the urban atmosphere
  Urbanization, which includes residential, commercial and industrial developments initiates one of the most dramatic
human-induced change of a natural ecosystem: a natural landscape, often containing transpiring vegetation and a
pervious surface, is converted to a built, largely impervious landscape made-up of rigid, sharp-edged roughness
elements. The introduction of new surface materials (such as concrete, asphalt, tiles, etc.), the construction of buildings
and the emission of heat, moisture and pollutants dramatically change the following properties of the surface and the
atmosphere above:
       •    Radiative         Changes occur due to the introduction of new surface materials which have a
           larger range of albedo and emissivity values compared with vegetation; the 3-D arrangement of
           buildings and canyons interacts with radiation in more complex ways than a flat surface.
       •    Thermal          The thermal mass of buildings is larger compared to natural surfaces thereby
           providing a massive reservoir for heat storage (daytime) and release (nighttime).
       •   Moisture           Urbanization is associated with effective “sealing” of the surface, i.e. reduction of
           moisture available for evapotranspiration.
       •    Roughness          Obstacles such as buildings, bridges etc. act as bluff bodies in the aerodynamic
           sense because of their impermeability, inflexibility and sharp edges. When exposed to the airflow
           they create strong positive and negative pressure differences over their surface, leading to flow
           separation and vortex shedding. This affects the transport of energy, mass and momentum to and
           away from the city surface. Turbulence is enhanced compared to the more homogeneous atmosphere
           over the rural surroundings.
       •    Emissions           Emission of aerosols and greenhouse gases due to combustion of fuels, industry,
           cars, etc. affects the radiative transfer and act as condensation nuclei; waste heat and water vapour
           from combustion is added to the urban atmosphere.
   A new set of ambient conditions is created which differs from that of the surrounding “undisturbed” rural areas.
These changes are reflected in an altered energy balance – the basic and powerful framework used in the analysis of
climate processes. It is therefore not surprising that, as urbanization proceeds, the associated weather and climate are
                                                                                           often modified substantially.
                                                                                           Every facet of every building,
                                                                                           tree, etc. produces its own
                                                                                           microclimate which all co-
                                                                                           exist    side-by-side.    Spatial
                                                                                           discontinuity occurs at all
                                                                                           scales and advection is the
                                                                                           norm.     New    microclimates
                                                                                           evolve     which     in     their
   Figure 1. Idealized vertical structure of the urban atmosphere over an urban            aggregation result in unique
     region at the scale of the whole city (from Oke, 1997a). PBL – planetary
        boundary layer; UBL – urban boundary layer; BL – boundary layer                    regional climates for each city.

                                                            2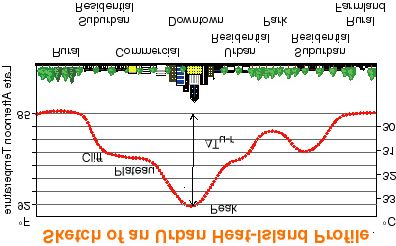
These modifications are largely confined to the so-called urban boundary layer (UBL), although the urban “plume”
originating from the city can be advected tens of kilometers downwind (Fig. 1). Typically, cities affect climates at the
local (
with the urban plume.
 Surface temperature UHI                     Different heat islands according to the definition of “surface” used
                                             (e.g. bird’s-eye view = 2-D vs. true 3-D surface vs. ground = road)
 Sub-surface UHI                             Found in the ground beneath the surface

Examples of air temperature UHI:
   Most research has been restricted to cities in temperate climates. Observations show that the location of the
nocturnal maximum UHI intensity roughly coincides with heavily built-up areas found in the center of cities. This is
illustrated with two examples from Asian cities which also show many of the commonly observed features. In the case
of Tokyo (temperate climate) the temperature is uniformly decreasing with distance away from the maximum (~14 ºC)
observed around the commercial centres of Ueno, Shibuya and Shinagawa to a minimum (~10 ºC) observed in the more
open and rural outskirts (Fig. 3). A similar picture is obtained in Kuala Lumpur (tropical humid climate) where the
maximum (~31 ºC) is also associated with the city core and the rural surroundings to west and south-east are
considerably cooler (~25 ºC) and separated by a sharp drop (cliff) in temperature from the built-up area (Fig. 3).

    Figure 3. Air temperature distribution in (left) Tokyo observed on 30 August 1994 at about 22:00 using
temperature sensors mounted on local trains – fair weather and wind speed of 3.5 m s-1 (from Yamashita, 1996)
      and (right) Kuala Lumpur on 15 September 1980 between 21:00 and 22:00 (from Sham, 1990/91).

City size and air temperature UHI:
   The magnitude of UHIs depends on the size and geometry of the city (Oke, 1973). Using population (P) as a
surrogate of city “size”, UHI max is found to be proportional to log P when holding some controls constant: climate,
topography, rural surrounds, weather (calm, cloudless), time of day (night) and height of traverse (1.5–2 m) (Fig. 4).
This relationship works reasonably well for North America and European cities. Several tropical studies provide less
than the full criteria and the tropical results increase scatter, probably related to wetness. The slope of the relation
between city size and UHI max differs in different parts of the world. This is partly due to differences in the nature of the
cities (i.e. street geometry, greenspace, heat release) but also due to differences in the cooling potential of their rural

                                                             4
surroundings (e.g. deserts, agricultural
land, paddy fields, snow). Population is
not a universal surrogate of great value but
the relations have merit as first-order
estimators of UHI max, in region of
applicability and if P is related to site
character UHI max puts an upper bound
on values (Oke, 1999).
Examples of surface temperature Figure 4: Relationship between population (P) and maximum
UHI: urban heat island intensity (UHI max) for cities on different
In contrast to air UHIs, surface UHIs continents and representing different climate regions (Oke, 1999).
are often greatest by day with a maximum in areas of large buildings or paved surfaces with a minimum at night. At
regional and local scales, satellite sensors offer the ability to assess urban-rural differences and to give an integrated
value of the urban ‘skin’ temperature (Figs. 5 and 6). It must be pointed out, however, that several methodological
problems associated with the interpretation of these remotely-sensed data exist (Roth et al. 1989). Vertical surfaces,
such as building walls, are
under-represented by nadir
remote sensors or systematically
biased by off-nadir sensors which
essential represent a 2-D, bird’s-
eye view. Correspondence
between dry (built) and moist
(vegetated) surfaces with hot and
cool areas is often quite dramatic
(Fig. 6).
Figure 5: Urban heat island mapping at the city scale. Warmer surfaces are colored in red (from:
http://Satellite.Zodiak.com/destination/frames_version/mapping/map_scales/building_scale.html)
5Figure 6: Visible (left) and thermal infrared (right) images of sections from Baton Rouge, La. The yellow and red
areas are hot, and generally correspond with roads and buildings; blue and green areas are cool and indicate
water and vegetation. The solid blue band of color on the left side is the Mississippi River. The bright red areas in
this image are about 65 ºC; dark green and blue areas are around 25 ºC (from:
http://wwwghcc.msfc.nasa.gov/urban/urban_remote_sensing.html)
3.2 Humidity
Much less is know about urban effects on humidity. Urban/rural differences are small and the spatial pattern is
complex. The consensus of mid-latitude studies suggests that the urban canopy air is usually drier (lower vapour
density) by day, but slightly more moist (higher vapour density) by night. This pattern results from smaller vapour input
as a result of a reduction in vegetation and hence smaller transpiration rates in the city compared to the greater rural
evapotranspiration during the day. At night, a more humid environment is maintained in the urban area due to weak
evaporation when the moisture content of the lower layers of the rural air is depleted by dewfall.
3.3 Airflow
It becomes obvious that urbanization affects the wind climate when one walks around buildings on a windy day. It is
sometimes more sheltered and sometimes more gusty than an open site. The city as a whole affects the regional airflow.
When winds are weak, thermal effects dominate and local-scale wind system resulting in a flow towards the warm city
may be established. When winds are strong (> 5 m s-1), the buildings of the city may act as a barrier, deflecting the flow
around the center and slow the lowest layers as air crosses the city. This may result in changes in the wind direction due
to reduced Coriolis turning and together with the convergence caused by uplift over the city disrupt synoptic weather
fronts, cloud development and perhaps precipitation (e.g. Auer, 1981).
3.4 Precipitation
There is evidence to suggests that major urban areas cause changes in rainfall and increased occurrence of severe
weather (e.g. Changnon, 1981, Cotton and Pielke, 1995). Uplift over the city due to convergence (see above), increase
in cloud condensation nuclei from anthropogenic emissions and addition of moisture from industrial sources combine
so that requirements for precipitation are anomalously present. Full understanding of the mechanisms thought
responsible for enhanced rainfall, however, is not developed yet.
63.5 Turbulence
Modified surface heating and increased friction lead to perturbations in the mean wind and turbulence. These changes
are most pronounced within canyons and just above where the introduction of sharp-edged buildings directly affects the
airflow. The changed density and characteristics of the roughness elements alter the friction of the urban surface and
therefore the vertical turbulent transport of heat, mass (e.g. moisture, CO2) and momentum through increased
mechanical and thermal mixing. Observational studies show that drag coefficients and turbulence intensities are larger
(up to 50% for the latter) than their rural counterparts. The increased roughness and warmth of the city surface combine
to produce a generally less stable atmosphere and promote stronger interaction between the near surface air and the rest
of the UBL which results in an increase (doming) of the mixed layer. A comprehensive understanding of urban
turbulence is important for many real-world applications such as understanding and modelling the dispersion of air
pollutants or wind engineering practice for the design and construction of tall buildings.
4. Urban climate and global environmental change
The inadvertent modifications to urban climate may be used as analogues of the changes that humans cause at the
global scale (Oke, 1997b). Obviously, the outcomes are not identical in their spatial scales. Nevertheless, the
similarities in the magnitudes and the rate of climate change deserve attention as one considers how to react to global
environmental changes.
4.1 Global warming
Is it possible that urban changes are responsible for global warming? Because cities are the source of most greenhouse
gases and much of the aerosols that may lead to global warming they are indirectly responsible for the warming effect.
Oke (1997b) suggests that 85% of the global total of anthropogenic CO2, CFCs, methane and tropospheric O3 originates
in cities. The urban plumes of these substances extend hundreds, even thousands of kilometers downstream. Aerosols
emitted by urban/industrial sources also have both direct and indirect cloud-radiative effects which cause or ameliorate
changes in the global climate. However, the urban emissions do not directly warm the global atmosphere to any
significant extent. The UHI is an essentially local phenomenon - urban areas cover much less than 1% of the earth’s
surface and their extra heat content added to that of the global atmosphere is therefore insignificant.
There is, however, an important side issue. The measured global temperature is based on historical observations from
weather stations, most of which are located in or near towns and airports. It is therefore possible that the global
temperature record has been contaminated by readings from increasingly “urbanised” stations. Extensive efforts have
been made to calculate the amount of urban temperature effect and to separate this “spurious noise” from the larger,
non-urban climate signal. Karl and Jones (1989) suggest that the urban warming bias present in the entire US climate
record was between 0.1-0.4 ºC from 1901 to 1984. This effect extrapolated to the global temperature record reduces to
0.01-0.1 ºC (Jones et al., 1989). More recently, Hansen et al. (2001) find evidence of a modest urban warming even in
suburban and small-town air temperature records for US cities. They caution, however, that the inferred urban warming
could be an artifact of inhomogeneities in the station records. The consensus which now seems to emerge is that the
urban effects in the corrected global temperature signal are small.
At the local scale, however, urban dwellers have undergone a climate change of similar magnitude to that being
observed on the global scale: 1–2 ºC over about one century (Fig. 7). Cities could therefore serve as useful
“laboratories” in which to study the processes, effects and social influences of human activities. Urban populations and
administration have experienced the same magnitude and speed of thermal change observed and predicted by climate
7models. This means that they have also seen any biometeorological and societal effects and should be able to use that
information to plan appropriate responses to any future change (Oke, 1997b)
Figure 7: Long-term records of average
annual near-surface air temperature:
(a) for the globe, and station difference
between an urban and a nearby less
developed site near (b) Washington,
DC and (c) Sao Paulo (from Oke,
1997b).
4.2 Consequences of global warming
Several aspects of cities are temperature dependent and feedback upon the health of the inhabitants or
the costs of running a city (Table 2).
Table 2: Impacts of urban heat islands, and/or a warmer base climate, on temperature-sensitive aspects of cities
in cold and hot climate regions (from Oke, 1997b). + - beneficial; - - undesirable (‘losers’); (W) – winter; (S) –
summer; NA – not applicable; T - temperature
Climate impact
Cold Hot
Biological activity (plant growth, disease) + ?
Human bioclimate (comfort, wind-chill, heat + (W) / - (S) -
stress)
Energy use (space heating, air conditioning) + (W) / - (S) -
Water use (garden irrigation – pos. correlation - -
with T)
Ice and snow (transport disruption) + NA
Air pollution chemistry (weathering, - -
photochemistry)
8Biological activity
An increase in temperature usually stimulates biological activity which is mostly positive in cold climates where
growing seasons are lengthened. In Tokyo, for instance an increase the emergence and increase of subtropical flora and
fauna has been observed (The Japan Times, 2001). On the negative side, extra warmth may increase the range of insects
carrying infectious diseases. The main vector of dengue for example is flourishing in mankind's urban and suburban
environments and has helped maintain the prevalence of this disease in Asian regions. The breeding behaviour of
mosquitoes is very sensitive to temperature and only a small increase could result in an outbreak of this disease.
Human bioclimate
Inhabitants of cities in cold climates are likely to benefit in relation to human comfort and stress. Those in hot
climates or those irregularly exposed to high temperatures will bear an increasing heat burden, however (Figure 8).
Assuming future warming according to projections from global climate models, Kalkstein and Smoyer (1993) present
mortality statistics which show dramatic increases of heat-related deaths for many cities. Similarly, the number of
victims of heat stroke in Tokyo has nearly tripled since 1985, and is correlated to an increase in air temperature and the
number of “tropical” nights (The Japan Times,
2001). Using climate warming scenarios and
recognized thresholds for human comfort, it is
clear that the population likely to be most affected
is that in tropical climates.
Figure 8: Relation between maximum air
temperature and mortality in Shanghai from
1980 to 1989. Above a threshold of about 34 ºC,
heat deaths increase sharply. Shading
proportional to density of data points. (Oke,
1997b adapted from Kalkstein and Smoyer,
1993).
Energy use
If the global climate becomes warmer, cities in cold climates can expect to save fuel for space heating. Cities in hot
climates, however, will most likely face extra energy use for air-conditioning (Fig. 9). Air-conditioning use has
significant related issues. First, cooling the interiors of buildings results in the release of hot air which contributes to an
extra heat load outside which may lead to an
additional demand for air conditioning. Second,
depending on the power source used for air
conditioning, extra fuel use is likely to increase
the emission of greenhouse gases which in turn
contributes to global warming.
Figure 9: Relation between electricity power
load at 16:00 hours and average daily
temperature in Los Angeles for every day in
1986 (Oke, 1997b adapted from Akbari et al.,
1989).
9Air pollution
Atmospheric chemistry is strongly related to temperature. This is especially true for tropospheric ozone
concentrations. Hydrocarbons are important precursors for the production of ozone. Their primary anthropogenic
source is traffic. When mixed with NO and NO2 (which are also produced by the combustion of fuel) they interact with
the UV part of the sunlight and ozone is formed. This photochemical reaction is strongly stimulated by temperature (Fig.
10). There is also the possibility that extra natural
hydrocarbon release from shrubs and trees can
increase production of oxidants.
Figure 10: Relation between daily maximum
air temperature and daily maximum ozone
concentration in Connecticut. Shading
proportional to density of data points (Oke,
1997b).
5. Applications of UHI Research
Relatively little of the large body of knowledge concerning urban climate has found its way into the urban planning
process. However, if climatic factors were considered in future building, settlement or town planning it may be possible
to reduce some of the negative effects predicted following an increase in the UHI effect (Table 2); this would be
particularly beneficial to cities in tropical climates.
Examples of climate applications at the building scale are plentiful and often incorporated in traditional architectural
building forms which are very specific to local climate conditions. Similar examples of climate input to the design of
groups of buildings and whole settlements are not as readily available. Oke (1984) lists a few cases for cities in extreme
climatic environments (mostly having cold winters) where plans have been drawn up to address specific problems such
as very wet, snowy and windy conditions. In extreme climates, the role of the climate is dominant and is naturally given
high priority in the planning process. The reason why climate is included in the planning of developments is often to
address the following 4 concerns (after Oke, 1984):
• Wind (to avoid problems associated with wind loads on structures; concern with energy loss from buildings;
street-level winds which may be dangerous to pedestrians; etc.)
• Solar radiation (to avoid mutual shading of buildings or maximize the solar energy potential through building
orientation; need for shading to reduce solar load; etc.)
• Precipitation/runoff (adequate flood control, storm water routing and drainage system)
• Air pollution (to prevent the negative impact of pollutant emissions in the vicinity of sources; ventilation of entire
building groups or cities)
Because of the current demands to create a more proactive process to join together knowledge on the urban climate,
planning and design concepts, the US Environmental Protection Agency in concert with the Department of Energy’s
Lawrence Berkeley Laboratory produced two major design concepts for mid-latitude cities with hot and relatively dry
10summers (Garbesi et al., 1989; Akbari et al., 1992): (1) The use of light-coloured surfaces to enhance the reflection of
incoming solar radiation to reduce solar heating during daytime and hence decrease the need for cooling. (2) Planting of
trees to produce cooler temperature through shading and evaporative cooling.
Using a numerical, meso-scale meteorological model, Kinouchi and Yoshitani (2001) calculate the cooling effect due
to an increase in the amount of roof-top vegetation in Tokyo from the current 24% to 40%. The near surface air
temperature is predicted to decrease by 0.6 ºC as a result of increased evapotranspiration and reduced heat conduction
into the buildings. The model also predicts that the region of cooler air will be advected over the less urbanized
surroundings in the afternoon.
5.1 Park-induced coolness
On a larger scale, vegetated parks are also likely to be cooler than their surrounding built environment. This is
demonstrated in remote sensing images of the surface temperature of cities which show marked coolness of vegetated
surfaces in general and parks in particular (e.g. Honjo and Takakura, 1986, Roth et al. 1989 and Gallo et al., 1993).
Temperate climate cities
Influence of surface coolness upon the air can be found in maps of urban heat islands (e.g. Oke, 1989, Spronken-
Smith and Oke, 1998). Like the urban heat island effect, the thermal contrast between a park and its urban surroundings
is best developed on calm, cloudless nights with the nocturnal coolness of the park being established soon after sunset
and reaching its maximum cooling near sunrise. Depending on the size of the park the coolness is typically between 1-2
ºC at night but can reach up to 5-6 ºC under ideal conditions and for some cities (Vancouver: Spronken-Smith and Oke,
1998. Sacramento: Spronken-Smith and Oke, 1998; Tokyo: Hamada and Mikami, 1994). The actual magnitude depends
on park type (substantial tree canopy: maximum cooling in afternoon; open grass parks: max cooling near sunrise),
whether it is irrigated, nature of surrounding landscape and macroscale climate. The area of lower air temperature
associated with the park reaches beyond its border by about one park width.
Tropical climate cities
Literature from cities in tropical climates is sparse. This is surprising given the potential of parks to cool and thereby
provide relief from excessive heat loads. In Tuscon, a hot and dry city, Spronken-Smith (1994) observed the air of the
largest park in the city to be up to 6.8 ºC cooler than its suburban environs. In Kuala Lumpur, a hot and humid city, parks
are 4-5 ºC cooler than nearby commercial areas in the afternoon (e.g. Sham 1991) with only a 1 ºC difference found in
the evening between well-treed parks and their urban surroundings. In Madras, India, Sundersingh (1991) reports that at
night parks may provide cooling of up to 4 ºC. In cities with uncomfortably hot summers, urban parks offer the potential
to cool neighbourhoods, which is particularly important because reduction of only a few degrees can be critically
important in terms of human health and comfort.
Universal solutions are probably not possible. An increase in humidity due to excessive use of trees may have adverse
effects in humid climates because they add moisture to the already humid air. They may also reduce the ventilation of
houses around which they grow. Because of the sun-earth geometry, roofs are extremely important in tropical building
climate. Shade trees should be tall and have a broad enough canopy to shade the roof as well as the walls, otherwise the
accompanying loss of ventilation due to reduced turbulent transport will lead to oppressive conditions (Oke, 1989).
Recommendations
Systematic research into the benefits of UHI mitigation efforts is still scarce. Questions to be addressed include:
• Is there an optimum proportion of the city to devote to vegetation
11• Is there an optimum arrangement of such greenspace
• Is there a preferred orientation for roads and buildings to maximize solar radiation influences
• Are there optimal height/width ratios for street canyons to maximize energy conservation or pollutant
dispersal.
Further measure to improve the urban environment and save energy include:
• reducing emissions
• switching to fuels with less GHG side effects
• greater use of passive heating and cooling technology,
• intelligent use of trees to shelter and shade
• increased use of light-coloured surfaces in hot cities
• more compact city design and greater use of mass transport
Addressing these issues, however, depends on the political will of local and national governments and is often not
possible because funds are limited and may be used to resolve more immediate needs, especially in less developed
countries.
References
Akbari, H, Rosenfeld, R., and Taha, H., 1989: Recent developments in heat island studies: technical and policy. In
“ Controlling summer heat islands”, K. Garbesi et al. (eds.). Lawrence Berkeley Laboratory, 14–30.
Akbari, H., Davis, S., Dorsano, S., Huang, J. and Winett, S., 1992: Cooling our communities: a guidebook on tree planting
and ligh-coloured surfacing. US Environmental Protection Agency, Office of Policy Analysis, Climate Change Division,
Washington, DC.
Auer, A. H., 1981: Urban boundary-layer. In “METROMEX: a review and summary”, S. A. Changon (ed.). AMS Meteorol.
Monogr., 18, 41-62.
Changnon, S. A., 1981: METROMEX: a review and summary”, S. A. Changon (ed.). AMS Meteorol. Monogr., 18.
Cotton, W. R. and Pielke, R. A., 1995: Human Impacts on Weather and Climate. Cambridge University Press.
Gallo, K. P., McNab, A.L., Karl, T. R., Brown, J. F., Hood, J. J., Tarpley, J. D., 1993: The use of NOAA/AVHRR data for
assessment of the urban heat island effect. J. Appl. Meteorol., 32, 900-908.
Garbesi, E., Akbari, H, and Martien, P., 1989: Controlling summer heat islands. Lawrence Berkeley Laboratory, Energy
Analysis Program.
Hamada, T. and Mikami, T., 1994: Cool island phenomenon in urban green spaces: a case study of Meiji Shrine and Yoyogi
Park. Geographical Review of Japan, 67, 518-529.
Hansen, J., Ruedy, R., Sato, M., Imhoff, M., Lawrence, W., Easterling, D., Peterson, T., and Karl, T., 2001: A closer look at
United States and global surface temperature change. J. Geophysical Res., 106, 23947-23963.
Honjo, T and Takakura, T., 1986: Analysis of temperature distribution of urban green spaces using remote sensing data.
Journal of the Japanese Institute of Landscape Architects, 49, 299-304.
Jones, P. D., Kelly, P. M., Goodess, C. M., Karl, T., 1989: The effect of urban warming on the Northern Hemisphere
temperature average. J. Climate, 2, 285-290.
Kalkstein, L. S., and Smoyer, K. E., 1993: The impact of climate change on human health: some international implications.
Experientia, 49, 969-979.
Karl, T., and Jones, P. D., 1989: Urban bias in area-averaged surface air temperature trends. Bull. Am. Meteorol. Soc., 70,
265-270.
Kinouchi, T. and Yoshitani, J., 2001: Simulation of the urban heat island in Tokyo with future possible increases of
anthropogenic heat, vegetation cover and water surface. Proceedings 2001 International Symposium on Environmental
Hydraulics, Tempe, AZ, Dec 5-8, 2001 (CD-ROM).
Oke, T. R., 1973: City size and the urban heat island. Atmos. Environ., 7, 769-779.
12Oke, T. R., 1989: The micrometeorology of the urban forest. Philosophical Transactions of the Royal Society of London, B
324, 335-349.
Oke, T. R., 1995: The heat island of the urban boundary layer: Characteristics, causes and effects. In ‘Wind climate in cities’,
J. E. Cermak et al. (eds.), Kluwer Academic Publishers, 81-107.
Oke, T. R., 1997a: Urban Environments. In ‘The surface climates of Canada’, W. G. Bailey et al. (eds.), McGill-Queen’s
University Press, 303-327.
Oke, T. R., 1997b: Urban climates and global change. In ‘Applied climatology: principles and practice’, A. Perry and R.
Thompson (eds.), London, Routledge, 273-287.
Oke, T. R., 1999: City size and the urban heat island – revisited. Proceedings of the 15th International Congress of
Biometeorology & International Conference on Urban Climatology, 8-12 November, Sidney, Australia (CD-ROM).
Pupulation Reference Bureay, 2001: http://www.prb.org/Content/NavigationMenu/PRB/AboutPRB/Population_Bulletin2/
Population_Bulletin.htm.
Roth, M., Oke, T. R. and Emery, W. J., 1989: Satellite-derived urban heat islands from three coastal cities and the utilization
of such data in urban climatology. Intl. J. Remote Sensing, 10, 1699-1720.
Sham, S., 1991: Urban climatology in Malaysia: an overview. Energy and Buildings, 15-16, 105-117.
Spronken-Smith, R. A. 1994: Energetics and cooling in urban parks. Unpublished Ph.D. Thesis. The University of British
Columbia, Vancouver.
Spronken-Smith, R. A. and Oke, T. R. 1998: The thermal regime of urban parks in two cities with different summer climates.
Intl. J. Remote Sensing, 19, 2085-2104.
Sundersingh, S. D., 1991: Effect of heat islands over urban Madras and measures for its mitigation. Energy and Buildings,
15-16, 245-252.
The Japan Times, 2001: Temperatures push new heights in Tokyo, 24 September 2001.
Yamashita, S., 1996: Detailed structure of heat island phenomena from moving observations from electric tram-cars in
metropolitan Tokyo. Atmos. Environ., 30, 429-435.
13You can also read