Catalytic hydrotreating of bio oil and evaluation of main noxious emissions of gaseous phase - Nature
←
→
Page content transcription
If your browser does not render page correctly, please read the page content below
www.nature.com/scientificreports
OPEN Catalytic hydrotreating of bio‑oil
and evaluation of main noxious
emissions of gaseous phase
Rami Doukeh1, Dorin Bombos1, Mihaela Bombos2, Elena‑Emilia Oprescu1,2,4*,
Gheorghe Dumitrascu3, Gabriel Vasilievici2 & Catalina Calin1,4*
Bio-oil produced from biomass pyrolysis has the potential to become an alternative renewable
fuel. However due to the high content of oxygenated compounds is unsuitable as transportation
fuel. The objective of this work is to evaluate the catalytic activity of CoMo /γ-Al2O3-HMS in the
hydrotreating process of biomass pyrolysis bio-oil. The prepared catalyst was characterized by
different techniques (X-ray diffraction (XRD), transmission electron microscopy (TEM), Fourier
transform infrared spectroscopy (FT-IR) and X-ray photoelectron spectroscopy (XPS)) analysis. The
experiments were carried out in a flow fixed-bed reactor at the temperature range of 250–320 °C,
pressure between 20–40 bar, and LHSV of 3 h-1. The results showed that at mild conditions of 320 °C
and 40 bar, the catalyst is very active in the hydrotreating process leading to a decrease of total acid
number of hydrotreated bio-oil with almost 89% and bio-oil conversion of 87.23%. In addition, in
order to evaluate the harmful emissions resulted from combustion of gaseous phase obtained in the
hydrotreating process a chemical modelling algorithm was developed.
Biogas plants are alternative sources for renewable energy, biomass waste treatment and organic fertilizers (diges-
tion waste, i.e. digestate). However, an accumulation of biogas plants in certain regions might lead to an oversup-
ply of digestate1, causing many environmental concerns (odor control, transportation cost, pathogen, heavy metal
(loid) contamination)2. Digestate pyrolysis can be an environmentally and energy recovery solution for digestate
disposal3.Typically, this process is performed between 400 and 700 °C at near atmospheric pressure or below, in
the absence of oxygen. Bio-oil produced from biomass pyrolysis has the potential to become an alternative renew-
able fuel and raw material for fine chemicals production generating thus bio-based high added value p roducts4.
In general, pyrolysis oil contains hundreds of organic compounds including hydrocarbons and oxygenated
compounds (i.e. organic acids, aldehydes, ketones and phenolics)5. The presents of these compounds cause bio-oil
to have low heating value, low solubility in fuels such as diesel/gasoline, poor thermal and chemical stability and
high acidity, high viscosity and high corrosiveness than petroleum6,7. However, pyrolysis oil can be converted
to transportation fuel by catalytic treatment. The catalysts and conditions used are very similar to those used
in petroleum hydrodesulfurization, hydrotreating, and hydrocracking processes, more generally described as
hydroprocessing8. A promising upgrading technology is considered to be catalytic hydrotreatment of bio-oil,
which involves treatment of pyrolysis oil with hydrogen in the presence of a heterogeneous catalyst leading to
gasoline or diesel like p roducts9.
Different hydrotreating catalysts have been investigated, such as Ni/SiO2, Ni/ZrO2, Ni/CeO2, Ni/Al2O3, Ni-Cu/
SiO2, Ru/C, Pt/C, Pd/C, Pd/SiO2, Pt-Ni/SiO2, Pd–Ni/SiO2 and Cu/SBA-1510. Wildschut J. et al.,11 compared the
results of typical hydrotreatment catalysts (sulfide NiMo/Al2O3 and CoMo/Al2O3) with heterogeneous noble-
metal catalysts (Ru/C, Ru/TiO2, Ru/Al2O3, Pt/C, and Pd/C). The Ru/C catalyst was found to be superior to the
classical hydrotreating catalysts with respect to oil yield (up to 60 wt %) and deoxygenation level (up to 90 wt
%). However, due to the high cost and low availability of noble metals, their industrial applications are more
difficult12. Moreover, efforts on increasing the economic performance of bio-oil hydrotreating technology lies on
the application of non-noble metal catalysts, mild reaction condition (low temperature and hydrogen pressure)
1
Chemistry Department, Petroleum-Gas University of Ploiesti, 39 Bucuresti Blvd., 100680 Ploiesti,
Romania. 2National Institute for Research and Development for Chemistry and Petrochemistry ICECHIM
BucurestiNational Institute for Research and Development for Chemistry and Petrochemistry ICECHIM Bucuresti,
202 Splaiul Independentei, 060021 Bucharest, Romania. 3Department of Engineering Thermodynamics,
‘‘Gh. Asachi’’ Technical University of Iasi, Bd. D. Mangeron, 59‑61, 6600 Iasi, Romania. 4These authors contributed
equally: Elena-Emilia Oprescu and Catalina Calin. *email: oprescuemilia@gmail.com; catalina.calin20@
yahoo.com
Scientific Reports | (2021) 11:6176 | https://doi.org/10.1038/s41598-021-85244-z 1
Vol.:(0123456789)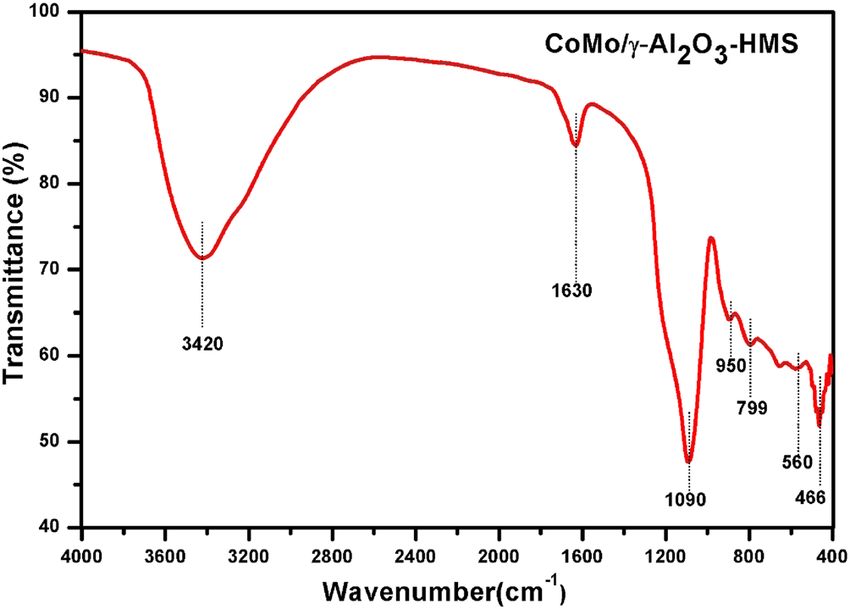
www.nature.com/scientificreports/
Sample Surface area (m2/g) Pore volume (cc/g) Mean pore diameter Dv(d) (nm)
γ-Al2O3-HMS 308.37 0.631 5.49
CoMo/γ-Al2O3-HMS 280 0.440 3.66
Table 1. Textural properties of the support and of the catalyst.
Figure 1. Pore size distribution and adsorption–desorption isotherm of the γ-Al2O3 –HMS support.
and high selectivity towards desired products. Nevertheless, the design of highly active and stable catalysts
remains as the key challenge which plays a significant role in the implementation of biomass in the future biore-
finery schemes13. In recent years, non-noble metal catalysts based on less-expensive metals such as Ni, Co and
Mo have been reported to exhibit high activity and selectivity for decarboxylation/decarbonylation process14.
Among them, NiMo and CoMo sulfides catalyst have been widely used in bio-oil hydrotreating. However,
the main disadvantage of these catalysts is the requirement of the presence of sulfur in the processed feeds to
maintain their activity and selectivity and, hence, end products is inevitably contaminated by sulfur13,15. Also,
sulphided catalysts are rapidly deactivated by w ater9 and coke formation16. In order to solve these issues, non-
sulfided NiMo or MoCo catalysts on various supports have been s tudied17. However, many challenges remain
to improve the catalyst activity, stability, and selectivity at minimum amounts of hidrogen (i.e., low hidrogen
pressures), and low temperatures, because high hydrogen pressure and temperatures, favor coke formation and
thus leading to reactor fouling and product deterioration18,19. Significant amounts of coke could form during
the hydrotreating at elevated temperature due to the insufficient active hydrogen supply, which cannot match
the demand of the broken bonds. Furthermore, coke formation is a complicated process that is poorly studied20.
Although the commercial CoMo and NiMo catalysts are commonly used at high temperatures of above 350 °C,
they are sufficiently active at lower temperatures15,17,21. Nevertheless, the information regarding the application
of non-noble catalysts such as CoMo at low temperatures and pressure is rather limited15. In this context, the
objective of this paper is to study, the catalytic upgrading of digestat pyrolysis oil via mild hydrotreating process
of over CoMo /γ-Al2O3-HMS. The influence of temperature and pressure on bio-oil conversion and deoxygena-
tion efficiency was investigated. In addition, a chemical modelling algorithm was developed in order to evaluate
the harmful emissions resulted from combustion of hydrotreating gaseous phase. This calculation algorithm can
be applied to any pressurized or atmospheric combustion engine fueled with different mixture of combustible
gases such as: natural gas, hydrogen-enriched natural gas and oxy-fuel.
Results and discussion
Catalyst characterization. The textural properties, such as specific surface area, pore size distribution
and pore volume of the γ-Al2O3-HMS support and corresponding CoMo catalyst, were evaluated by nitrogen
adsorption–desorption isotherms using Brunauer-Emmet-Teller (BET) method (Table 1). The γ-Al2O3-HMS
2/g, a mean pore diameter of 5.49 nm and a total pore volume
support has a high specific surface area of 308.37 m
of 0.631 cm3/g. The addition of Co and Mo to γ-Al2O3-HMS support leads to a decrease in textural properties.
The pore size and pore volume reflect a decrease of about 30% after impregnation indicating that impregnation
may block the pores (Table 1).
The N2 adsorption–desorption isotherm of the support and its catalyst is attributed to IV type isotherm
(Figs. 1, 2) and the nitrogen isotherm reveals a hysteresis loop of H2 and H3-type respectively. The alteration
of hysteresis loop shape for CoMo/γ-Al2O3-HMS catalyst also indicate that there is plugging of mesopores and
there are changes in the support structure after impregnation.
Scientific Reports | (2021) 11:6176 | https://doi.org/10.1038/s41598-021-85244-z 2
Vol:.(1234567890)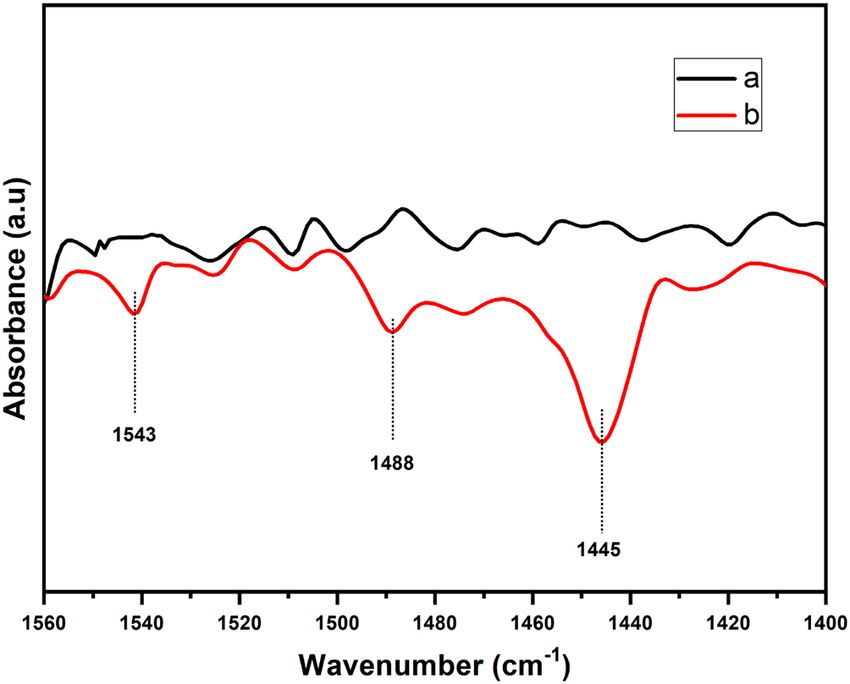
www.nature.com/scientificreports/
Figure 2. Pore size distribution and adsorption–desorption isotherm of the CoMo/γ-Al2O3 –HMS catalyst.
Figure 3. SEM images of the catalyst CoMo/γ-Al2O3-HMS a100 µm and b 5 µm image scale bar.
Scanning Electron Microscopy (SEM) images of the synthesized CoMo/γ-Al2O3-HMS catalyst are shown in
Fig. 3 with different magnifications (the left-side image scale bar is 100 µm and the right-side 5 µm) and show
the homogeneity of the sample.
The Fourier transform infrared (FT-IR) spectrum of the catalyst (Fig. 4) shows broad bands around 3420 cm-1
and 1630 cm-1, which were assigned to stretching and bending modes of –OH group of water molecules on the
surface of the solid22. The peaks in the region of 450–800 cm-1 were assigned to the oxide structures. The accurate
assignment of the bands to specific compounds was difficult because the different compound bands overlap. The
Si–O–Si specific bands (from HMS) are assigned at 1090 cm-1, 950 and 800 cm−123.
The acidic properties of CoMo/γ-Al2O3-HMS catalys were evaluated through the FT-IR analysis of pyridine
adsorption (Fig. 5). The pyridine-adsorbed FT-IR spectrum showed features in the region of 1400–1600 cm−1 due
to the stretching vibrations of M–N (metal–nitrogen) and N–H (pyridinium ion). The band assigned to pyridine
adsorbed onto Lewis-type acid sites is recorded at 1445 cm−1, the band at 1543 cm−1 is due to pyridine adsorbed
on Brönsted-type acid sites and the band around wavenumber 1488 cm−1 is due to physisorbed p yridine24,25. The
calculated results are 97.41 μmol/cm for Lewis-type acid sites and 18.83 μmol/cm for Brönsted-type acid sites.
The acid site density of 1.64 × 10¹⁸ sites/m2 and total acidity of 4.59 × 10²⁰ sites/g of the catalyst were calculated
according to A.I. Osman et al.26 (Figure S1).
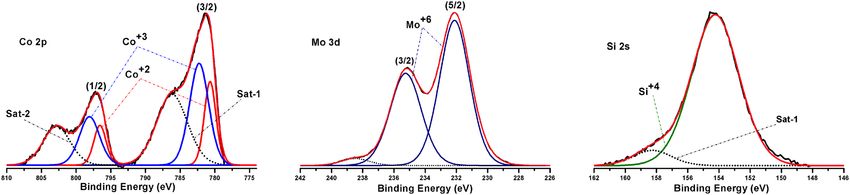
The surface components and chemical states of metal species on the catalysts were studied by X-Ray Photo-
electron Spectroscopy (XPS) method. Results obtained by this technique are shown in Fig. 7 and Table 2. XPS
signals were assigned according to the literature and the official web page of National Institute of Standards and
Technology (NIST)27. Binding energies in the ranges of 780–783 eV and 232 eV are ascribed to Co2p and Mo3d
spectra and 154 eV to Si 2 s. The characteristic Mo 3 d5/2 peak at 232.12 eV indicate the presence of M o6+ which
28,29 3+ 2+ 3+
can be attributed to M oO3 . Co is present as C o and C o species. The binding energy of C o , with the Co
2p3/2 profile, is 782.27 eV which could be ascribed to C o3O4 and C oOOH30,31 Co2+ may be present as CoO and
CoAl2O432 with Co 2p3/2 peak at 780.68 eV. From the calcination step of the catalyst preparation it could also be
Scientific Reports | (2021) 11:6176 | https://doi.org/10.1038/s41598-021-85244-z 3
Vol.:(0123456789)www.nature.com/scientificreports/
Figure 4. IR spectrum of CoMo/γ-Al2O3-HMS catalyst.
Figure 5. Pyridine-adsorbed FT-IR spectrum of CoMo/γ-Al2O3-HMS catalyst.
Element Spectral line Energy (eV) Assigned species
2p3/2 782.27 Co+3
Co
2p3/2 780.68 Co+2
Mo 3d5/2 232.12 Mo+6
Si 2s 154.23 Si4+
Table 2. XPS binding energies and assigned species for Co 2p, Mo 3d and Si 2 s.
formed Co and Mo aluminates or double oxides containing Co and Mo. According to Fig. 6 and Table 2, Si (from
HMS mesoporous silica) occurs in the Si 2 s energy range of 154.23 eV, assigned to Si4+ (SiO2).
Chemical composition of pyrolysis bio‑oil. The chemical composition of pyrolysis bio-oil is shown in
Table S1. The main compounds identified were unsaturated organic compounds, carbonyl compounds, furan
derivatives, phenols, lower carboxylic acids and unsaturated fatty acids. These compounds have a different polar-
ity and a wide range of boiling point. Compounds with high reactivity containing olefin groups conjugated with
carbonyl groups (i.e. cyclopenten-1-one derivatives) were also been identified. These compounds can deactivate
the catalyst at high temperatures due to the formation of oligomers.
Scientific Reports | (2021) 11:6176 | https://doi.org/10.1038/s41598-021-85244-z 4
Vol:.(1234567890)www.nature.com/scientificreports/
Figure 6. XPS Co 2p, Mo 3d and Si 2 s spectra of CoMo/γ-Al2O3-HMS catalyst.
Property Value UM
Density 0.9956 g/mL
Water content 25.10 %
Total acid number 134.9 mg KOH/g
Saponification number 224.12 mg KOH/g
Table 3. The physical characteristics of the pyrolysis bio-oil.
Figure 7. The influence of temperature over bio-oil conversion.
The physical characteristics of the pyrolysis bio-oil (Table 3) show relatively high water content (over 25 w.t
% ), density about 0.9956 g / mL due to the presence of water and short carboxylic acids (acetic, propionic and
butyric ) in relatively high concentrations. The presence of short carboxylic acids and fatty acids justifies the high
total acid number and saponification number of almost 135 and respectively, 224.12 mg KOH /g.
Catalysts activity evaluation. The catalytic activity of CoMo /γ-Al2O3-HMS for the bio-oil hydrotreating
was evaluated in the temperature range of 250–320 °C, pressure between 20–40 bar, and constant LHSV of 3 h−1.
The effect of temperature over bio-oil yield is presented in Fig. 7. The results showed that the bio-oil conver-
sion increases gradually with temperatures, from 62.86% to over 77.42% at maxim temperature of 320 °C. This
behavior is due to the different reactivity of the various classes of oxygenated compounds present in the bio-oil.
The phenolic as well as the carbonyl compounds are reactive in the hydrotreating process from lower temperature
values of 250 °C. Meanwhile, the carboxylic compounds have a lower reactivity in the deoxygenation at tempera-
ture value of 250 °C, thus the hydrotreating process of these compounds begins at temperatures above 300 °C.
Figure 8 presents the yields of products composition of liquid organic phase resulted after bio-oil hydro-
treating process. The yields of C
6-C8 hydrocarbon and furan fractions have similar values at temperatures up to
275 °C, after which the yield of furans decreased slightly with temperature reaching about 10% at 320 °C, due
to their lower reactivity in the hydrodeoxygenation process. The yield of fatty acid composition decreased with
increasing temperature reaching the lowest value about 5% at 320 °C. The yield of C 15-C18 hydrocarbon fraction
increases with increasing temperature, perhaps due to the hydro-decarboxylation reaction of the fatty acids
from the waste vegetable oil fraction. As expected, the total acid number of hydrotreated bio-oil decreases with
temperature with almost 89%, from 135.9 to almost 15 mg KOH/g.
Scientific Reports | (2021) 11:6176 | https://doi.org/10.1038/s41598-021-85244-z 5
Vol.:(0123456789)www.nature.com/scientificreports/
Figure 8. The influence of temperature over the yields in products composition of liquid organic phase.
Figure 9. The influence of temperature over bio-oil conversion.
Minimizing the consumption of hydrogen is an important issue for hydrotreating process of bio-oil due to
the possibility of obtaining ring saturated products via unwanted hydrogenation process under high hydrogen
pressure. These compounds decrease the octane number of the upgraded product which could hinder its direct
utilization as fuel or blending with conventional oil or in the forthcoming bio-refineries33. The latest results of
Mo-based catalysts show great potential for converting lignin-derived bio-oil into aromatic hydrocarbons at low
hydrogen pressure13. In this regard, we study the influence of pressure over bio-oil conversion during hydrotrating
process in the range of 20–40 bar at constant temperature of 320 °C. As can be observed in Fig. 9, the conversion
of bio-oil increases with pressure, the increase being more pronounced in the range of 30–40 bar. It is observed
that low pressures (20–30 bar) favors preferentially the hydrodeoxygenation reaction of carbonyl and phenolic
compounds34,35 while higher pressures hydrodeoxygenate the carboxylic c ompounds21,36. Therefore, at 20 bar
the bio-oil conversion was of 77.42 and increased to 87.23% at 40 bar.
Regarding the yields of products composition, high pressure favors the decarboxylation of the lipids and fatty
acids, so that the yield of the C15-C18 hydrocarbon fraction increases from 41.64 at 20 bar to maximum value of
50.79 at 40 bar. In contrast, the yield of C6-C8 hydrocarbon fraction, resulting mainly from the hydrotreating
of phenols and carbonyl compounds, is not significantly influenced by the pressure variation, the growth being
insignificantly higher. The yield of furans does not change practically on the studied pressure range, the efficiency
of the catalyst studied in the hydrotreating process of furans being relatively low at these pressure values (Fig. 10).
The total acid number of the hydrotreated bio-oil decreases with the increase of the pressure, behavior explained
by the increase activity of the Co-Mo catalyst, at pressure over 30 bar, for hydro-decarboxylation process.
Evaluation of main noxious emissions of bio‑oil hydrotreating gaseous phase. After each
experiment, the gas-phase composition was analyzed, and the most representative data are given in Table 4. The
main component of gaseous phase is unreacted hydrogen, followed by CO and C1-C4 hydrocarbons in different
percent depending on the experimental parameters used.
Unlike natural gas which has been intensively studied in the combustion process, synthesis gas fuel mixtures
have not been widely investigated. Therefore, an evaluation of main noxious emissions was performed through
Scientific Reports | (2021) 11:6176 | https://doi.org/10.1038/s41598-021-85244-z 6
Vol:.(1234567890)www.nature.com/scientificreports/
Figure 10. The influence of temperature over the yields in products composition of liquid organic phase.
Fuel
Nf = 1 kmole Air
nH2 nCO nCH4 nC2H4 nC2H6 nC3H6 nC3H8 nC4H10 nO2 nN2
[kmole] [kmole] [kmole] [kmole] [kmole] [kmole] [kmole] [kmole] [kmole] [kmole]
0.27867 0.161 0.45878 0.03589 0.01879 0.01335 0.006222 0.0273 (1 + x).nO2,min (1 + x).nN2,min
Table 4. The mole composition in the flow section “0”. where nO2,min = 0.5 nH2 + 0.5 nCO + 2 nCH4 + 3 nC2H4 + 3.5
nC2H6 + 4.5 nC3H6 + 5 nC3H8 + 6.5 nC4H10 = 1.5795 kmole, nN2,min = 3.7619.nO2,min = 5.9418 kmole and. x is the excess
air/oxygen.
flow section “1”
IFCS FHDS
air N2 heated and
O2 dissociated
H2O
fuel flue gases
CO2
flow section “0” flow section “2”
HHV
Figure 11. The scheme of the combustion process.
a pure chemical modeling algorithm developed. This chemical modeling algorithm allows to chemically analyze
the constant pressure combustion for any gaseous mixture fuels. The chemical model chose the minimum and
necessary chemical equations in order to quantify the air based combustion noxious.
The evaluation of main noxious emissions was performed through a pure chemical modeling algorithm
developed by authors at necessity. This chemical modeling algorithm allows to chemically analyze the constant
pressure combustion for any gaseous mixture fuels. The chemical model chose the minimum and necessary
chemical equations in order to quantify the air based combustion noxious. The main combustion noxious emis-
sions, i.e. CO2, CO and NOx, for the gaseous mixture fuel were evaluated through a combustion chemistry model
involving the energy and mass balance equations applied to three types of chemical reactions:
• primary oxidation of inlet chemical species of gaseous fuel,
• secondary dissociation chemical reactions and,
• tertiary recombination chemical reactions.
The combustion was thought to be made in two successive fictitious steps complying with energy and mass
balance laws, see Fig. 11.
Scientific Reports | (2021) 11:6176 | https://doi.org/10.1038/s41598-021-85244-z 7
Vol.:(0123456789)www.nature.com/scientificreports/
yCO2 zH2O rO2 rN2
[kmole] [kmole] [kmole] [kmole]
0.89706 0.762916 1.5795.x 5.9418.(1 + x)
Table 5. The mole composition in the flow section ”1”. Where yCO2 = nCO + nCH4 + 2 nC2H4 + 2 nC2H6 + 3 nC3H6 + 3
nC3H8 + 4 nC4H10. zH2O = 0.5 nH2 + nCH4 + nC2H4 + 1.5 nC2H6 + 1.5 nC3H6 + 2 nC3H8 + 2.5 nC4H10.
hf0,O2 hf0,N 2 hf0,H2 hf0,CO hf0,CO2 hf0,CH4 hf0,C2H4 hf0,C2H6 hf0,C3H6 hf0,C3H8 hf0,C4H10 hf0,H2O
[kJ/kmole] [kJ/kmole] [kJ/kmole] [kJ/kmole] [kJ/kmole] [kJ/kmole] [kJ/kmole] [kJ/kmole] [kJ/kmole] [kJ/kmole] [kJ/kmole] [kJ/kmole]
0 0 0 − 110,527 − 393,522 − 74,873 + 52,467 − 84,740 + 20,430 − 103,900 − 126,800 − 285,830
Table 6. The enthalpy of formation of chemical species in the flow sections “0”, “1”. p0 = p1 = 0.8 MPa,
T0 = T1 = 298 K38–44.
• the first step is an isothermal and constant pressure combustion at the standard temperature T0 = 298 K
and at an imposed pressure p ≥ p0, with p0 = 0.1 MPa; this step is performed inside an isothermal fictitious
combustion space, IFCS, and it is conceived without dissociation;
• the second step is heating with dissociation of flue gases produced in the first step; this process takes place
inside the second fictitious heating and dissociation space, FHDS, and here it is consuming the heat released
in the first step, i.e. the higher heating value HHV.
The combustion inside IFCS. The mass balance for IFCS considers chemical oxidation reactions without dis-
sociation of the gaseous fuel. The mass balance allowed the computation of inlet and outlet mole fractions of
all chemical species. The Table 4 includes the mole fractions in the flow section “0” and the Table 5 includes the
mole fractions in the flow section “1”.
The energy balance for IFCS computed the value of the combustion higher heating value, HHV, released by
the constant temperature and constant pressure combustion of the fuel.
Ni · h0f ,i − Nj · h0f ,j = HHV [kJ/kmole]
outlet inlet
Ni and h0f ,i are the kmole number and the standard enthalpy of formation for each outlet chemical species, Nj
and h0f ,j are the kmole number and the standard enthalpy of formation for each inlet chemical species. Thus it
is yielding, see Table 6:
HHV = yCO2 · h0f ,CO2 + zH2O · h0f ,H2O − nCO · h0f ,CO − nCH4 · h0f ,CH4 − nC2H4 · h0f ,C2H4
− nC2H6 · h0f ,C2H6 − nC3H6 · h0f ,C3H6 − nC3H8 · h0f ,C3H8 − nC4H10 · h0f ,C4H10 = −5.15403 · 105 [kJ/kmole]
(1)
The flue gases heating with dissociation inside FHDS. The non-dissociated flue gases leaving the IFCS enter the
FHDS where two simultaneous processes take place:
• chemical reactions of dissociation and recombination controlled by chemical equilibrium constants and
• constant pressure heating of all chemical species, non or dissociated ones.
The both processes are completed by consuming the HHV. The flow scheme required by the mass and energy
balance laws is presented in the Fig. 12. The below chemical reactions of dissociation and recombination were
considerated.
2. CO2 → 2. CO + O2 (2)
2. H2 O → 2. H2 + O2 (3)
2. H2 O → 2. OH + H2 (4)
N2 + O2 → 2NO (5)
N2 + 2. O2 → 2. NO2 (6)
The mass balance for FHDS gives the following four dependences:
Scientific Reports | (2021) 11:6176 | https://doi.org/10.1038/s41598-021-85244-z 8
Vol:.(1234567890)www.nature.com/scientificreports/
a kmole N2
yCO2 kmole b kmole O2
c kmole CO2
zH2O kmole d kmole H2O
e kmole CO
rO2 = x.O2,min kmole f kmole NO
g kmole H2
rN2 = (1 + x).N2,min kmole h kmole OH
i kmole NO2
flow flow
section “1” section “2”
Figure 12. The inlet/outlet flow scheme of chemical species for FHDS.
a = rN2 − 0.5. f−0.5. i (7)
b := rO2 − 0.5. f − i + 0.5. e + 0.5. g (8)
c = yCO2 −e (9)
d = zH2O −g−h (10)
The mass balance is completed trough chemical equilibrium constants K.
νC +νD −νA −νB
C ν C · D νD p
νA · A + νB · B → νC · C + νD · D ⇒ K = ν ·
A A · B νB p0
Therefore they are yielding:
• dissociation of C
O2
2+1−2
0.5
e2 · b e2 · b K1 · c 2 p0
p p
K1 = · = · ⇒e= · (11)
c2 p0 c2 p0 b p
• dissociation of H
2O giving OH and H 2
2+1−2
0.5
g2 · b g2 · b K2 · d 2 · p0
p p
K2 = · = · ⇒ g = (12)
d2 p0 d2 p0 b·p
• dissociation of H
2O giving H 2 and O2
0.5
h2 · g p 2+1−2 h2 · g K3 · d 2 · p0
p
K3 = · = · ⇒ h = (13)
d2 p0 d2 p0 g ·p
• recombination of N
2 and O2 giving NO
2−1−1
f2 p
K4 = · ⇒ f = (K4 · a · b)0.5 (14)
a·b p0
• recombination of N
2 and O2 giving NO2
2−1−2
0.5
i2 i2 K5 · a · b2 · p
p p0
K5 = · = · ⇒ i = (15)
a · b2 p0 a · b2 p p0
The Eqs. (7 to 15) could be solved if there are known the flue gases temperature, T
fg, in the flow section “2”
and the excess air, x, in the flow section “1”.
The energy balance gives the extra dependence between unknown mole composition of flue gases leaving
FHDS and T fg and x.
Scientific Reports | (2021) 11:6176 | https://doi.org/10.1038/s41598-021-85244-z 9
Vol.:(0123456789)www.nature.com/scientificreports/
hf0,O2 hf0,N2 hf0,H2 hf0,CO hf0,CO2 hf0,NO hf0,NO2 hf0,OH hf0,H2O
[kJ/kmole] [kJ/kmole] [kJ/kmole] [kJ/kmole] [kJ/kmole] [kJ/kmole] [kJ/kmole] [kJ/kmole] [kJ/kmole]
0 0 0 − 110,527 − 393,522 + 90,291 + 33,100 + 38,897 − 285,830
Table 7. The enthalpy of formation of chemical species in the flow sections “2”. p0 = p1 = p2 = 0.8 MPa,
T0 = T1 = 298 K, T2 = Tfg, 37–43.
iNO2
x Tfg eCO fNO gH2 hOH [kmole/kmole
[kmole/kmole fuel] [K] [kmole/kmole fuel] [kmole/kmole fuel] [kmole/kmole fuel] [kmole/kmole fuel] fuel]
10.425 500 7.417*10−27 5.505*10−8 1.937*10−25 4.548*10−15 1.0211*10−5
−11 −4 −11 −7
2.0625 1000 1.0657*10 6.665*10 1.3063*10 3.907*10 4.88*10−5
−9 −3 −9 −6
1.3175 1200 3.822*10 2.841*10 2.376*10 9.031*10 5.16*10−5
−7 −3 −7 −5
0.855 1400 2.668*10 7.469*10 1.049*10 8.295*10 4.7472*10−5
0.547 1600 6.796*10−6 1.4379*10−2 1.9308*10−6 4.243*10−4 3.914*10−5
0.3345 1800 9.024*10−5 2.211*10−2 2.0188*10−5 1.453*10−3 2.891*10−5
0.1835 2000 1.226*10−4 1.531*10−2 2.746*10−5 1.245*10−3 1.471*10−5
0.0765 2200 5.607*10−3 2.756*10−2 1.07*10−3 7.654*10−3 8.304*10−6
Table 8. The mole composition of flue gases function of temperature T
fg, flow section “2”. p2 = 0.8 MPa.
iNO2
x Tfg eCO fNO gH2 hOH [kmole/kmole
[kmole/kmole fuel] [K] [kmole/kmole fuel] [kmole/kmole fuel] [kmole/kmole fuel] [kmole/kmole fuel] fuel]
10.425 500 2.098*10−26 5.505*10−8 5.479*10−25 7.649*10−15 2.888*10−5
−11 −4 −11 −7
2.0625 1000 3.014*10 6.665*10 3.694*10 6.571*10 1.38*10−4
−8 −3 −9 −5
1.3175 1200 1.081*10 2.840*10 6.720*10 1.518*10 1.459*10−4
−7 −3 −7 −4
0.855 1400 7.547*10 7.47*10 2.967*10 1.395*10 1.343*10−4
−5 −2 −6 −4
0.5472 1600 1.922*10 1.438*10 5.461*10 7.136*10 1.107*10−4
−4 −2 −5 −3
0.3335 1800 2.557*10 2.205*10 5.704*10 2.437*10 8.136*10−5
−4 −2 −5 −3
0.1825 2000 3.461*10 1.532*10 7.756*10 2.095*10 4.168*10−5
0.0670 2200 1.652*10−2 2.636*10−2 2.679*10−3 1.162*10−2 2.157*10−5
Table 9. The mole composition of flue gases function of temperature T
fg, flow section “2”. p2 = 0.1 MPa.
Tfg Tfg
Tfg
Tfg
a· cp,N2 · dT + b · cp,O2 · dT + c · h0f ,CO2 + cp,CO2 · dT + d · h0f ,H2O + cp,H2O · dT
T0 T0 T0 T0
Tfg
Tfg
Tfg
h0f ,CO h0f ,NO
+e· + cp,CO · dT +f · + cp,NO · dT + g + 0.5 · h · cp,H2 · dT
T0 T0 T0
Tfg
Tfg
+ h · h0f ,OH + cp,OH · dT + i · h0f ,NO2 + cp,NO2 · dT − yCO2 · h0f ,CO2 − zH2O · h0f ,H2O = |HHV |
T0 T0
(16)
The specific heat capacities, c p, were approximated by polynomial dependences on temperature. The enthalpy
of formation of new chemical species is included in the Table 7.
Because the Eqs. (7 to 15) includes large quantities, i.e. a, b, c, d, and small, very small or negligible quantities,
i.e. e, f, g, h, i, the computational procedure starts with Eqs. (11 to 16) in which the temperature Tfg was imposed
and supposed that a ≃ rN2, b ≃ rO2, c ≃ yCO2 and d ≃ zH2O. The preliminary evaluation of e, f, g, h and i allows the
first evaluation of a, b, c and d through Eqs. (7 to 10) followed by a preliminary evaluation of excess air through
Eq. (16). Knowing the first values of all chemical species and x, the next step re-uses the Eqs. (7 to 15) and after
those Eqs. (11 to 15, 16). The iterative procedure is finished when the imposed error between two successive
iterations is reached. The numerical results are included in the Tables 8 and 9.
Tables 8 and 9 present the main combustion noxious emissions, i.e. CO, NO and NO2 calculated using the
chemical modeling algorithm at different temperatures, pressure and excess of air/oxygen. The emission levels
calculated using the model had in most cases the same variation trend. For example, at high excess of air/oxygen
and low temperature the emission of CO, NO and N O2 calculated have the minimum values. This result was
expected, as the combustion process was performed under conditions of high oxygen excess that maximize
the formation of complete combustion products. Opposite, at low air/oxygen excess and high temperature, the
Scientific Reports | (2021) 11:6176 | https://doi.org/10.1038/s41598-021-85244-z 10
Vol:.(1234567890)www.nature.com/scientificreports/
combustion noxious emission presents maximum values, but in most cases, above the legal limit. However,
emissions under hydrotreating conditions should not be compared with proposals within legal limits, since these
limits refer mainly to combustion conditions with excess air 44. The gaseous fraction resulted from hydrotreat-
ing experiments contains a high amount of unreacted hydrogen. In conclusion, the developed model allows the
evaluation of harmful emissions depending on the temperature and pressure set on the flue gases. This calculation
algorithm can be applied to any pressurized or atmospheric combustion engine fueled with different mixture of
combustible gases such as: natural gas, hydrogen-enriched natural gas or oxy-fuel.
Conclusions
CoMo/γ-Al2O3-HMS catalyst was tested in the hydrotreating process of pyrolysis bio-oil. Based on the presented
results at mild conditions of 320 °C and 40 bar, the catalyst is very active in the hydrotreating process leading
to a decrease of total acid number of hydrotreated bio-oil with almost 89% and bio-oil conversion of 87.23%. In
addition, in order to evaluate the harmful emissions resulted from combustion of gaseous phase obtained in the
hydrotreating process a chemical modeling algorithm was developed.
Methods
Catalyst characterization. The surface area, pore volume and mean pore diameter of the catalyst width
was calculated by the Brunauer-Emmet-Teller (BET) method. The nitrogen sorption measurements were carried
out at 77 K using a Nova 1000 Quantachrome instrument. Prior to analysis, the samples were heated to 200 °C
for 1 h. The X-ray diffraction (XRD) analysis was carried out using a fully automated, modular Rigaku Smart
Labdiffractometer, operated at 45 kV and 200 mA, with Cu Kα radiation (1.54059 Ǻ), parallel beam configura-
tion (2θ/θ scan mode) and scanning range between 2–90° (2θ), with a 0.02° step. Fourier transform infrared
(FT-IR) analysis was performed with a FT-IR Tensor 27—Bruker spectrometer, using KBr pellet technique 45.
Scanning Electron Microscopy (SEM) analysis was conducted using a FEI Inspect, S model microscope. The
X-Ray Photoelectron Spectroscopy (XPS) spectra were obtained on a SPECS spectrometer by using the Al anode
(1486.6 eV) radiation. The pyridine-adsorbed FT-IR spectrum was recorded using Jasco 610 spectrometer, with
a scanning range from 4000 to 400 cm−1, a scan rate of 4 cm-1·s-1 and an average of 64 measurements in the final
spectrum. The total number of acidic sites (sites/m2) was measured by temperature programmed desorption of
pyridine (TPD-pyridine) as described by using a TGA Q5000 v3.13 from TA Instruments, USA For the TPD-
pyridine profile as described by using TGA Q5000 v3.13 from TA Instruments, USA.
Experimental part
Catalyst preparation. The HMS material was synthesized via templating pathway using tetraethylortho-
silicate (TEOS) as silica source and dodecylamine (DDA, Merck) as template and ethanol (EtOH) and water as
solvents. Tetraethylorthosilicate (TEOS) was added to a mixture of dodecylamine (DDA), water and ethanol at
room temperature. The mixture was stirred for 1 h at 40 °C and then let for 24 h at 25 °C. The molar composi-
tion of the material was 1.0 S iO2: 0.27 DDA: 8.5 EtOH: 29 H 2O. The solid was filtered, washed, dried at room
temperature and calcined in air at 550 °C for 8 h (1 °C/min), to remove the template. The γ-Al2O3-HMS support
was obtained as cylindrical extrudates with the average size of 2 mm. The powdered materials (γ-Al2O3/HMS:
40/60) were mixed with a 10% (wt%) H NO3 solution gradually dosed for 1 h. After dosing the nitric acid, stir-
ring is continued for 3 h at ambient temperature. The resulted homogeneous paste is inserted into a manually
operated extruder with interchangeable diameters, the diameter of a die having the size of 1 mm. The resulted
catalyst were dried for 6 h at 160 °C and annealed at 450 °C (10 °C/min). The molybdenum (8%) and cobalt (4%)
catalyst was prepared by incipient wetness impregnation method using appropriate concentrations of aque-
ous solutions of ammonium heptamolybdate ((NH4)6Mo7O24, Aldrich 99%) and cobalt (II) nitrate hexahydrate
(Co(NO3)2·6H2O), Aldrich 98%). After impregnation on γ-Al2O3-HMS support the wet cylinders were dried at
120 °C for 4 h and calcined at 450 °C for 2 h.
Catalytic tests. The activity tests of 4%Co8%Mo/ɤ-Al2O3-HMS catalyst were carried out in a fixed bed flow
reactor (length of 0.5 m, volume of 200 cm3) heated by an electrical furnace. An amount of 50 cm3 catalyst was
loaded in the middle zone of the reactor. The catalyst was activated in situ with a flow rate of 15 L/h hydrogen at
450 °C for 6 h. The bio-oil used in this report was obtained by pyrolysis of biomass derivate from biogas process
and conditioned with waste vegetable oil at 425 °C 46. Bio-oil was introduced into the reactor using a metering
pump, mixed with H2, and preheated to a desired temperature. The liquid samples were analyzed by GC/MS
7000 Triple Quad MS (Agilent Technologies) system equipped with HP-FFAP (30 m, 250 μm, 0.25 μm) column
and He as carrier gas with volumetric flow of 1 ml/min. The oven program started from 30 °C with 2 °C/min
rate and until reached 100 °C. The injector temperature was set at 250 °C. The compounds were identified using
NIST MS Search 2.0 Library. The water content in the samples was determined by Karl Fischer method (ASTM
D6869). Density, total acid number and saponification number were determined using standardized methods 47.
The gaseous fraction generated during the experiments was analyzed using a Agilent Technologies 6890 N
Gas-Chromatograph with a Thermal Conductivity Detector (TCD), connected on-line, equipped with a SHIN-
CARBON ST 80/100 2 M, 2 M ID,1/8"OD, SILCO, HP column and He as carrier gas with volumetric flow of
50 mL/min. The column temperature was set up to 40 °C (hold time) 300 °C, program rate: 20 °C/min, injection
temperature: 300 °C, detector temperature 300 °C, sample volume: 0.75 mL.
The product yields in were calculated using the following equations:
Scientific Reports | (2021) 11:6176 | https://doi.org/10.1038/s41598-021-85244-z 11
Vol.:(0123456789)www.nature.com/scientificreports/
xi ·M oil
Mi
ηi (%) = · 100
( ni=1 xi ·M oil
Mi ) + xunreacted
where, Moil -average molecular weight of the bio-oil, X
i-mass fraction of the component I, M
i-molecular weight
of component i
n
Conversion(%) = ηi (%)
i=1
Received: 3 December 2020; Accepted: 26 February 2021
References
1. Wiśniewski, D., Gołaszewski, J. & Białowiec, A. The pyrolysis and gasification of digestate from agricultural biogas plant. Arch.
Environ. Prot. 41, 70–75 (2015).
2. Hosseini Koupaie, E., Azizi, A., Bazyar Lakeh, A. A., Hafez, H. & Elbeshbishy, E. Comparison of liquid and dewatered digestate
as inoculum for anaerobic digestion of organic solid wastes. Waste Manag. 87, 228–236 (2019).
3. Jung-Hun, K. et al. CO2-assisted catalytic pyrolysis of digestate with steel slag. Energy 191, 116529 (2020).
4. Horácˇek, J. & Kubicˇka, D. Bio-oil hydrotreating over conventional CoMo&NiMo catalysts: The role of reaction conditions and
additives. Fuel 198, 49–57 (2017).
5. Vituruch, G., Boonyawan, Y., Tanakorn, R. & Sabaithip, T. Hydrotreating of free fatty acid and bio-oil model compounds: effect
of catalyst support. Energy Proc. 79, 486–491 (2015).
6. Botella, L. et al. Bio-oil hydrotreatment for enhancing solubility in biodiesel and the oxydation stability of resulting blends. Front.
Chem. 6(83), 1–13 (2018).
7. Wang, H. et al. Performance and techno-economic evaluations of co-processing residual heavy fraction in bio-oil hydrotreating (Catal,
Today, 2020) (in press).
8. French, R. J., Hrdlicka, J. & Baldwina, R. Mild hydrotreating of biomass pyrolysis oils to produce a suitable refinery feedstock.
Environ. Prog. Sustain. 29, 142–150 (2010).
9. Wildschut, J., Melián-Cabrera, I. & Heeres, H. J. Catalyst studies on the hydrotreatment of fast pyrolysis oil. Appl. Catal. B-Environ.
99, 298–306 (2010).
10. Cai, Q., Yu, T., Meng, X. & Zhang, S. Selective generation of aromatic hydrocarbons from hydrotreating-cracking of bio-oil light
fraction with MOx modified HZSM-5 (M = Ga, Mo and Zn). Fuel Process. 204, 106424 (2020).
11. Wildschut, J., Mahfud, F. H., Venderbosch, R. H. & Heeres, H. J. Hydrotreatment of fast pyrolysis oil using heterogeneous noble-
metal catalysts. Ind. Eng. Chem. Res. 48, 10324–10334 (2009).
12. Mendes, F.L., Teixeira da Silva, V., Pacheco, M.E., Toniolo, F.S., Henriques, C.A. Bio-oil hydrotreating using nickel phosphides
supported on carbon-covered alumina. Fuel. 241, 686–694, (2019).
13. Jin, W. et al. Catalytic upgrading of biomass model compounds: novel approaches and lessons learnt from traditional hydrode-
oxygenation: a review. ChemCatChem 11, 924–960 (2019).
14. Zhong-Yu, J., Zhang, T.-Q., Shang, J.-W., Zhai, M.-Lu, Yang, H., Qiao, C.-Z., Ma X.-Q. Influence of Cu and Mo components of
ɤ-Al2O3 supported nickel catalysts on hydrodeoxygenation of fatty acidmethyl esters to fuel-like hydrocarbons. J. Fuel Chem.
Technol. 46(4), 427–440, (2018).
15. Ranga, C., Alexiadis, V. I., Lauwaert, J., Lødeng, R. & Thybaut, J. W. Effect of Co incorporation and support selection on deoxy-
genation selectivity and stability of (Co)Mo catalysts in anisole HDO. Appl. Catal. A Gener. 571, 61–70 (2019).
16. Schmitt, C. C. et al. Hydrotreatment of fast pyrolysis bio-oil fractions over nickel-based catalyst. Top. Catal. 61, 1769–1782 (2018).
17. Mora-Vergara, D., Moscoso, L. H., Gaigneaux, E. M., Giraldo, S. A. & Baldovino-Medrano, V. G. Hydrodeoxygenation of guaiacol
using NiMo and CoMo catalysts supported on alumina modified with potassium. Catal. Today. 302, 125–135 (2018).
18. Prasomsri, T., Shetty, M., Murugappan, K. & Román-Leshkov, Y. Insights into the catalytic activity and surface modification of
MoO3 during the hydrodeoxygenation of lignin-derived model compounds into aromatic hydrocarbons under low hydrogen
pressures. Energy Environ. Sci. 7(8), 2660–2669 (2014).
19. Li, Y. et al. Coke deposition on Ni/HZSM-5 in bio-oil hydrodeoxygenation processing. Energy Fuels. 29, 1722–1728 (2015).
20. Kadarwati, S. et al. Coke formation during the hydrotreatment of bio-oil using NiMo and CoMo catalysts. Fuel Process. Technol.
155, 261–268 (2017).
21. Yoosuk, B., Sanggam, P., Wiengket, S. & Prasassarakich, P. Hydrodeoxygenation of oleic acid and palmitic acid to hydrocarbon-like
biofuel over unsupported Ni-Mo and Co-Mo sulfide catalysts. Renew. Energy. 139, 1391–1399 (2019).
22. Ropero-Vega, J.L., Aldana-Pérez, A., Gómez, R., Ni˜no-Gómez, M.E. Sulfated titania [TiO2/SO42−]: a very active solid acid catalyst
for the esterification of free fatty acids with ethanol. Appl. Catal. A Gener. 379(1–2), 24–29, (2010).
23. Palcheva, R. et al. NiMo catalysts supported on the Nb modified mesoporous SBA-15 and HMS: effect of thioglycolic acid addition
on HDS. Appl. Catal. A: Gen. 520, 24–34 (2016).
24. Yazici D. T., Bilgic, C. Surf. Interface Anal. Determining the surface acidic propertiesof solid catalysts by amine titration using-
Hammett indicators and FTIR-pyridineadsorption methods. 42, 959–962, (2010).
25. Barzetti, T., Selli, E., Moscotti, D. & Forni, L. Pyridine and ammonia as probes for FTIR analysis of solid acid catalysts. J. Chem.
Soc. Faraday Trans. 92(8), 1401–1407 (1996).
26. Osman, A. I. et al. Effect of precursor on the performance of alumina for the dehydration of methanol to dimethyl ether. Appl.
Catal. B Environ. 127, 307–315 (2012).
27. NIST Standard Reference Database 20, Version 4.1. https://srdata.nist.gov/xps/.
28. Zepeda, T.A, Pawelec, B., Obeso-Estrella, R., Díaz de León, J.N, Fuentes S, Alonso-Núñez, G., et al. Competitive HDS and HDN
reactions over NiMoS/HMS-Al catalysts: Diminishing of the inhibition of HDS reaction by support modification with P. Appl.
Catal. B: Environ. 180, 569–579 (2016).
29. Ganta, D., Sinha, S. & Haasch, R. T. 2-D material molybdenum disulfide analyzed by XPS. Surf. Sci. Spectra 21, 19–27 (2014).
30. Yang, J., Liu, H., Martens, W. N. & Frost, R. L. Synthesis and characterization of cobalt hydroxide, cobalt oxyhydroxide, and cobalt
oxide nanodiscs. J. Phys. Chem. C. 114, 111–119 (2010).
31. Turner, N. H. & Single, A. M. Determination of peak positions and areas from wide-scan XPS spectra. Surf. Interface Anal. 15,
215–222 (1990).
Scientific Reports | (2021) 11:6176 | https://doi.org/10.1038/s41598-021-85244-z 12
Vol:.(1234567890)www.nature.com/scientificreports/
32. Zafeiratos, S. et al. Methanol oxidation over model cobalt catalysts: Influence of the cobalt oxidation state on the reactivity. J. Catal.
269, 309–317 (2010).
33. Mosallanejad, A., Taghvaei, H., Mirsoleimani-Azizi, S. M., Mohammadi, A. & Rahimpour, M. R. Chem. Eng. Res. Des. 121, 113–124
(2017).
34. Zerva, C., Karakoulia, S.A., Kalogiannis, K.G., Margellou, A., Iliopoulou, E.F., Lappas, A.A., Papayannakos, N, Triantafyllidis, K.S.
Hydrodeoxygenation of phenol and biomass fast pyrolysis oil (bio-oil) over Ni/WO3-ZrO2 catalyst. Catal. Today. 2020, in Press.
35. Oh, S., Lee, J. H. & Choi, J. W. Hydrodeoxygenation of crude bio-oil with various metal catalysts in a continuous-flow reactor and
evaluation of emulsion properties of upgraded bio-oil with petroleum fuel. Renew. Energy. 160, 1160–1167 (2020).
36. Yang, Y., Wang, Q., Zhang, X., Wang, L. & Li, G. Hydrotreating of C18 fatty acids to hydrocarbons on sulphided NiW/SiO2-Al2O3.
Fuel Process. Technol. 116, 165–174 (2013).
37. Borgnakke, C., Sonntag , R.E., Fundamentals of Thermodynamics, 8th Edition, John Wiley & Sons, 2013.
38. Ruscic, B. et al. Introduction to active thermochemical tables: several “key” enthalpies of formation revisited. J. Phys. Chem. A
108, 9979–9997 (2004).
39. Ruscic, B. et al. Active thermochemical tables: thermochemistry for the 21st century. J. Phys. Conf. Ser. 16, 561–570 (2005).
40. Ruscic, B. Active Thermochemical Tables (ATcT) values based on ver. 1.118 of the Thermochemical Network (2015); available at
ATcT.anl.gov
41. Ruscic, B. Active thermochemical tables: dissociation energies of several homonuclear first-row diatomics and related thermo-
chemical values. Theor. Chem. Acc. 133, 1415/1–12 (2005)
42. Klippenstein, S. J., Harding, L. B., B. Ruscic, Ab initio computations and active thermochemical tables hand in hand: heats of
formation of core combustion species. J. Phys. Chem. A 121, 35, 6580–6602 (2017).
43. Horbaniuc, B., Marin, O., Dumitrascu, G. & Charon, O. Oxygen enriched combustion in supercritical steam boilers. Energy 29,
427–448 (2004).
44. Conesa, J. A., Ortuño, N. & Palmer, D. Estimation of industrial emissions during pyrolysis and combustion of different wastes
using laboratory data. Sci Rep 10, 6750 (2020).
45. Enascuta, C.-E. et al. Simultaneous production of oil enriched in ω-3 polyunsaturated fatty acids and biodiesel from fish wastes.
J. Waste Manag. 75, 205–214 (2018).
46. Doukeh, R., Bombos, M., Bombos,D., Vasilievici, G., Radu E., Oprescu, E-E. Pyrolysis of digestate from anaerobic digestion on
tungsten oxide catalyst. Reaction Kinetics, Mechanisms and Catalysis. 2021, in press. https://doi.org/10.1007/s11144-021-01952
-7.
47. Iisa, K., French, R. J., Orton, K. A., Dutta, A. & Schaidle, J. A. Production of low-oxygen bio-oil via ex situ catalytic fast pyrolysis
and hydrotreating. Fuel 207, 413–422 (2017).
Acknowledgements
The authors gratefully acknowledge the financial support of the UEFISCDI, Romania, in the framework of PN-
III-P1-1.2-PCCDI-2017, financing contract no. 32 PCCDI/2018.
Author contributions
C.C. and E.-E.O. wrote the draft of the manuscript. R.D. and M.B. prepared catalyst and performed the experi-
ments. G.V. characterised the catalytic properties. D.B and G.D developed the chemical modeling algorithm.
All authors provided revisions to the manuscript and approved the final version.
Competing interests
The authors declare no competing interests.
Additional information
Supplementary Information The online version contains supplementary material available at https://doi.
org/10.1038/s41598-021-85244-z.
Correspondence and requests for materials should be addressed to E.-E.O. or C.C.
Reprints and permissions information is available at www.nature.com/reprints.
Publisher’s note Springer Nature remains neutral with regard to jurisdictional claims in published maps and
institutional affiliations.
Open Access This article is licensed under a Creative Commons Attribution 4.0 International
License, which permits use, sharing, adaptation, distribution and reproduction in any medium or
format, as long as you give appropriate credit to the original author(s) and the source, provide a link to the
Creative Commons licence, and indicate if changes were made. The images or other third party material in this
article are included in the article’s Creative Commons licence, unless indicated otherwise in a credit line to the
material. If material is not included in the article’s Creative Commons licence and your intended use is not
permitted by statutory regulation or exceeds the permitted use, you will need to obtain permission directly from
the copyright holder. To view a copy of this licence, visit http://creativecommons.org/licenses/by/4.0/.
© The Author(s) 2021
Scientific Reports | (2021) 11:6176 | https://doi.org/10.1038/s41598-021-85244-z 13
Vol.:(0123456789)You can also read