Electrodynamics of quantum spin liquids
←
→
Page content transcription
If your browser does not render page correctly, please read the page content below
Electrodynamics of quantum spin liquids
arXiv:1804.10702v1 [cond-mat.str-el] 27 Apr 2018

                                                           Martin Dressel and Andrej Pustogow
                                                           1. Physikalisches Institut, Universität Stuttgart, Pfaffenwaldring 57, 70550 Stuttgart,
                                                           Germany

                                                           Abstract. Quantum spin liquids attract great interest due to their exceptional
                                                           magnetic properties characterized by the absence of long-range order down to low
                                                           temperatures despite the strong magnetic interaction. Commonly, these compounds
                                                           are strongly correlated electron systems, and their electrodynamic response is
                                                           governed by the Mott gap in the excitation spectrum.                Here we summarize
                                                           and discuss the optical properties of several two-dimensional quantum spin liquid
                                                           candidates. First we consider the inorganic material Herbertsmithite ZnCu3 (OH)6 Cl2
                                                           and related compounds, which crystallize in a kagome lattice. Then we turn to
                                                           the organic compounds β ′ -EtMe3 Sb[Pd(dmit)2 ]2 , κ-(BEDT-TTF)2 Ag2 (CN)3 and κ-
                                                           (BEDT-TTF)2 Cu2 (CN)3 , where the spins are arranged in an almost perfect triangular
                                                           lattice, leading to strong frustration. Due to differences in bandwidth, the effective
                                                           correlation strength varies over a wide range, leading to a rather distinct behavior as far
                                                           as the electrodynamic properties are concerned. We discuss the spinon contributions to
                                                           the optical conductivity in comparison to metallic quantum fluctuations in the vicinity
                                                           of the Mott transition.

                                                           PACS numbers: 75.10.Kt, 75.10.Jm, 71.30.+h, 74.25.Gz, 74.70.Kn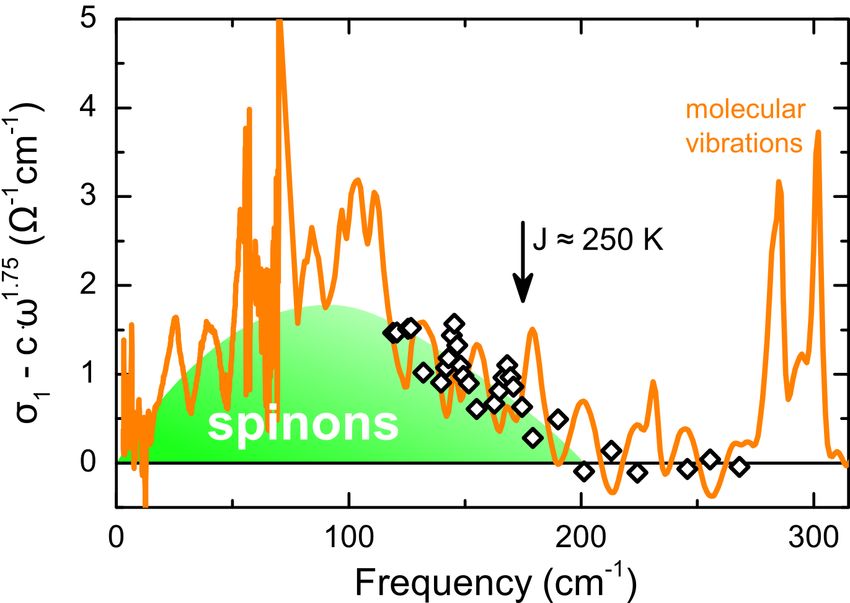
Electrodynamics of quantum spin liquids                                                              2

1. Introduction

The pioneering work on geometrical frustration dates back to the 1920s, when Pauling
[1] realized that the hydrogen bonds between H2 O molecules in ice can be allocated in
multiple ways. Any given oxygen atom in water ice is situated at the vertex of a diamond
lattice and has four nearest-neighbor oxygen atoms, each connected via an intermediate
proton. According to the ice rule, the lowest energy state has two protons positioned
close to the oxygen and two protons positioned farther away, forming a “two-in two-
out” state. Although these considerations dealt with electric dipoles, Anderson [2, 3, 4]
mapped them to a spin model possessing an extensive degeneracy of states. Two-
dimensional arrangements and many generalizations have been studied subsequently
[5, 6, 7, 8, 9].
     These so-called resonating-valence-bond (RVB) states do not feature any long-range
magnetic order or broken lattice symmetries, but are believed to exhibit non-local,
topological order [10]. They can be considered as variational ground states constituted
of only the shortest possible valence bonds (singlets), with equal weights for all bond
configurations. While the formation of a valence bond implies a gap to excite those two
spins, long-range valence bonds are more weakly bound and thus a gapless spectrum
is possible in spin- 12 systems. It was suggested that such states can be described by
gauge theories and these gauge excitations should be visible in the spectrum [11]. In
his seminal paper of 1987 Anderson applied the idea of resonating valence bonds to
high-temperature superconductivity in cuprates [12, 13, 14].
     Pure dipolar interaction has been realized in fermionic and bosonic quantum gases,
where large magnetic moments provide the dominant interaction [15, 16] in the absence
of any other force. In solids, however, exchange and Ruderman-Kittel-Kasuya-Yosida
(RKKY) interactions are of superior importance [17, 18], and there are only few
examples of mainly dipolar lattices, such as isolated water molecules in nano-pores
[19, 20].

             a                          b                       c

                 Figure 1. Two-dimensional lattice structures with a high degree of frustration. (a)
                 Triangular lattice, (b) kagome lattice, and (c) hexagonal lattice, where the number of
                 neighbors is reduced from z = 6, to 4 and down to 3.

     While in chains, rectangular and cubic lattices the alternating formation of dipoles
can be easily obtained, geometrical frustration becomes an issue in triangular, hexagonal,
kagome and hyper-kagome lattices or tetragonal structures, for instance (figure 1). The
situation is more intriguing in the case of quantum spin systems when geometrical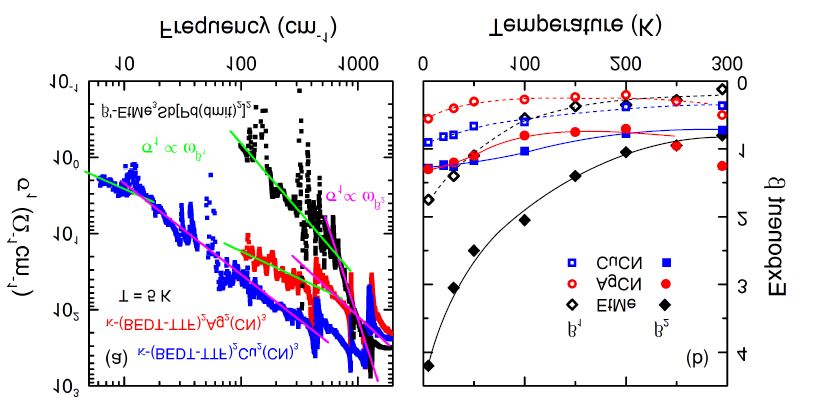
Electrodynamics of quantum spin liquids                                                 3

frustration and quantum fluctuations may prohibit the formation of long-range order
even at the lowest temperatures. In these cases liquid-like ground states are expected,
and the numerous investigations of quantum spin liquids and spin ice reflect these efforts
[21, 22, 11, 23].
     It took decades before the theoretical concept of quantum spin liquids was actually
realized in solids, first in the organic compound κ-(BEDT-TTF)2 Cu2 (CN)3 , which
crystallizes in a triangular pattern [24, 25], and later in the kagome lattice of ZnCu3 -
(OH)6 Cl2 , [26, 27, 28]. Recently, three-dimensional pyrochlore materials, such as
A2 B2 O7 with A = Pr or Ho and B = Hf, Ti, Zr, etc., have been discussed as
possible quantum spin liquids with frustration and disorder of superior importance
[21, 22, 11, 29]. Still there is a lack of direct experimental confirmation, and also
the theoretical description of real systems is unsatisfactory; by now the nature of the
spin liquid state must be considered as rather unclear. Is the presence of geometrical
frustration sufficient to realize a spin liquid? What is the influence of disorder, always
present in actual materials? These compounds constitute layered structures, but how
important is the coupling to the third dimension? Naturally, quantum spin liquids are
mainly considered from the magnetic point of view and the present status is summarized
in several recent reviews [11, 23, 30, 31, 32]. But how does the electronic degree of
freedom is affected by the formation of a quantum spin liquid? Is it caused by the
coupling of spin and charge degrees of freedom, or is it due to geometrical frustation
and inherent disorder? Here we want to focus on the electrodynamic properties of
two-dimensional quantum spin liquids and review the experimental facts observed by
now.

2. Herbertsmithite

Among the inorganic spin-liquid candidates, the rhombohedral Herbertsmithite
ZnCu3 (OH)6 Cl2 scored highest in popularity. As depicted in figure 2, the copper ions
form an almost perfect S = 21 kagome lattice [26], i.e. corner sharing triangles in
the plane with strong antiferromagnetic superexchange J of approximately 200 K. No
magnetic order is detected all the way down to T = 50 mK [27, 28]. Among the transition
metal oxides also other candidates such as the Vésigniéite BaCu3 V2 O8 (OH)2 [33] and
Volborthite Cu3 V2 O7 (OH)2 · 2H2 O [34, 35], and also the hyper-kagome Na4 Ir3 O8 [36]
or PbCuTe2 O6 [37] have come under scrutiny. Still the Zn substituted Cu4 (OH)6 Cl2
remains the prime candidate for a quantum spin liquid. Specific heat and inelastic
neutron scattering experiments did not find indications of a spin gap separating S = 0
and S = 1 down to 0.1 meV, inferring that the spin excitations form a continuum
[28, 38, 39, 40, 41]. This important issue, however, is far from being settled, neither
from the experimental nor from the theoretical side [42, 43, 44, 45, 46, 47]. Among
other suggestions [48, 10, 49, 50, 51], it was proposed that a gapless U(1) spin-liquid
state forms with a spinon Fermi surface and with a Dirac-fermion excitation spectrum
of the kagome lattice [52, 53].
Electrodynamics of quantum spin liquids 4
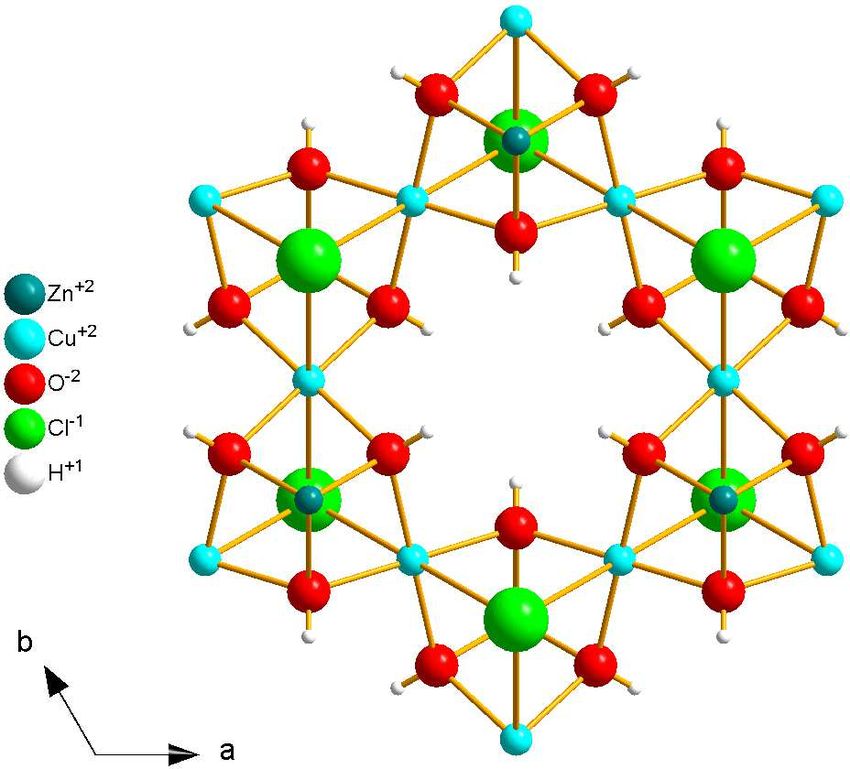
Figure 2. The crystal structure of ZnCu3 (OH)6 Cl2 exhibits the characteristic kagome
arrangement of the Cu atoms (cyan) linked by superexchange.
As far as the charge degrees of freedom are concerned, Herbertsmithite exhibits
anisotropic electronic properties due to its layered structure. The strong Coulomb
repulsion U ≈ 7 to 8 eV [54] makes them clear-cut insulators with vanishing electronic
conduction in all directions up to room temperature. Optical transmission and
reflection measurements reveal a charge-transfer band around 3.3 eV, corresponding
to 26 600 cm−1 ; between 1 and 2 eV pronounced d-d transitions have been identified in
good agreement with simple LDA calculations, i.e. local density approximation without
electronic correlations considered [55, 54].
At lower frequencies pronounced phonon features can be detected [56, 57], as
illustrated in figure 3. From the 54 lattice phonons the ten Eu modes are infrared
active for light polarized within the ab-plane and seven A2u modes for the polarization
E k c. At low temperatures, an anomalous broadening of the low-frequency phonons
is observed. Sushkov et al. suggested that magnetic fluctuations in the spin-liquid
state might couple to the phonons [56]. This is most pronounced in the low-frequency
vibration at 115 cm−1 , which involves the Cl− and Zn2+ ions leading to a deformation of
the kagome layer [57]. Raman studies reveal seven phonon modes in the corresponding
spectral range [58, 59]. More interestingly, however, is the broad continuum attributed to
scattering on magnetic excitations. When the temperature is reduced, the quasi-elastic
scattering intensity decreases linearly in contrast to the exponential drop expected for
a spin gap [58].
In general, optical experiments are not sensitive to spinon excitations; based on a
U(1) gauge theory of the Hubbard model, Lee and collaborators [60] suggested, however,
that the spin excitations in a quantum spin liquid may exhibit a Fermi surface and may
also contribute to the optical conductivity [61, 62, 47] and the magneto-optical Faraday
effect [63]. Hence, investigations of the electrodynamic behavior could help to establish
the spin-liquid ground state and elucidate the low-energy elementary excitations.
As seen in figure 3, besides the vibrational features no charge excitations can
be observed in the infrared spectral range, due to the large Hubbard U. First THzElectrodynamics of quantum spin liquids 5
Figure 3. Room-temperature optical conductivity σ(ω) of ZnCu3 (OH)6 Cl2 measured
for both polarizations, within the hexagonal ab-plane (blue curve) and perpendicular
to it (red curve). The observed lattice vibrations are in good agreement with the
calculated phonon frequencies depicted above. Data taken from [57].
investigations on ZnCu3 (OH)6 Cl2 were performed by Gedik and collaborators [64]; they
report a power-law behavior of the low-frequency optical conductivity σ(ω) ∝ ω β with an
exponent β = 1.4 in a limited spectral range (figure 4). At 1.3 THz it crosses over to the
tail of the rather strong low-frequency phonon at 90 cm−1 , already seen in figure 3. The
behavior is insensitive to the presence of a magnetic field (B < 7 T), and does not change
significantly when the temperature is raised to 150 K, i.e. well above the regime where
spinon excitations are supposed to be dominant. A final conclusion can only be drawn
when the observation is confirmed or supporting evidence presented. In particular,
experiments at lower frequencies and temperatures are required. The confirmation of
spinon contributions to the optical conductivity smoothly extending down to ω = 0
could be considered as a proof of gapless excitations in kagome materials.
3. Organic Dimerized Mott Compounds
For the molecule-based systems κ-(BEDT-TTF)2 Cu2 (CN)3 [24, 25], κ-(BEDT-TTF)2 -
Ag2 (CN)3 [65, 66], and β ′ -EtMe3 Sb[Pd(dmit)2 ]2 [67, 68] the starting point is rather
similar: here molecular dimers with S = 12 form a highly frustrated triangular
lattice [69, 70, 71] as sketched in figure 5(b). Defining the frustration as the ratio
of transfer integrals t′ and t, the compounds are close to perfect frustration as
summarized in table 1. At ambient pressure, no indication of Néel order is observed for
temperatures as low as 20 mK, despite the considerable antiferromagnetic exchange of
J ≈ 220 − 250 K [24, 65, 67]. The origin of the spin-liquid phase is unresolved since pureElectrodynamics of quantum spin liquids 6
0.3 ZnCu3(OH)6Cl2
σab(Ω-1cm-1)
0.1
0.03
4K
50 K
150 K
0.01
0.6 0.8 1 1.2 1.4 1.6 2
Frequency (THz)
Figure 4. The in-plane optical conductivity σab of ZnCu3 (OH)6 Cl2 measured at
various temperatures as indicated. The spectra consist of a high-frequency component
arising from the phonon resonance at 90 cm−1 , corresponding to about 2.7 THz. At
low-frequencies a power-law dependence on frequency can be identified as σ(ω) ∝ ω 1.4
(dotted line). Redrawn from Ref. [64].
geometrical frustration should not be sufficient to stabilize the quantum spin-liquid state
[72, 73, 74]. From heat capacity measurements on κ-(BEDT-TTF)2 Cu2 (CN)3 , gapless
spin excitations have been concluded [75] in contrast to thermal transport data [76]. The
dispute is not completely resolved. According to Ng and Lee [62], optical studies should
provide important information; if spin excitations in κ-(BEDT-TTF)2 Cu2 (CN)3 exhibit
a Fermi surface, they should show up not only in the thermal conductivity but also
contribute to the optical conductivity [61, 62, 47]. Recently it was revealed, however,
that disorder is intrinsic to κ-(BEDT-TTF)2 Cu2 (CN)3 and κ-(BEDT-TTF)2 Ag2 (CN)3
[77, 66]; this aspect is crucial for understanding the electrodynamic properties of these
materials in general.
Table 1. For different molecular-based quantum spin-liquids compounds on a
triangular lattice with antiferromagnetic coupling J the degree of frustration t′ /t
is given, together with the effective correlations defined as the ratio of inter-dimer
Coulomb repulsion U and bandwidth W ; the power-law exponents are listed for
the lowest temperature, according to equation 2: σ(ω) = σ0 + aω β1 + bω β2 . For
comparison, the respective data for Herbertsmithite are listed, which forms a kagome
lattice [78, 79, 65, 80, 67, 81, 82, 30, 83].
Compound J (meV) t′ /t U/W β1 β2
κ-(BEDT-TTF)2 Cu2 (CN)3 19 0.83 1.52 0.9 1.3
κ-(BEDT-TTF)2 Ag2 (CN)3 19 0.90 1.96 0.6 1.3
β ′ -EtMe3 Sb[Pd(dmit)2 ]2 22 0.90 2.35 1.75 4.2
ZnCu3 (OH)6 Cl2 17 1 5-8 1.4 -
Nakamura et al. [84] report a significant reduction in the low-energy (ν <
700 cm−1 ) Raman-scattering intensity, when the spin-liquid compound κ-(BEDT-Electrodynamics of quantum spin liquids 7
(a) (b)
C C
S S
td
C C
S S
C t‘
C
S S t
C C t
S S c
C C
b
Figure 5. (a) Sketch of the bis-(ethylenedithio)tetrathiafulvalene molecule,
abbreviated BEDT-TTF. (b) For κ-(BEDT-TTF)2 X the molecules are arranged in
dimers, which constitute an anisotropic triangular lattice within the conduction layer.
The inter-dimer transfer integrals are labeled by t and t′ and can be calculated by
tight-binding studies of molecular orbitals or ab-initio calculations [70, 69, 86]. The
intra-dimer transfer integral of κ-(BEDT-TTF)2 Cu2 (CN)3 and κ-(BEDT-TTF)2 Ag2 -
(CN)3 is td ≈ 200 meV and 264 meV, respectively. Approximating the on-site Coulomb
repulsion by U ≈ 2td [87], one obtains at ambient conditions U/t = 7.3 and 10.5 with
the ratio of the two inter-dimer transfer integrals t′ /t ≈ 0.83 and 0.90 very close to
equality [70, 69, 86].
TTF)2 Cu2 (CN)3 is compared to the antiferromagnetic Mott insulator κ-(BEDT-TTF)2 -
Cu[N(CN)2 ]Cl. They assign these to the two-magnon excitation processes. While
in the latter compound phonon anomalies indicate the antiferromagnetic order at
TN = 27 K, the spin liquid compound κ-(BEDT-TTF)2 Cu2 (CN)3 exhibit a change in
the phonon lines around 90 K and a drastic drop in intensity when the compound crosses
over from the thermallyactivated semiconducting (sometimes called “bad metallic”)
to Mott-insulatoring behavior at around 50 K[85], in agreement with comprehensive
electrodynamic and transport studies [83].
3.1. Infrared Properties
In contrast to the completely insulating Herbertsmithite, where the on-site Coulomb
repulsion U is large compared to the hopping integral t, the electron-electron repulsion
for the dimerized charge-transfer salt is significantly lower: U ≈ 0.5 eV. As illustrated
in figure 6, κ-(BEDT-TTF)2 Cu2 (CN)3 is very close to the Mott insulator-to-metal
transition (U ≈ 1.5 W ) [83]; in fact under hydrostatic pressure of only 4 kbar it becomes
superconducting at Tc = 3.6 K [88, 24]. For κ-(BEDT-TTF)2 Ag2 (CN)3 approximately
10 kbar are needed to enter the superconducting state [65]. In figure 7 we display
the infrared conductivity for three organic spin-liquid candidates measured at various
temperatures using light polarized within the highly conducting plane. The overall
shape of σ(ω) is rather similar and dominated by a broad band that peaks around
1700 - 2300 cm−1 , which arises from the electronic transition between the lower and
upper Hubbard bands and is therefore a measure of the effective Coulomb repulsion UElectrodynamics of quantum spin liquids 8
0.5
0.4
Temperature T/W
0.3
Qu Incoherent
a nt Conduction
0.2 um
W Regime
ido
m
Lin
e
0.1
Mott Insulator
Fermi Liquid
0.0
0.0 0.1 0.2 0.3 0.4 0.5 0.6 0.7 0.8 0.9 1.0
Inverse Correlations W/U
Figure 6. Phase diagram of pristine Mott insulators in the absence of magnetic
order. The temperature T and Coulomb repulsion U are normalized by the
bandwidth W extracted from optical spectroscopy. The location of the Herbertsmithite
ZnCu3 (OH)6 Cl2 , and the dimerized Mott insulators β ′ -EtMe3 Sb[Pd(dmit)2 ]2 , κ-(BE-
DT-TTF)2 Ag2 (CN)3 , and κ-(BEDT-TTF)2 Cu2 (CN)3 is estimated from their optical
and transport properties [54, 83]. Since in these quantum spin liquids, magnetic order
is suppressed, the large residual entropy causes a pronounced back-bending of the
quantum Widom line at low temperatures leading to metallic fluctuations in the Mott
state close to the boundary. As the effective correlations decrease further, a metallic
phase forms with Fermi liquid properties.
[89, 90, 91, 92, 93]. The values for U/W extracted from figure 7 are listed in table 1
[83].
Besides these electronic excitations, sharp vibrational features are observed below
1500 cm−1 . In particular for the κ-phase BEDT-TTF salts the Ag intramolecular
vibrations – supposed by be infrared silent – become infrared active by electron-
molecular vibrational (emv) coupling to the charge-transfer excitations. They are shifted
down in frequency with respect to the corresponding Raman modes [94, 95, 96, 97, 98]
and are strongly distorted. Numerical investigations of the electronic ground state and
the molecular and lattice vibrations reveal the importance of the anion network for the
vibrational features extending down to the THz range of frequency [77, 66, 99].
In order to elucidate the low-energy excitations within the Mott gap, the lower
frames in figure 7 enlarge the optical conductivity in the far-infrared spectral range.
The three compounds exhibit a rather different temperature evolution. For β ′ -EtMe3 -
Sb[Pd(dmit)2 ]2 , the compound with strongest effective correlations U/W , a clear Mott
gap opens around 125 K and continuously grows up to 650 cm−1 when the temperatureElectrodynamics of quantum spin liquids 9
Figure 7. Temperature evolution of the optical conductivity of β ′ -EtMe3 Sb-
[Pd(dmit)2 ]2 , κ-(BEDT-TTF)2 Ag2 (CN)3 and κ-(BEDT-TTF)2 Cu2 (CN)3 within the
conducting planes as indicated. (a)-(b) The pronounced band in the mid-infrared
range is associated with the excitation between the Hubbard bands. The peak position
is a measure of the Coulomb repulsion U . The lower panels (d)-(f) enlarge the low
frequency part in order to demonstrate the qualitative differences in the temperature
dependence strongly depending on the position in the phase diagram. While the
optical conductivity σ(ω) decreases upon cooling for the more correlated β ′ -EtMe3 -
Sb[Pd(dmit)2 ]2 and κ-(BEDT-TTF)2 Ag2 (CN)3 , it shows a pronounced non-thermal
enhancement for κ-(BEDT-TTF)2 Cu2 (CN)3 situated most closely to the Mott critical
point. The data are taken from [83] and discussed there in full detail.
is lowered to 5 K. Also κ-(BEDT-TTF)2 Ag2 (CN)3 behaves like a typical insulator, where
the in-gap states are depleted upon cooling [100]. The opposite behavior is found
in the case of κ-(BEDT-TTF)2 Cu2 (CN)3 [figure 7(f)], which exhibits a temperature
dependence characteristic of metals: the low-frequency optical conductivity increases
upon lowering the temperature [101, 102, 103]. The far-infrared spectral weight
of the weakly correlated spin-liquid compound κ-(BEDT-TTF)2 Cu2 (CN)3 increases
significantly for T < 100 K and no clear-cut Mott gap is observed in the optical spectra.
This is unexpected considering that no Drude peak is present – the hallmark of coherent
transport – and that at zero frequency all three compounds – including κ-(BEDT-TTF)2 -
Cu2 (CN)3 – are electrical insulators as determined from dc transport [83].
3.2. κ-(BEDT-TTF)2Cu2 (CN)3
In order to gain more insight into the low-energy dynamics, in figure 8 the conductivity
σ(ω) of κ-(BEDT-TTF)2 Cu2 (CN)3 – as the best studied example of the organic quantum
spin-liquid candidates – is displayed in a wide range of frequencies for both in-planeElectrodynamics of quantum spin liquids 10
polarizations and different temperatures between T = 300 and 10 K. In the kHz and
Figure 8. Overall optical conductivity of κ-(BEDT-TTF)2 Cu2 (CN)3 for the two
polarizations E k b (upper row) and E k c (lower row) for several temperatures as
indicated. The dashed magenta lines are fits by Eq. (1) to connect the two ranges,
extending to a power-law behavior in the THz range. The solid red lines indicate
the high-frequency power law. The inset is an enlargement of the frame in order
to demonstrate the conductivity rise in the MHz range. The data are taken from
[77, 104, 105].
MHz range, hopping conduction is identified as the dominant transport mechanism,
accompanied by a broad dielectric relaxation at lower frequencies that bears typical
fingerprints of relaxor ferroelectricity [106, 104, 107, 108, 77]. For low temperatures,
T < 50 K, we find an appreciable increase in σ(ω) of the high-frequency dielectric
data, which nicely matches the slope observed in the GHz and THz range. The dashed
magenta lines in figure 8 simply interpolate the break in our data by
σ(ω) = σ0 + aω β , (1)
with a temperature-dependent constant σ0 and prefactor a. The exponent β of the
power law is approximately 0.4 and increases to almost 1 when the temperature isElectrodynamics of quantum spin liquids 11
Photon energy (meV)
3
1 10 100 1000 1 10 100 1000 1 10 100 1000 3
10 10
1.04
( ) 1.19 1.34
2 2
10 10
1 1
10 10
0.53
0.67
0.82
cm )
Conductivity (
-1
0 0
10 10
-1
E || b
Conductivity (
-1 -1
10 10
T = 100 K T = 50 K T = 20 K
-1
cm )
1.23
1.17
1.03
2 2
10 10
-1
1 1
10 0.6
0.66
10
0.82
0 0
10 10
E || c
-(BEDT-TTF) Cu (CN)
2 2 3
-1 -1
10 10
0 1 2 3 0 1 2 3 0 1 2 3 4
10 10 10 10 10 10 10 10 10 10 10 10 10
-1 -1 -1
W avenumber (cm ) W avenumber (cm ) W avenumber (cm )
Figure 9. Optical conductivity of κ-(BEDT-TTF)2 Cu2 (CN)3 measured at T = 100,
50, and 20 K for the two crystallographic directions, upper and lower panels as
indicated. The dashed magenta lines correspond to the power-law behavior extending
to low-frequencies, the solid red lines indicate the high-frequency power-laws: σ =
σ0 + aω β1 + bω β2 . The data are taken from [77, 105].
reduced below T = 100 K, as summarized in figure 10(a). It should be noted that
the rise in σ(ω) and the corresponding power-law behavior is already observed above
300 kHz in the low-temperature dielectric data (figure 8). Covering such an extremely
broad spectral range leads to a high confidence in the power-law exponents [105].
Interestingly, in figure 7 we do not observe a gradual filling or closing of the gap in κ-
(BEDT-TTF)2 Cu2 (CN)3 but an increase in the exponent β of the power-law σ(ω) ∝ ω β
as the temperature is reduced. Our robust observation [101, 103] is an unambiguous
signature that these low-energy excitations are of quantum and not of thermal origin.
The opposite behavior is found the case of the antiferromagnetic Mott insulator κ-(BE-
DT-TTF)2 Cu[N(CN)2 ]Cl, where the Mott gap gradually fills as chemical pressure is
applied by Br substitution, leading to a reduction of the effective Coulomb repulsion
U/W [89, 91]. For comparison, pressure-dependent optical studies [109] could show,
that the charge-order gap in α-(BEDT-TTF)2 I3 exhibits a linear suppression of the gap
as the hydrostatic pressure increases.
Similarly intriguing is the change of the power-law behavior in the THz frequency
range. In figure 9 the data of the electrodynamic response of κ-(BEDT-TTF)2 Cu2 (CN)3
are re-plotted on a magnified scale for some selected temperatures. At T = 100 K,
for example, the slope clearly changes around νc = ωc /2πc ≈ 100 cm−1 , where theElectrodynamics of quantum spin liquids 12
Figure 10. (a) Temperature dependence of the power-law exponents σ1 (ω) ∝ ω β of κ-
(BEDT-TTF)2 Cu2 (CN)3 for E k b (solid symbols) and E k c (open symbols). (b) The
crossover frequency ωc between both regimes shifts with temperature corresponding to
h̄ωc ≈ kB T . The error bars (shown only for the c-polarization) indicate the uncertainty
in the power-law fit and the determination of the crossover frequency, respectively.
exponent increases from β = 0.53 to 1.04 for E k b (upper panel) and from 0.60 to 1.03
for E k c (lower panel). This crossover can be identified for all temperatures and both
polarizations [105, 110]. We summarize our finding on κ-(BEDT-TTF)2 Cu2 (CN)3 in
figure 10. It should be noted that the high-frequency slope is not affected by a phonon
tail that obscures the data in the Herbertsmithite [64], as demonstrated in figure 4.
At first glance our findings seem to agree well with the suggestion of Ng and
collaborators [62, 111] that un-gapped spinons at the Fermi surface contribute to
the optical behavior of a quantum spin liquid. They predict a strongly enhanced
conductivity within the Mott gap compared to the two spin wave absorption in a Néel-
ordered insulator. From this point of view, the significant increase in conductivity at low
temperatures could support the conclusion of gapless spin excitations. In addition, the
calculations yield a power-law absorption at low frequencies, i.e. for energies smaller than
the exchange coupling J. For very low energies (h̄ω < kB T ), the optical conductivity
σ(ω) ∝ ω 2 , and for h̄ω > kB T the power law should increase to σ(ω) ∝ ω 3.33 if impurity
scattering was negligible [62]. While we do observe a kind of crossover frequency close
to thermal energy, β1 and β2 are consistently lower by more than a factor of 2. We
want to recall that also for the Herbertsmithite ZnCu3 (OH)6 Cl2 the power-law exponent
extracted in the low-frequency range was only β ≈ 1.4 [64], as displayed in figure 4.
Here we might speculate whether this is influenced by inherent inhomogeneitiesElectrodynamics of quantum spin liquids 13
in the system [27, 28, 66, 77]: when localization effects dominate, the electronic
system behaves like a disordered metal [62] and exhibits the corresponding frequency
dependence [112].
3.3. Metallic Quantum Fluctuations
The corresponding analysis can be conducted for all three quantum-spin liquid
candidates in order to extract the general tendency and unveil the dependence on
the material parameters. In figure 11(a) the frequency-dependent conductivity of
β ′ -EtMe3 Sb[Pd(dmit)2 ]2 , κ-(BEDT-TTF)2 Ag2 (CN)3 und κ-(BEDT-TTF)2 Cu2 (CN)3 is
summarized for the lowest temperature (T = 10 K) measured perpendicular the
respective b-direction. In the double-logarithmic presentation the power-law behavior
σ(ω) = σ0 + aω β1 + bω β2 (2)
becomes obvious with two distinct exponents β1 and β2 ; their temperature evolution is
plotted in figure 11(b). The behavior is qualitatively similar for the polarization E k b,
indicating no significant anisotropy for the in-plane electronic properties, as already seen
from figure 10. Upon cooling, the in-gap states freeze out, the dc conductivity drops,
and the slope enhances correspondingly. For κ-(BEDT-TTF)2 Cu2 (CN)3 and even κ-
(BEDT-TTF)2 Ag2 (CN)3 the temperature dependence is much weaker compared to the
Figure 11. (a) At the smallest accessible temperature, the low-frequency optical
conductivity of the organic spin-liquid Mott insulators can be described by power
laws σ(ω) = σ0 + aω β1 + bω β2 . For all three compounds, β ′ -EtMe3 Sb[Pd(dmit)2 ]2
(E k a, black symbols), κ-(BEDT-TTF)2 Ag2 (CN)3 (E k c, red symbols) and κ-(BE-
DT-TTF)2 Cu2 (CN)3 (E k c, blue symbols), two distinct ranges can be identified:
a smaller exponent at low frequencies with a crossover to about twice the value at
high frequencies. For the systems κ-(BEDT-TTF)2 Ag2 (CN)3 and κ-(BEDT-TTF)2 -
Cu2 (CN)3 the low temperature exponent does not exceed unity at low frequencies,
while it is enhanced to 1.8 in the case of β ′ -EtMe3 Sb[Pd(dmit)2 ]2 . (b) The power-
law exponents β in general increase as the temperature is reduced and the Mott gap
opens upon cooling. This is more pronounced for the strongly correlated β ′ -EtMe3 Sb-
[Pd(dmit)2 ]2 . Data taken from [104, 66, 83]Electrodynamics of quantum spin liquids 14
large changes observed in β ′-EtMe3 Sb[Pd(dmit)2 ]2 , where it resembles the formation
of the Mott gap, similar to the results shown in figure 7. While the high-frequency
exponent reaches a comparable value for κ-(BEDT-TTF)2 Cu2 (CN)3 and κ-(BEDT-
-TTF)2 Ag2 (CN)3 at the lowest temperature (β2 ≈ 1.4), it approaches β2 ≈ 4.5 for
β ′ -EtMe3 Sb[Pd(dmit)2 ]2 .
In a recent theoretical study Dobrosavljević and collaborators [113] concluded that
spinons are not well-defined close to the Mott transition. As soon as the electrons become
delocalized, the spins have to follow the charge movement, which destroys the coherence
of the postulated spinon Fermi surface. Thus spinons do not play a significant role
within the high-temperature quantum critical regime above the Mott point, in contrast
to previous suggestions [60, 114, 115]. In other words, fingerprints of spinon excitations
can only be expected in the optical properties of those spin-liquid compounds, which
are located deep inside the Mott state, making sure that charge response is completely
absent. For the examples of the three organic crystals discussed here, β ′ -EtMe3 Sb-
[Pd(dmit)2 ]2 is the prime candidate to find evidence for spinon contributions to the
conductivity, according to table 1 and figure 6. Even then we have to look at rather
small frequencies and temperatures well below the antiferromagnetic exchange coupling
J ≈ 250 K [67].
4. Spinon Contribution
By performing THz transmission measurements on β ′ -EtMe3 Sb[Pd(dmit)2 ]2 single
crystals of various thicknesses at temperatures as low as 3 K, it was possible to
cover the range down to 3 cm−1 with the required accuracy and directly evaluate the
optical conductivity without any extrapolation [116]. As seen from figure 12 for both
polarizations within the highly plane, an additional absorption process can be identified
that adds to the electronic background [116]. According to figure 11 the underlying
conductivity solely due to charge excitations follows a power law σ1 (ω) ∝ ω 1.75 in the
far-infrared range, crossing over to a steeper slope where the tail of the Mott-Hubbard
band dominates.
Below approximately 200 cm−1 , however, the optical conductivity exceeds the
power-law extrapolation considerably, giving evidence for an additional contribution
to the electrodynamic response. At much lower frequencies, σ1 (ω) gradually levels off
toward the dielectric data [117], comparable to what is plotted in figure 8 for κ-(BEDT-
-TTF)2 Cu2 (CN)3 . The transition regime is consistent with a σ1 (ω) ∝ ω 2 behavior as
suggested by Ng and Lee [62], that catches up the interpolated value of the correlated
electrons rather quickly. Although for T → 0 this range is enlarged to lower energies,
as hopping conduction freezes out, the ω 1.75 decay is approached asymptotically in the
GHz range. This gives the lower bound of the spinon-dominated optical conductivity.
Thus, the realm of coherent spinons is limited to the range from MHz frequencies to
200 cm−1 . When the electronic conductivity exceeds the spinon contribution, the related
Fermi surface is eventually damped away, as discussed in Ref. [113].Electrodynamics of quantum spin liquids 15
'-EtMe Sb[Pd(dmit) ]
3 2 2 KK on R
cm )
100
-1
R & T
T = 3 K
FP min
5
.7
5
-1
.7
FP max
1
1
Conductivity ( 10
1
E || a E || b
0.1
10 100 1000 10 100 1000
-1 -1
Frequency (cm ) Frequency (cm )
Figure 12. The low-frequency conductivity of β ′ -EtMe3 Sb[Pd(dmit)2 ]2 determined
using different methods at T = 3 K for two polarizations of the electric field. Apart
from the absolute values, there is no appreciable anisotropy between the two in-plane
crystal axes a and b. The data obtained from the Kramers-Kronig analysis of the
reflectivity (thin black line) become rather noisy below 100 cm−1 and contains an
increasing uncertainty due to the required extrapolation. The results directly obtained
from transmission and reflection measurements (thick red line) are more reliable. In
addition, fits of the Fabry-Perot interference maxima and minima enable us to directly
calculate the optical conductivity (green circles and blue triangles). From 200 to
500 cm−1 a power law can be fitted to the data, which crosses over to a larger slope
reminiscent of the Mott-Hubbard band. For ν < 200 cm−1 , however, σ1 exceeds the
extrapolated power-law descent towards lower frequencies indicative of an additional
absorption mechanism.
Now we can subtract the smooth electronic background determined in figure 12
and focus on the excess conductivity, that is seen in the linear plot of figure 13
as a broad feature of the optical conductivity below 200 cm−1 . Apart from a few
vibrational features, it is rather isotropic and confined to a frequency range determined
by the antiferromagnetic exchange J ≈ 250 K = 175 cm−1 . This dome-shaped in-gap
absorption is naturally attributed to spinons, which occur when J is the dominant energy
scale and the electronic conductivity is sufficiently suppressed at low temperatures. In
the static limit, σ1 (ω) decays faster than the ω 1.75 power-law background of the optical
data. Thus spinons affect neither the optical range nor the dc response where the physics
of correlated electrons prevails; nevertheless they can be observed at finite temperatures
in a limited frequency range well below the Mott gap.
Going back to the overview on several quantum spin liquids plotted in figure 6,
we can now understand why for κ-(BEDT-TTF)2 Cu2 (CN)3 no indications of spinons
could be seen in the optical conductivity (figure 9) [101, 103]. Due to the weaker
correlations U/W the compound is located much closer to the insulator-to-metal phase
boundary [83] and consequently the tail of the Mott-Hubbard excitations decay much
slower towards ω → 0. κ-(BEDT-TTF)2 Cu2 (CN)3 exhibits a power-law conductivity
with a weaker slope and larger absolute value compared to β ′ -EtMe3 Sb[Pd(dmit)2 ]2 .
Hence, the electronic contribution to the electrodynamic response of κ-(BEDT-TTF)2 -Electrodynamics of quantum spin liquids 16
Figure 13. After subtracting the power-law background related with the Mott-
Hubbard band, we obtain a broad low-energy feature below approximately 200 cm−1 ,
which is close to the antiferromagnetic exchange energy of β ′ -EtMe3 Sb[Pd(dmit)2 ]2 .
Hence, we associate it with the coherent spinon Fermi surface predicted previously
[60, 62]. The dome-like shape of the spinon contribution arises due to the ω 2 decay
towards ω → 0. This feature becomes visible when the background conductivity is
sufficiently suppressed due to opening of the Mott gap. The strong, narrow modes at
higher frequencies correspond to vibrational features.
Cu2 (CN)3 dominates well into the GHz range of frequency.
5. Summary
In all cases that came under scrutiny here, the power laws observed in all spin-liquid
compounds are not in accordance with the theoretical values predicted for spinon
contributions [62], neither at low, nor at high frequencies. In the low-frequency limit,
the exponent β1 generally resembles Jonscher’s universal power law of the dielectric
response [118] as it is widely observed in disordered solids. At high frequencies and
temperatures spinons should not play a role because the excitation energy exceeds the
antiferromagnetic exchange coupling J. The frequency and temperature dependence
observed in the optical conductivity of these quantum spin liquid compounds is
governed by charge excitations rather than magnetic contributions. For systems with
a large Coulomb gap, such as β ′ -EtMe3 Sb[Pd(dmit)2 ]2 or Herbertsmithite, the spinon
contribution becomes detectable in the GHz and THz ranges at very low temperatures
when the in-gap absorption is significantly reduced. Here we can identify a contribution
to the ω → 0 optical conductivity that can be assigned to gapless spinon excitations.
Acknowledgments
Over the years, we experienced fruitful collaborations with several groups in the various
fields. We acknowledge the fruitful collaboration with and contributions from V.
Dobrosavljević, S. Fratini, B. Gorshunov, R. Hübner, T. Ivek, R. Kato, C. Krellner, Y.Electrodynamics of quantum spin liquids 17
Li, A. Löhle, I. Mazin, M. Pinterić, P. Puphal, R. Rösslhuber, G. Saito, J.A. Schlueter,
R. Valentı́, S. Tomić, Y. Yoshida and E. Zhukova. The work was supported by the
Deutsche Forschungsgemeinschaft (DFG) via DR228/39-1 and DR228/52-1.
References
[1] Pauling L 1935 J. Am. Chem. Soc. 57 2680
[2] Anderson P W 1956 Phys. Rev. 102 1008–1013
[3] Anderson P 1973 Mater. Res. Bull. 8 153–160
[4] Fazekas P and Anderson P W 1974 Phil. Mag. 30 423–440
[5] Lee P A 2008 Science 321 1306–1307
[6] Balents L 2010 Nature 464 199–208
[7] Lacroix C, Mendels P and Mila F (eds) 2011 Introduction to Frustrated Magnetism (New York:
Springer-Verlag)
[8] Diep H (ed) 2013 Frustrated Spin Systems (Singapore: World Scientific)
[9] Starykh O A 2015 Rep. Progr. Phys. 78 052502
[10] Wen X G 2002 Phys. Rev. B 65 165113
[11] Savary L and Balents L 2017 Rep. Progr. Phys. 80 016502
[12] Anderson P W 1987 Science 235 1196–1198
[13] Baskaran G, Zou Z and Anderson P 1987 Solid State Commun. 63 973–976
[14] Zaanen J 2012 A modern, but way too short history of the theory of superconductivity at a high
temperature 100 years of superconductivity ed Rogalla H and Kes P H (Boca Raton, FL: CRC
Press) pp 92–114
[15] Lahaye T, Menotti C, Santos L, Lewenstein M and Pfau T 2009 Rep. Progr. Phys. 72 126401
[16] Baranov M A, Dalmonte M, Pupillo G and Zoller P 2012 Chem. Rev. 112 5012–5061
[17] Belobrov P and Ignatchenko A 1983 Sov. Phys. JETP 57 636–642
[18] Johnston D C 2016 Phys. Rev. B 93 014421
[19] Gorshunov B P, Zhukova E S, Torgashev V I, Lebedev V V, Shakurov G S, Kremer R K, Pestrjakov
E V, Thomas V G, Fursenko D A and Dressel M 2013 J. Phys. .Chem. Lett. 4 2015–2020
[20] Gorshunov B P, Torgashev V I, Zhukova E S, Thomas V G, Belyanchikov M A, Kadlec C, Kadlec
F, Savinov M, Ostapchuk T, Petzelt J, Prokleška J, Tomas P V, Pestrjakov E V, Fursenko
D A, Shakurov G S, Prokhorov A S, Gorelik V S, Kadyrov L S, Uskov V V, Kremer R K and
Dressel M 2016 Nature Communic. 7 12842
[21] Nisoli C, Moessner R and Schiffer P 2013 Rev. Mod. Phys. 85 1473–1490
[22] Gingras M J P and McClarty P A 2014 Reports on Progress in Physics 77 056501
[23] Zhou Y, Kanoda K and Ng T K 2017 Rev. Mod. Phys. 89 025003
[24] Shimizu Y, Miyagawa K, Kanoda K, Maesato M and Saito G 2003 Phys. Rev. Lett. 91 107001
[25] Kurosaki Y, Shimizu Y, Miyagawa K, Kanoda K and Saito G 2005 Phys. Rev. Lett. 95 177001
[26] Shores M P, Nytko E A, Bartlett B M and Nocera D G 2005 J. Am. Chem. Soc. 127 13462–13463
[27] Mendels P, Bert F, de Vries M A, Olariu A, Harrison A, Duc F, Trombe J C, Lord J S, Amato
A and Baines C 2007 Phys. Rev. Lett. 98 077204
[28] Helton J S, Matan K, Shores M P, Nytko E A, Bartlett B M, Yoshida Y, Takano Y, Suslov A,
Qiu Y, Chung J H, Nocera D G and Lee Y S 2007 Phys. Rev. Lett. 98 107204
[29] Savary L and Balents L 2017 Phys. Rev. Lett. 118 087203
[30] Norman M R 2016 Rev. Mod. Phys. 88 041002
[31] Kanoda K and Kato R 2011 Ann. Rev. Condens. Matter Phys. 2 167–188
[32] Powell B J and McKenzie R H 2011 Rep. Progr. Phys. 74 056501
[33] Okamoto Y, Yoshida H and Hiroi Z 2009 J. Phys. Soc. Jpn. 78 033701
[34] Hiroi Z, Hanawa M, Kobayashi N, Nohara M, Takagi H, Kato Y and Takigawa M 2001 J. Phys.
Soc. Jpn. 70 3377–3384Electrodynamics of quantum spin liquids 18
[35] Fukaya A, Fudamoto Y, Gat I M, Ito T, Larkin M I, Savici A T, Uemura Y J, Kyriakou P P,
Luke G M, Rovers M T, Kojima K M, Keren A, Hanawa M and Hiroi Z 2003 Phys. Rev. Lett.
91 207603
[36] Okamoto Y, Nohara M, Aruga-Katori H and Takagi H 2007 Phys. Rev. Lett. 99 137207
[37] Khuntia P, Bert F, Mendels P, Koteswararao B, Mahajan A V, Baenitz M, Chou F C, Baines C,
Amato A and Furukawa Y 2016 Phys. Rev. Lett. 116 107203
[38] de Vries M A, Kamenev K V, Kockelmann W A, Sanchez-Benitez J and Harrison A 2008 Phys.
Rev. Lett. 100 157205
[39] Nilsen G J, de Vries M A, Stewart J R, Harrison A and Rnnow H M 2013 J. Phys.: Condens.
Matter 25 106001
[40] Han T H, Helton J S, Chu S, Nocera D G, Rodriguez-Rivera J A, Broholm C and Lee Y S 2012
Nature (London) 492 406
[41] Han T H, Norman M R, Wen J J, Rodriguez-Rivera J A, Helton J S, Broholm C and Lee Y S
2016 Phys. Rev. B 94 060409
[42] Lecheminant P, Bernu B, Lhuillier C, Pierre L and Sindzingre P 1997 Phys. Rev. B 56 2521–2529
[43] Sindzingre P and Lhuillier C 2009 EPL (Europhys. Lett.) 88 27009
[44] Yan S, Huse D and White S 2011 Science 332 1173
[45] Läuchli A M, Sudan J and Sørensen E S 2011 Phys. Rev. B 83 212401
[46] Nakano H and Sakai T 2011 J. Phys. Soc. Jpn. 80 053704
[47] Potter A C, Senthil T and Lee P A 2013 Phys. Rev. B 87 245106
[48] Kalmeyer V and Laughlin R B 1987 Phys. Rev. Lett. 59 2095–2098
[49] Sheng D N, Motrunich O I and Fisher M P A 2009 Phys. Rev. B 79 205112
[50] Qi Y, Xu C and Sachdev S 2009 Phys. Rev. Lett. 102 176401
[51] Mishmash R V, Garrison J R, Bieri S and Xu C 2013 Phys. Rev. Lett. 111 157203
[52] Motrunich O I 2005 Phys. Rev. B 72 045105
[53] Ran Y, Hermele M, Lee P A and Wen X G 2007 Phys. Rev. Lett. 98 117205
[54] Pustogow A, Li Y, Voloshenko I, Puphal P, Krellner C, Mazin I I, Dressel M and Valentı́ R 2017
Phys. Rev. B 96 241114
[55] Puphal P, Bolte M, Sheptyakov D, Pustogow A, Kliemt K, Dressel M, Baenitz M and Krellner
C 2017 J. Mater. Chem. C 5 2629–2635
[56] Sushkov A B, Jenkins G S, Han T H, Lee Y S and Drew H D 2017 J. Phys.: Condens. Matter
29 095802
[57] Pustogow A, Dressel M, Li Y, Valenti R, Puphal P and Krellner C 2018 Lattic contribution to
the optical properties of herbertsmithites to be published in Phys. Rev. B
[58] Wulferding D, Lemmens P, Scheib P, Röder J, Mendels P, Chu S, Han T and Lee Y S 2010 Phys.
Rev. B 82 144412
[59] de Vries M A, Wulferding D, Lemmens P, Lord J S, Harrison A, Bonville P, Bert F and Mendels
P 2012 Phys. Rev. B 85 014422
[60] Lee S S and Lee P A 2005 Phys. Rev. B 72 235104
[61] Ioffe L B and Larkin A I 1989 Phys. Rev. B 39 8988–8999
[62] Ng T K and Lee P A 2007 Phys. Rev. Lett. 99 156402
[63] Colbert J R, Drew H D and Lee P A 2014 Phys. Rev. B 90 121105
[64] Pilon D V, Lui C H, Han T H, Shrekenhamer D, Frenzel A J, Padilla W J, Lee Y S and Gedik
N 2013 Phys. Rev. Lett. 111 127401
[65] Shimizu Y, Hiramatsu T, Maesato M, Otsuka A, Yamochi H, Ono A, Itoh M, Yoshida M, Takigawa
M, Yoshida Y and Saito G 2016 Phys. Rev. Lett. 117 107203
[66] Pinterić M, Lazić P, Pustogow A, Ivek T, Kuveždić M, Milat O, Gumhalter B, Basletić M, Čulo
M, Korin-Hamzić B, Löhle A, Hübner R, Sanz Alonso M, Hiramatsu T, Yoshida Y, Saito G,
Dressel M and Tomić S 2016 Phys. Rev. B 94 161105
[67] Itou T, Oyamada A, Maegawa S, Tamura M and Kato R 2008 Phys. Rev. B 77 104413
[68] Itou T, Oyamada A, Maegawa S and Kato R 2010 Nature Phys. 6 673–676Electrodynamics of quantum spin liquids 19
[69] Kandpal H C, Opahle I, Zhang Y Z, Jeschke H O and Valentı́ R 2009 Phys. Rev. Lett. 103 067004
[70] Nakamura K, Yoshimoto Y, Kosugi T, Arita R and Imada M 2009 J. Phys. Soc. Jpn. 78 083710
[71] Nakamura K, Yoshimoto Y and Imada M 2012 Phys. Rev. B 86 205117
[72] Huse D A and Elser V 1988 Phys. Rev. Lett. 60 2531–2534
[73] Capriotti L, Trumper A E and Sorella S 1999 Phys. Rev. Lett. 82 3899–3902
[74] Kaneko R, Morita S and Imada M 2014 J. Phys. Soc. Jpn. 83 093707
[75] Yamashita S, Nakazawa Y, Oguni M, Oshima Y, Nojiri H, Shimizu Y, Miyagawa K and Kanoda
K 2008 Nature Phys. 4 459
[76] Yamashita M, Nakata N, Kasahara Y, Sasaki T, Yoneyama N, Kobayashi N, Fujimoto S, Shibauchi
T and Matsuda Y 2009 Nature Phys. 5 44–47
[77] Dressel M, Lazić P, Pustogow A, Zhukova E, Gorshunov B, Schlueter J A, Milat O, Gumhalter
B and Tomić S 2016 Phys. Rev. B 93 081201
[78] Oshima K, Mori T, Inokuchi H, Urayama H, Yamochi H and Saito G 1988 Phys. Rev. B 38
938–941
[79] Komatsu T, Matsukawa N, Inoue T and Saito G 1996 J. Phys. Soc. Jpn. 65 1340–1354
[80] Hiramatsu T, Yoshida Y, Saito G, Otsuka A, Yamochi H, Maesato M, Shimizu Y, Ito H and
Kishida H 2015 J. Mater. Chem. C 3 1378–1388
[81] Kato R, Fukunaga T, Yamamoto H M, Ueda K and Hengbo C 2012 phys. stat. sol. (b) 249
999–1003
[82] Kato R and Hengbo C 2012 Crystals 2 861–874
[83] Pustogow A, Bories M, Löhle A, Rösslhuber R, Zhukova E, Gorshunov B, Tomić S, Schlueter
J A, Hübner R, Hiramatsu T, Yoshida Y, Saito G, Kato R, Lee T H, Dobrosavljević V, Fratini
S and Dressel M 2017 Quantum Spin Liquids Unveil the Genuine Mott State arXiv:1710.07241
[84] Nakamura Y, Yoneyama N, Sasaki T, Tohyama T, Nakamura A and Kishida H 2014 J. Phys.
Soc. Jpn. 83 074708
[85] Rovillain P, Bardeen A, Yong R, Graham P, Burn P, Lo S C, Ulrich C and Powell B 2014
unpublished
[86] Jeschke H O, de Souza M, Valentı́ R, Manna R S, Lang M and Schlueter J A 2012 Phys. Rev. B
85 035125
[87] McKenzie R 1998 Comments Cond. Mat. Phys. 18
[88] Geiser U, Wang H H, Carlson K D, Williams J M, Charlier H A, Heindl J E, Yaconi G A, Love
B J, Lathrop M W and et al 1991 Inorg. Chem. 30 2586–2588
[89] Faltermeier D, Barz J, Dumm M, Dressel M, Drichko N, Petrov B, Semkin V, Vlasova R, Mézière
C and Batail P 2007 Phys. Rev. B 76 165113
[90] Merino J, Dumm M, Drichko N, Dressel M and McKenzie R H 2008 Phys. Rev. Lett. 100 086404
[91] Dumm M, Faltermeier D, Drichko N, Dressel M, Mézière C and Batail P 2009 Phys. Rev. B 79
195106
[92] Dressel M, Faltermeier D, Dumm M, Drichko N, Petrov B, Semkin V, Vlasova R, Mézière C and
Batail P 2009 Physica B 404 541 – 544
[93] Ferber J, Foyevtsova K, Jeschke H O and Valentı́ R 2014 Phys. Rev. B 89 205106
[94] Girlando A, Masino M, Visentini G, Valle R G D, Brillante A and Venuti E 2000 Phys. Rev. B
62 14476–14486
[95] Dressel M and Drichko N 2004 Chem. Rev. 104 5689
[96] Yakushi K 2012 Crystals 2 1291–1346
[97] Girlando A, Masino M, Kaiser S, Sun Y, Drichko N, Dressel M and Mori H 2012 phys. stat. sol.
(b) 249 953–956
[98] Girlando A, Masino M, Schlueter J A, Drichko N, Kaiser S and Dressel M 2014 Phys. Rev. B 89
174503
[99] Pinterić M, Góngora D R, Ž Rapljenović, Ivek T, Čulo M, Korin-Hamzić B, Milat O, Gumhalter
B, Lazić P, Alonso M S, Li W, Pustogow A, Lesseux G G, Dressel M and Tomić S 2018 Crystals
8 12345Electrodynamics of quantum spin liquids 20
[100] Nakamura Y, Hiramatsu T, Yoshida Y, Saito G and Kishida H 2017 J. Phys. Soc. Jpn. 86 014710
[101] Kézsmárki I, Shimizu Y, Mihály G, Tokura Y, Kanoda K and Saito G 2006 Phys. Rev. B 74
201101
[102] Sedlmeier K, Elsässer S, Neubauer D, Beyer R, Wu D, Ivek T, Tomić S, Schlueter J A and Dressel
M 2012 Phys. Rev. B 86 245103
[103] Elsässer S, Wu D, Dressel M and Schlueter J A 2012 Phys. Rev. B 86 155150
[104] Pinterić M, Čulo M, Milat O, Basletić M, Korin-Hamzić B, Tafra E, Hamzić A, Ivek T, Peterseim
T, Miyagawa K, Kanoda K, Schlueter J A, Dressel M and Tomić S 2014 Phys. Rev. B 90 195139
[105] Pustogow A, Zhukova E, Gorshunov B, Pinterić M, Tomić S, Schlueter J A and Dressel
M 2014 Low-Energy Excitations in the Quantum Spin-Liquid κ-(BEDT-TTF)2 Cu2 (CN)3
arXiv:1412.4581
[106] Abdel-Jawad M, Terasaki I, Sasaki T, Yoneyama N, Kobayashi N, Uesu Y and Hotta C 2010
Phys. Rev. B 82 125119
[107] Pinteric M, Ivek T, Culo M, Milat O, Basletic M, Korin-Hamzic B, Tafra E, Hamzic A, Dressel
M and Tomic S 2015 Physica B 460 202 – 207
[108] Tomic S and Dressel M 2015 Rep. Progr. Phys. 78 096501
[109] Beyer R, Dengl A, Peterseim T, Wackerow S, Ivek T, Pronin A V, Schweitzer D and Dressel M
2016 Phys. Rev. B 93 195116
[110] The extracted values are in accord with the preliminary analysis of the independent experiments
on a different κ-(BEDT-TTF)2 Cu2 (CN)3 single crystal presented in Ref. [103].
[111] Zhou Y and Ng T K 2013 Phys. Rev. B 88 165130
[112] Mott N and Davis E A 1979 Electronic Processes in Non-Crystalline Materials 2nd ed (Oxford:
Oxford University Press)
[113] Lee T H, Florens S and Dobrosavljević V 2016 Phys. Rev. Lett. 117 136601
[114] Senthil T 2008 Phys. Rev. B 78 035103
[115] Podolsky D, Paramekanti A, Kim Y B and Senthil T 2009 Phys. Rev. Lett. 102 186401
[116] Pustogow A, Saito Y, Zhukova E, Gorshunov B, Kato R, Lee T H, Dobrosavljević V and Dressel
M 2018 Low-energy excitations in quantum spin-liquids identified by optical spectroscopy
arXiv:1803.01553
[117] Lazić P, Pinterić M, Góngora D R, Pustogow A, Treptow K, Ivek T, Milat O, Gumhalter B,
Došlić N, Kato R, Dressel M and Tomić S 2017 Importance of van der waals interactions and
cation-anion coupling in an organic quantum spin liquid arXiv:1710.01942
[118] Jonscher A K 1977 Nature 267 673–679You can also read