ON-BARN PIG WEIGHT ESTIMATION BASED ON BODY MEASUREMENTS BY STRUCTURE-FROM-MOTION (SFM) - MDPI
←
→
Page content transcription
If your browser does not render page correctly, please read the page content below
sensors
Article
On-Barn Pig Weight Estimation Based on Body
Measurements by Structure-from-Motion (SfM)
Andrea Pezzuolo 1, * , Veronica Milani 1 , DeHai Zhu 2 , Hao Guo 2 , Stefano Guercini 1
and Francesco Marinello 1
 1   Department of Agroforesty and Landscape, University of Padua, 35020 Legnaro, Italy;
     veronica.milani@studenti.unipd.it (V.M.); stefano.guercini@unipd.it (S.G.);
     francesco.marinello@unipd.it (F.M.)
 2   College of Land Science and Technology, China Agricultural University, Beijing 100083, China;
     zhudehai@cau.edu.cn (D.Z.); guohaolys@cau.edu.cn (H.G.)
 *   Correspondence: andrea.pezzuolo@unipd.it; Tel.: +39-049-827-2722

 Received: 18 September 2018; Accepted: 23 October 2018; Published: 24 October 2018

 Abstract: Information on the body shape of pigs is a key indicator to monitor their performance and
 health and to control or predict their market weight. Manual measurements are among the most
 common ways to obtain an indication of animal growth. However, this approach is laborious
 and difficult, and it may be stressful for both the pigs and the stockman. The present paper
 proposes the implementation of a Structure from Motion (SfM) photogrammetry approach as a
 new tool for on-barn animal reconstruction applications. This is possible also to new software tools
 allowing automatic estimation of camera parameters during the reconstruction process even without
 a preliminary calibration phase. An analysis on pig body 3D SfM characterization is here proposed,
 carried out under different conditions in terms of number of camera poses and animal movements.
 The work takes advantage of the total reconstructed surface as reference index to quantify the
 quality of the achieved 3D reconstruction, showing how as much as 80% of the total animal area can
 be characterized.

 Keywords: pig barn; automatic measurement; animal weight; three-dimensional reconstruction;
 structure from motion

1. Introduction
     The live weight (LW) of pigs is an important factor for managing various stages of its
supply-chain [1]. At the farm scale, LW data is of great interest for pig management, as it serves
as an index for estimate animal growth [2], feed conversion efficiency [3], and health and disease
occurrence [4,5]. Moreover, the ability to accurately estimate pig sizes before setting up harvesting [6]
or procurement plans is very important for the stockman and the industry [7].
     Currently, most assessments of LW or pig conformation are conducted by eye and hand,
based on the (subjective) experience of the observer [8] and/or by direct weighing of the animal [9].
Although, direct weighing method provides the most accurate output, it involves a cumbersome and
time-consuming task [10] and could cause injury and stress to animals and stockmen when forcing the
animal onto the scale. Girth measurement is one of the main indirect approaches and also applied in
pig weighing [11]. However, this approach is laborious and difficult, and it may be stressful for both
the animals and the stockman [12].
     Alternatively, optical sensing systems can be implemented in order to overcome difficulties
arising from direct measurements [13,14]. Animals are typically imaged from the top and only seldom
imaged from the side by CCD (charge-coupled device) camera. Successively, images are processed by

Sensors 2018, 18, 3603; doi:10.3390/s18113603                                   www.mdpi.com/journal/sensors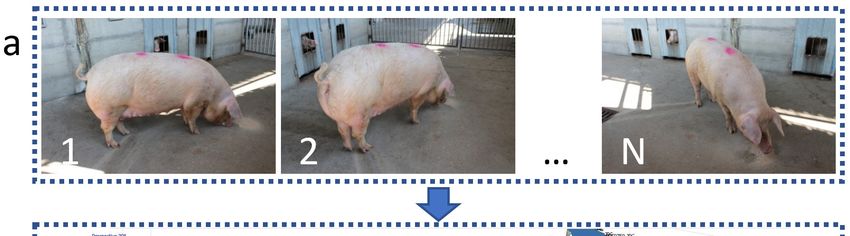
Sensors 2018, 18, 3603 2 of 12
specialized software in order to correlate the extracted features (e.g., projected area or profile) to the
pig’s LW.
Different kinds of optical sensor have been used, as for instance 2D cameras, but there is a
greater interest for 3D sensors, such as TOF (time of flight) cameras or CTS (consumer triangulation
sensor) systems [15]. Furthermore, approaches for pig LW estimation by means of a Microsoft Kinect®
camera have been proposed, taking advantage of infrared depth map images [16–18]. In particular,
Kongsro [19] reported weight estimation results from Landrace and Duroc breeds in the 20–140 kg body
weight interval, based on volume measurements. Recently, a number of different hardware-software
solutions have been also proposed in the market, to estimate a marked pig’s weight individually,
such as Weight-Detect (PLF-Agritech Europe, Edinburgh, UK), Pigwei (Ymaging, Barcelona, Spain),
eYeScan (Fancom BV, Panningen, The Netherlands), Growth Sensor (GroStat, Newport, UK),
OptiSCAN (Hölscher, Emsburen, Germany), and WUGGL One (WUGGL, Lebring, Österreich) [20].
Most of these are either based on three-dimensional images taken by either two- or three-dimensional
cameras [12,21]; however, they typically operate without clear information about data analysis
procedures or uncertainties.
Many authors have investigated on three-dimensional reconstruction methods based on optical
systems, however, Structure from Motion (SfM) has been attracting attention as one of the most practical
approaches for 3D reconstruction. Based on photogrammetry, SfM is a range imaging technique that
estimates 3D structuring from a series of 2D images captured at different points of view all around the
object [22]. SfM differs fundamentally from 2D imaging techniques in that the geometry of the scene,
camera positions, and orientation are solved automatically without the need to specify targets with
known 3D positions [14]. These are solved simultaneously using a highly redundant iterative bundle
adjustment procedure based on a database of features automatically extracted from a set of multiple
overlapping images [23].
Several studies have been proposed implementing such technique in order to collect 3D data about
plant’s phenology [24], soil topography and roughness [25,26] and building reconstruction [27,28],
however, SfM technique could be also implemented for livestock applications. In this field, SfM can
be a new convenient tool for on-barn animal reconstruction applications, also considered the fact
that camera intrinsic parameters are automatically estimated during the reconstruction process and
no prior calibration is needed. The potential for animal body parameters retrieval based on SfM
photogrammetry approach has not been widely explored: the present paper proposes an analysis on
pig body 3D reconstruction, under different conditions in terms of number of camera poses and animal
movements. Data collected were eventually compared with the results from manual LW measurements,
highlighting its potential and limits.
2. Materials and Methods
2.1. Structure from Motion (SfM)
SfM is a technique which provides the three-dimensional reconstruction of any regular or
free-form shape using a set of 2D images. This is implemented in some commercial software,
which supports the user, thereby simplifying the need for image processing efforts. Specifically, for the
present study, pigs’ reconstruction in a SfM approach was carried out through AgiSoft PhotoScan
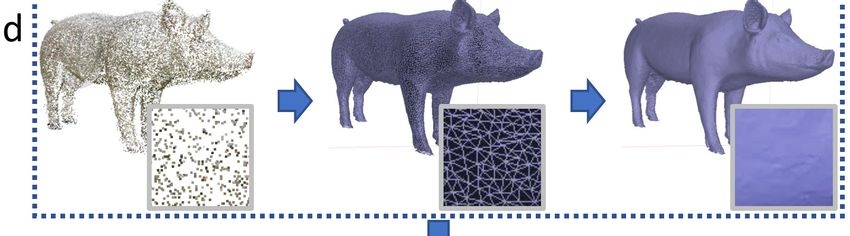
(version 1.3.1, AgiSoft LLC, St Petersburg, Russia) according to the procedure depicted in Figure 1.
As a first step images are captured from different perspectives, homogeneously and randomly
distributed all around the volume of interest (Figure 1a). Images can be collected by a single
sensor moved around (as done for the present experiments), or by a set of synchronized sensors
installed on a reference frame (which could be the configuration of a commercial optimized solution).
The camera perspective can have an effect on the quality of 3D reconstruction, therefore in case of
automation it is important to study and optimize the collocation of the positions where poses are
collected. Images are initially analysed in order to recover the relative localization and the orientation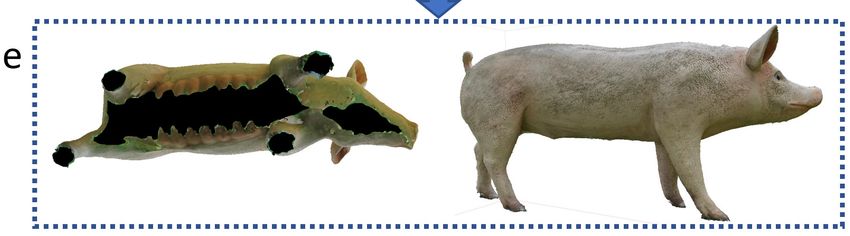
Sensors 2018, 18, 3603                                                                                                  3 of 12

of the camera from which the same images were taken, defining a set of reference positions in a
Cartesian
 Sensors 2018,coordinate
               18, x FOR PEERsystem
                               REVIEW  (Figure 1b). Then the applied software implements algorithms                     3 of for
                                                                                                                             11
images registration, thus allowing automatic detection, extraction and matching of corresponding
 registration,
common             thusin
            features    allowing
                          multipleautomatic
                                     overlapping  detection,
                                                     imagesextraction
                                                              (Figure 1c)andandmatching
                                                                                generation of of
                                                                                               corresponding
                                                                                                  a network of common
                                                                                                                    tie points.
 features
Such        in multiple
       a network           overlapping
                      defines   a statingimages     (Figure
                                             reference  point1c)  and generation
                                                                cloud,             of a network
                                                                        which constitutes            of tie for
                                                                                               the basis     points.  Such a
                                                                                                                 subsequent
 network      defines    a  stating   reference    point  cloud,     which   constitutes   the   basis
refinement and definition of a dense point cloud (Figure 1d). A surface which describes the volume of     for   subsequent
 refinement
interest  is thusandachieved:
                      definition   of ashape
                                such     denseundergoes
                                                 point cloud   (Figure
                                                            a final     1d). A surface
                                                                     processing  which which
                                                                                         is needed describes
                                                                                                       in order thetovolume
                                                                                                                      remove
 of interest    is  thus achieved:    such    shape  undergoes     a final processing   which     is needed
external elements (e.g., floor, background elements). Additionally, if needed, an interpolation is carried      in  order    to
 remove    external    elements   (e.g., floor,  background    elements).   Additionally,   if needed,
out on shape portions with missing data, such as those related to hidden or difficultly accessible       an   interpolation
 is carried
parts  (Figure out1e).
                     on shape   portions
                         The final   shapewith     missing
                                               can be        data, such with
                                                      also integrated      as those related
                                                                                a texture    into  hidden
                                                                                                order         or difficultly
                                                                                                        to render      a more
 accessible   parts
intuitive appearance. (Figure  1e). The    final shape  can  be  also integrated  with a  texture    in order    to render    a
 more intuitive appearance.

        Figure 1. Flow
         Figure1. Flow chart
                       chart representation of the
                             representation of the applied
                                                   applied methodology
                                                           methodology and
                                                                       and3D
                                                                           3Dreconstruction
                                                                              reconstructionprocedure.
                                                                                             procedure.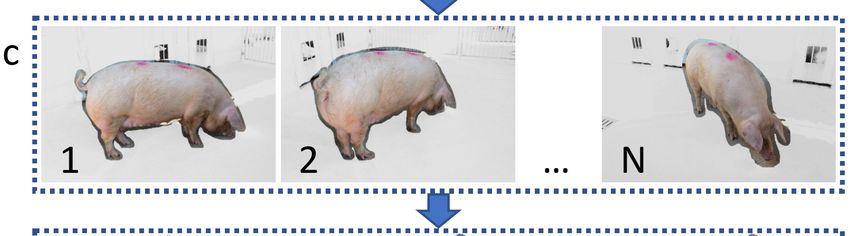
Two parameters were then selected to evaluate the quality of the reconstructed dense cloud: the
surface roughness (which quantifies surface noise) and the amount of reconstructed area.
      It should be pointed out how reconstructed surfaces suffer from noise, not only arising from skin
roughness and outer hair, but also caused by secondary movements (due for instance to breathing,
or muscle
Sensors        movements)
        2018, 18, 3603          which are misinterpreted during the 3D reconstruction causing a 4local          of 12
unevenness of the texture, as can be noticed in Figure 2.
      Such noise was quantified in terms of root mean square (RMS) roughness obtaining the first
      The final
parameter          closed dense
                indicative        point cloud can quality.
                              of reconstruction      be eventually
                                                              Sinceused   to extract
                                                                      noise   might relevant   parameters
                                                                                      apparently    increase[24–26].
                                                                                                               total
Two   parameters     were  then  selected  to evaluate the quality of the reconstructed  dense  cloud:
reconstructed area, the obtained surfaces were filtered through a Gaussian filtering software tool      the surface
                                                                                                                 (40
roughness     (which    quantifies  surface  noise)  and the amount   of reconstructed   area.
mm cut-off) in order to reduce its effects. Finally, the total reconstructed body surface was computed
      It should
as a second         be pointed
                parameter        out how
                             directly       reconstructed
                                       related              surfaces
                                                to the quality of the suffer  from noise, not
                                                                      3D reconstruction.   Area only  arising
                                                                                                  is here     from
                                                                                                          reported
skin   roughness      and   outer  hair,  but  also  caused  by  secondary    movements     (due
as a percentage, calculated on the basis of the expected total surface estimated from the animal   for instance    to
breathing,
weight.   In or   muscle
               order       movements)
                       to minimize   errorswhich   are misinterpreted
                                              on total area estimation,during    the 3D
                                                                          resampled     reconstruction
                                                                                      areas              causing
                                                                                             were excluded    from  a
local  unevenness
computation.           of the texture,  as can be  noticed in Figure  2.

     Figure 2. An
     Figure 2. An example
                     example of
                              of aa reconstructed
                                    reconstructed 3D
                                                   3D area,
                                                       area, without
                                                             without (left)
                                                                     (left) and
                                                                            and with
                                                                                with (right) application of
                                                                                     (right) application of aa
     Gaussian   filter: the  applied    filter reduces  positive and   negative  peaks   producing   a  more
     Gaussian filter: the applied filter reduces positive and negative peaks producing a more homogeneous
     homogeneous     and less noisy surface.
     and less noisy surface.

      Such noise
2.2. Animal         was quantified in terms of root mean square (RMS) roughness obtaining the
              Imaging
first parameter indicative of reconstruction quality. Since noise might apparently increase total
      A commercial camera was implemented for collection of images needed for pigs’ SfM
reconstructed area, the obtained surfaces were filtered through a Gaussian filtering software tool
reconstruction. Specifically, a Nikon D5100 camera (Nikon Corporation, Tokyo, Japan) was used,
(40 mm cut-off) in order to reduce its effects. Finally, the total reconstructed body surface was
featuring a 23.6 × 15.6 mm CMOS sensor with a 4928 × 3264 pixel resolution and a lens with a 35 mm
computed as a second parameter directly related to the quality of the 3D reconstruction. Area is here
focal length. Poses were collected considering a distance of the animals from the camera ranging
reported as a percentage, calculated on the basis of the expected total surface estimated from the
between 0.7 and 1.5 m (Figure 1b). A total of at least 50 images per pig was considered, captured from
animal weight. In order to minimize errors on total area estimation, resampled areas were excluded
withers to buttock and from the top of the back to ground.
from computation.
      During the experiments, a video sequence of the scene was additionally recorded by means of a
second   commercial
2.2. Animal   Imaging camera (GoPro Hero 4 action camera by GoPro Inc., San Mateo, CA, USA) with
8.3 MP (3840 × 2160) resolution at 30 frames per second. Such camera was positioned above the pig,
      A commercial
in order                camera
           to monitor and        was the
                            quantify   implemented     for collection
                                          number of movements           of imaged
                                                                    of the  images animal
                                                                                    neededbody.
                                                                                             for pigs’  SfM
                                                                                                 The video
reconstruction.    Specifically, a Nikon  D5100   camera   (Nikon   Corporation,  Tokyo,  Japan)  was
sequence of the scene was then processed by means of a tracking software (Tracker version 4.80, Open   used,
featuring
Source      a 23.6 ×
         Physics,    15.6 mm CMOS
                   California,        sensor
                               CA, USA)   [29]with a 4928 ×
                                               to digitize   3264 pixel resolution
                                                           movements,    eventuallyand a lens with
                                                                                    allowing       a 35 mm
                                                                                              estimation  of
focal  length.   Poses were  collected  considering  a distance
frequency and amplitude of shifts from the initial position.     of  the animals from  the camera  ranging
between 0.7 and 1.5 m (Figure 1b). A total of at least 50 images per pig was considered, captured from
withers   to buttock
2.3. Animals         and from the top of the back to ground.
               and Housing
      During the experiments, a video sequence of the scene was additionally recorded by means of a
      All observations were conducted in a commercial pig weaning farm located in the North of Italy.
second commercial camera (GoPro Hero 4 action camera by GoPro Inc., San Mateo, CA, USA) with
The pigs breed was a crossbreed of Large White (50%) and Landrace (50%), and were fed with a daily
8.3 MP (3840 × 2160) resolution at 30 frames per second. Such camera was positioned above the pig,
ration of 2.8 ± 1.0 kg of commercial fodder mixture; water was supplied ad libitum through bite nipple
in order to monitor and quantify the number of movements of the imaged animal body. The video
drinkers.
sequence of the scene was then processed by means of a tracking software (Tracker version 4.80,
      In the pig farm, each pen barn had an average size of 8.5 m wide × 3.50 m long, divided into two
Open Source Physics, California, CA, USA) [29] to digitize movements, eventually allowing estimation
areas (inside area 4.0 m wide × 3.5 m long with grid floor; outside area 4.5 m wide × 3.5 m long with
of frequency and amplitude of shifts from the initial position.
solid floor), and containing 10 pigs. Pens were separated from each other by solid walls to avoid
physical   contact.
2.3. Animals   and Housing
     All observations were conducted in a commercial pig weaning farm located in the North of Italy.
The pigs breed was a crossbreed of Large White (50%) and Landrace (50%), and were fed with a daily
ration of 2.8 ± 1.0 kg of commercial fodder mixture; water was supplied ad libitum through bite
nipple drinkers.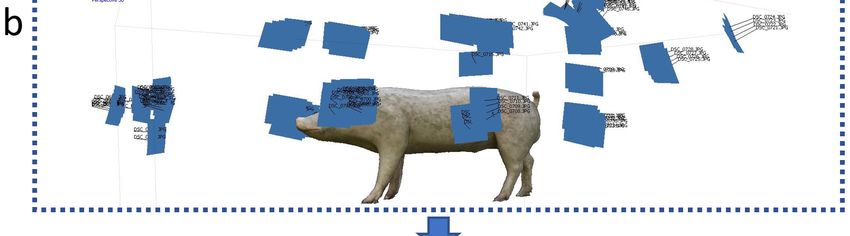
Sensors 2018, 18, 3603                                                                                   5 of 12

     In the pig farm, each pen barn had an average size of 8.5 m wide × 3.50 m long, divided into
two areas (inside area 4.0 m wide × 3.5 m long with grid floor; outside area 4.5 m wide × 3.5 m long
with solid floor), and containing 10 pigs. Pens were separated from each other by solid walls to avoid
physical contact.
     The temperature was automatically kept at approximately 25 ◦ C (the temperature was adjusted if
the pigs showed adverse behavioural responses), and the lighting was on a 12/12 h light/dark cycle
with an average light intensity ranging between 100 and 130 lx measured at ground level using a
luminance metre (Konica Minolta T10, Inc., Osaka, Japan).
     According to EU legislation (Council Directive 86/609/EEC), no procedures requiring approval
from the local ethics committee were used.

2.4. Experimental Design and Data Acquisition
     Experiments and subsequent analyses had the scope to give indications on the applicability of
the SfM approach to 3D body reconstruction. To this end, analyses focused on: (i) determination of
the minimum number of images needed to properly characterize body shape, (ii) quantification of the
effect of animal movements on 3D reconstruction and (iii) identification of the animal body portions
more likely reconstructed after application of SfM.
     The first part of the research consisted of a preliminary validation of the SfM approach. For the
scope, an ideal condition was created through implementation of a fiberglass reference model
(Figure 1e) resembling the actual shape, posture, colour and dimensions of a real pig (Table 1).
Increasing numbers of images (respectively, 10, 20, 30 40, 50, 60, 70, and 80) were captured, with a
frequency of about two frames per second. Images from different perspectives and distances
homogeneously distributed around the animal body were then implemented for the reconstruction of
a three-dimensional model. The analysis helps to define the minimum number of frames which are
needed in ideal conditions in a reconstruction process.

      Table 1. Ages and weights of studied animals. For the fiberglass model, the weight of an animal with
      an equivalent size is reported.

                                 Animal ID             Age (d)        Weight (kg)
                             Fiberglass reference          -              ~209
                                      1                  1303              260
                                      2                  1537              268
                                      3                  1598              257
                                      4                  1497              272
                                      5                   501              234
                                      6                   724              256

     The fixed position and the time stability (thermal distortions of the overall length were estimated
to be lower than 0.1 mm/◦ C) allowed also to tune the imaging and reconstruction procedure,
and to calibrate the final 3D model taking advantage of the so called substitution approach [30].
Such calibration procedure is important in order to allow extraction of quantitative data from the
model and, secondly.
     In the second part of the experimental campaign, 6 pigs were randomly picked from six
pens. Sampled animals with an average age of 1467 ± 117 day underwent weight analyses:
LW measurements were carried out by the stockman by means of an electronic scale (Laumas
Electronics mod. Bil, accuracy ±0.05 kg) and a LW of approximately 258 ± 13.0 kg (mean ± s.d.) was
measured (Table 1).
     Pigs were studied at the same time of the day (between 02:30 and 04:30 PM) while the animals
were eating. According also to other researchers, the eating/drinking position was considered as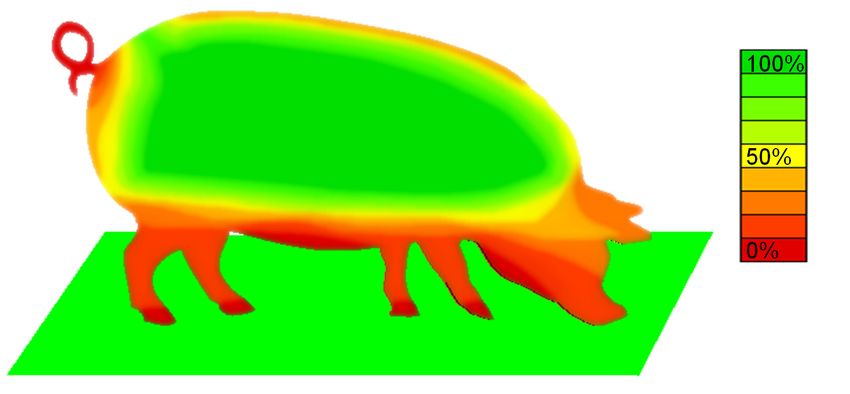
Sensors 2018, 18, 3603                                                                                                  6 of 12

the ideal position for the 3D reconstruction [31–33]; indeed, during feeding, pigs often remain in a
relatively stable position for a few minutes several times a day.
      Animals included in the study exhibited different aptitudes during feeding and, thus,
during experiments, mostly appearing as different amounts of movements per second. Such variability
was usefully studied in order to understand the effects of body movements on 3D reconstruction.
Thus, collected motion data were compared with the percentage of reconstructed body area. It is
worth noting that, due to the thresholding and processing algorithms implemented into the tracking
software [29], the average movements of the whole pig body were analysed through its centre of mass.
Specifically, shifts of the centre position were monitored and used as an indicator of animal steadiness.
Since most of pigs’ movements during feeding are typically localized in correspondence of the animal
head, shifts averaged on the whole body could be somehow attenuated and, thus, underestimated.
However, such kind of behaviour during feeding was systematic among different pigs, therefore the
revealed parameter can still be used in a comparative way, in order to characterize the different
experimental conditions.
      As already mentioned, both the number of frames and the number of movements influence the
total reconstructed area. On the other hand, 3D reconstruction is more frequently and thoroughly
achievable in correspondence of some body portions exhibiting a better visual accessibility which
makes them to appear in a higher number of frames. Then, the second experiment was also useful in
order to identify the parts of the animal body, which are more likely reconstructed after application
of SfM.
      Each experiment and each animal reconstruction was repeated three times in order to have an
information on the variability of the processes.

3. Results and Discussion

3.1. Method Performances
      As in the case of some other proposed techniques [10–12], the discussed SfM can benefit from
relatively low-cost technologies (100–1000 EUR), both for the cameras and for the three-dimensional
reconstruction software. Compared with classical 2D imaging [10], or with 3D Kinect imaging [12],
SfM is a viable solution as highlighted also by a recent work from the same authors and here briefly
summarized in Table 2 [34,35]. It can be noticed how SfM is still limited by relatively long processing
time (needed to produce the 3D model using just 2D images), however, such performance is constantly
increasing thanks to the availability of computers with faster and better performing processors.

      Table 2. Comparison of performances of main 3D techniques, elaborated from the present study and
      from other works [34,35].

                             Instrumentation     Resolution 3      RMS Noise 4      Scanning Time 2     Processing Time 2
          Technique
                              Costs 1 (EUR)         (mm)             (mm)                (min)                (min)
   Manual measurements             10–100             n.a.              n.a.               5–20                5–10
         2D images                10–100        0.5 × 0.5 × n.a.        n.a.               3–10                10–40
           Lidar                 500–5000          1×1×3              2.5–6.0              3–30                30–90
         Kinect v1                100–200          1×1×2              0.7–1.2              3–10                30–90
   Structure from Motion          10–200           3×3×2              1.0–2.5              5–15               120–240
      1Includes tripod or frames; do not include computer and analysis software; 2 Includes only time to collect data or
      capture images; 3 Maximum achievable x-y-z resolutions with sensors at 1 m distance from the object; 4 Measured
      on a flat surface; n.a. Data calculation not possible and not available for that technique.

3.2. Influence of the Number of Frames
     As reported by other researchers [24,28,36] the reconstructed surface rate is influenced by the
number of frames provided to the SfM algorithms.
     Experiments here proposed on the ideal fiberglass reference are in agreement with such findings:
specifically, a minimum of 50 photographs is in general needed in order to guarantee the reconstruction
Sensors 2018, 18, 3603 7 of 12
on at least 60% of animal body (Figure 3). Such percentage excludes the bottom section comprised
between the four legs, and the bottom part of the head (more difficultly imaged by surrounding
Sensors 2018, 18, x FOR PEER REVIEW 7 of 11
photographs), which however play only a secondary role on extraction of body related parameters [12].
Sensors
Then 502018, 18, x was
frames FOR PEER
set asREVIEW
the minimum number for subsequent reconstructions on live animals. 7 of 11
Figure 3. Reconstruction area with a number of frames ranging between 10 and 80. Error bars indicate
Figure 3. Reconstruction
standard arearepeated
with a number of frames ranging between 10 and 80. Error bars indicate
Figure 3.deviation on three
Reconstruction reconstructed
area with a number processes.
of frames ranging between 10 and 80. Error bars indicate
standard deviation on three repeated reconstructed processes.
standard deviation on three repeated reconstructed processes.
3.3. Influence of Animal’s Movements
3.3. Influence of Animal’s Movements
3.3. Live
Influence
animalof Animal’s
movements Movements
are the main reason for failures or distortions in SfM 3D reconstruction.
Live animal movements are the main reason for failures or distortions in SfM 3D reconstruction.
As explained
Live animal above, the pig are
movements movements were quantified
the main reason for failuresin terms of amplitude
in SfM 3Dand frequency,
As explained above, the pig movements were quantified inorterms
distortions
of amplitude reconstruction.
and frequency,
highlighting
As explained clear tendencies
above, the pig in both of cases.
highlighting clear tendencies in movements
both of cases.were quantified in terms of amplitude and frequency,
With regard
highlighting to the residualinroot
clear mean square (RMS) roughness, higher amplitude of movements
With regard to tendencies
the residual root bothmean
of cases.
square (RMS) roughness, higher amplitude of movements
in general produce
Withproduce
regard to higher levels of
the residual noise.
root mean The trend(RMS)
square is characterized
roughness,by a coefficient
higher of determination
amplitude of movements
in general higher levels of noise. The trend is characterized by a coefficient of determination
R² = 0.45, which somehow indicates a certain degree of correlation (Figure 4). However, for two of
Rin2 =general produce
0.45, which higherindicates
somehow levels of anoise. The
certain trendof
degree is correlation
characterized by a 4).
(Figure coefficient
However, of for
determination
two of the
the
R² animals,
= 0.45, intermediate
which somehow values on
indicates the
a average
certain amplitude
degree of of the
correlationmovements
(Figure caused
4). relatively
However, high
for two
animals, intermediate values on the average amplitude of the movements caused relatively high noiseof
noise levels on
the animals, reconstructed
intermediate surfaces.
values A clear trend was of onthethemovements
other handcausedhighlighted by high the
levels on reconstructed surfaces. Aon thetrend
clear average
wasamplitude
on the other hand highlighted by therelatively
frequency of
frequency
noise of the
levels on movements
reconstructed (Figure 5), which correlates with the RMS roughness with a coefficient
the movements (Figure 5), which surfaces.
correlates A clear
with the trend was on the
RMS roughness other
with hand highlighted
a coefficient by the
of determination
offrequency
2 determination
of the R² = 0.82. This(Figure
movements can be5), explained
which considering
correlates with the fact
the RMSthatroughness
animal photographs
with a were
coefficient
R = 0.82. This can be explained considering the fact that animal photographs were captured at a
captured at a
of determination constant frame rate: therefore, an increase on the frequency of the movements produce
constant frame rate:R²therefore,
= 0.82. This can be explained
an increase considering
on the frequency of thethe fact that animal
movements producephotographs
a corresponding were
acaptured
corresponding
at a increment
constant frameonrate:
the therefore,
total amountan of animal
increase on displacements
the frequency ofoccurring
the duringproduce
movements image
increment on the total amount of animal displacements occurring during image shooting.
shooting.
a corresponding increment on the total amount of animal displacements occurring during image
shooting.
Figure 4. RMS roughness as a function of amplitude of movements. Error bars represent standard
Figure 4. RMS roughness as a function of amplitude of movements. Error bars represent standard
deviation on three different reconstructions.
deviation
Figure 4.on three
RMS different as
roughness reconstructions.
a function of amplitude of movements. Error bars represent standard
deviation on three different reconstructions.Sensors 2018, 18, 3603 8 of 12
Sensors 2018, 18, x FOR PEER REVIEW 8 of 11
Figure 5. RMS roughness as a function of frequency of movements. Error bars represent standard
deviation on three different reconstructions.
Similar trends were recognized in relation to the total amount of reconstructed areas, were lower
levels of movements (both in terms of amplitude and frequency) are a condition for a good
reconstruction process (Figures 6 and 7). The trend is characterized by coefficients of determination
R² > 0.79. It can be noticed how the behaviour for the amplitude of movements is slightly different
Figure 5. RMS roughness as a function of frequency of movements. Error bars represent standard
between Figure 5. and
noise RMSreconstructed
roughness as a area:
function of frequency
indeed, the twoofparameters
movements. are
Error bars represent
slightly standard
independent and noise
deviation on three different reconstructions.
deviation on
reconstruction canthree different reconstructions.
be achieved both on a highly or poorly reconstructed areas.
Such results
Similar give
trends clear
were indications
recognized of the animal
in relation scanning
to the total amountphase. In fact, an increase
of reconstructed of the
areas, were image
lower
Similar trends were recognized in relation to the total amount of reconstructed areas, were lower
acquisition frequency corresponds
levels of movements (both in terms to an apparent reduction
of amplitude of theare
and frequency) frequency and for
a condition amplitude
a good of
levels of movements (both in terms of amplitude and frequency) are a condition for a good
movements
reconstructionentering
processthe(Figures
collected frames,
6 and and
7). The a consequent
trend increase
is characterized on the reconstruction
by coefficients quality.
of determination
reconstruction
2 process (Figures 6 and 7). The trend is characterized by coefficients of determination
According
R > 0.79.to It the
canresults of this
be noticed howstudy, increasingfor
the behaviour the scanning
the speed
amplitude from two toisatslightly
of movements least eight frames
different
R² > 0.79. It can be noticed how the behaviour for the amplitude of movements is slightly different
between
per secondsnoise and guarantee
could reconstructed area: reconstructed
a total indeed, the twoarea parameters are slightly
larger than independent
60% also and of
in the case noise
most
between noise and reconstructed area: indeed, the two parameters are slightly independent and noise
reconstruction
nervous pigs. can be achieved both on a highly or poorly reconstructed areas.
reconstruction can be achieved both on a highly or poorly reconstructed areas.
Such results give clear indications of the animal scanning phase. In fact, an increase of the image
acquisition frequency corresponds to an apparent reduction of the frequency and amplitude of
movements entering the collected frames, and a consequent increase on the reconstruction quality.
According to the results of this study, increasing the scanning speed from two to at least eight frames
per seconds could guarantee a total reconstructed area larger than 60% also in the case of most
nervous pigs.
Figure 6. The reconstructed area rate as a function of average estimated animal movements’ amplitude.
Figure 6. The reconstructed area rate as a function of average estimated animal movements’
Error bars represent standard deviation on three different reconstructions.
amplitude. Error bars represent standard deviation on three different reconstructions.
Such results give clear indications of the animal scanning phase. In fact, an increase of the
image acquisition frequency corresponds to an apparent reduction of the frequency and amplitude
of movements entering the collected frames, and a consequent increase on the reconstruction quality.
According
Figure to
6. the
Theresults of this study,
reconstructed increasing
area rate the scanning
as a function speedestimated
of average from twoanimal
to at least eight frames
movements’
per seconds could guarantee a total reconstructed area larger than 60% also
amplitude. Error bars represent standard deviation on three different reconstructions.in the case of most
nervous pigs.Sensors 2018, 18, 3603 9 of 12
Sensors 2018, 18, x FOR PEER REVIEW 9 of 11
Sensors 2018, 18, x FOR PEER REVIEW 9 of 11
Figure 7. The
The reconstructed rate
reconstructed areaasrate as a function ofestimated
average animal
estimated animal movements’
Figure
Figure 7.7. The reconstructedarea
area rate a function of average
as a function of average movements’
estimated frequency.
animal movements’
frequency.
Error bars Error
representbars represent
standard standard
deviation on deviation
three on
differentthree different
reconstructions.reconstructions.
frequency. Error bars represent standard deviation on three different reconstructions.
Reconstructions
Reconstructionsononlive animals
live animalswere
were useful
useful alsoalsoinin
order
order to to
characterize
characterize thetheparts
parts thethemost
most
Reconstructions on live animals were useful also in order to characterize the parts the most
frequently
frequentlyarearereconstructed
reconstructedafter after application
application of SfM SfMprocess.
process.A map
A map is proposed
is proposed in Figure
in Figure 8,
8, which
frequently are reconstructed after application of SfM process. A map is proposed in Figure 8, which
which represents the percentage of 3D body reconstructions which provided
represents the percentage of 3D body reconstructions which provided points for acceptable surface points for acceptable
represents
surface
the percentage The
characterization.
of 3D body reconstructions
map clearly
whichflat
provided points on forthe
acceptable surface
characterization. The map clearly showsshows how wider
how wider flat areas areas localized
localized on the flanks flanks
and on and theon
top
characterization.
theand
topback The map
of theofanimal
and back clearly
are those
the animal shows how
mostmost
are those wider
frequently
frequentlyflat areas localized
reconstructed.
reconstructed. on
ThisThis the
result flanks
indicates
result and
indicates on
thatthat
ontheontop
such
and back
such
animalofportion,
animalthe animal
portion, are those
extracting
extracting body most
body frequently
related
related reconstructed.
parameters
parameters should
should beThis
be more more result
easyeasy indicates
or reliable
or reliable that
afterafter
SfM onSfM
such
point
animal
point portion,
cloud
cloud extracting
extraction.
extraction. These body
Theseanimalrelated
animal parameters
portion
portion is isclearly should
clearlylimited be
limitedbutmore
but can easy or reliable
enlarged in
can be enlarged after
incase SfM
caseofofhigherpoint
higher
cloud extraction.
frequency
frequencyimage
imageThese animal
acquisition
acquisition ratesportion
and
rates and is
is,is, clearly interesting
however,
however, limited but
interesting can
forfor be enlarged
calculation
calculation of of in case of
parameters,
parameters, such higher
suchasas
frequency
hearth
hearth image
girth
girth and acquisition
and animal
animal rates
length,
length, and
which
which is, however,
according
according interesting
to to previous
previous for calculation
studies
studies [11,37,38]
[11,37,38] of
can parameters,
can
bebe linked
linked such
to to body
body as
hearth girthand
condition
condition and
and animal
weight.length, which according to previous studies [11,37,38] can be linked to body
weight.
condition and weight.
Figure 8. Percentage of 3D SfM processes which converged to an acceptable number of points, suitable
forFigure
surface8.characterization.
Percentage of 3D SfM processes which converged to an acceptable number of points, suitable
for surface characterization.
Figure 8. Percentage of 3D SfM processes which converged to an acceptable number of points, suitable
4. Conclusions
4.forConclusions
surface characterization.
In this paper, the structure-from-motion (SfM) photogrammetry technique is discussed and
proposed In as
thisnon-invasive and low-cost approach for
paper, the structure-from-motion three-dimensional
(SfM) photogrammetry reconstruction
technique isofdiscussed
pig body. and
4. Conclusions
Preliminary
proposed tests carried
as non-invasive out
and on a fiberglass
low-cost approachreference model clearlyreconstruction
for three-dimensional show how SfM hasbody.
of pig the
In this
potential topaper,
provide
Preliminary the structure-from-motion
a three-dimensional
tests (SfM)reference
carried out on areconstruction
fiberglass photogrammetry
with amodel technique
consistent is which
resolution,
clearly show how discussed
SfMcan
hasbeand
the
applied
potential
proposed fornon-invasive
as quantitative
to extraction
and of body
provide a three-dimensional
low-cost parameters.
reconstruction
approach However, application
with a consistent
for three-dimensional to live which
resolution,
reconstruction pigs
of pigposes
can be
body.
applied for quantitative extraction of body parameters. However, application
Preliminary tests carried out on a fiberglass reference model clearly show how SfM has theto live pigs poses
potential to provide a three-dimensional reconstruction with a consistent resolution, which can be
applied for quantitative extraction of body parameters. However, application to live pigs posesSensors 2018, 18, 3603 10 of 12
limitations mainly ascribable to the movements (amplitude and frequency) of the animals themselves
during images acquisitions.
As a consequence, specific strategies have to be adopted, in order to minimize the effect of such
movements on the reconstruction process. A possible approach can be based on the increase of the
image acquisition frequency achievable, by way of example, through implementation of multiple
cameras attached to a reference frame in the pig pen area.
Our future work will focus on automating the manual approach of estimations of images,
in order to reduce the processing time required and facilitate the parameter extraction process.
Additionally, further research will be done considering different pig breed-lines and pig barn
environmental conditions.
Author Contributions: Conceptualization, A.P. and F.M.; Methodology, A.P., F.M. and V.M.; Software, F.M., D.Z.
and H.G.; Validation, A.P., F.M. and S.G.; Formal Analysis, V.M.; Investigation, A.P. and V.M.; Resources, F.M.;
Data Curation, A.P. and F.M.; Writing—Original Draft Preparation, A.P., F.M. and V.M.; Writing—Review &
Editing, A.P. and F.M.; Visualization, F.M.; Supervision, A.P. and F.M.; Project Administration, A.P. and F.M.;
Funding Acquisition, A.P. and F.M.
Funding: This research received no external funding.
Conflicts of Interest: The authors declare no conflict of interest.
References
1. Wongsriworaphon, A.; Arnonkijpanich, B.; Pathumnakul, S. An approach based on digital image analysis to
estimate the live weights of pigs in farm environments. Comput. Electron. Agric. 2015, 115, 26–33. [CrossRef]
2. Bracke, M.B.; Metz, J.H.; Spruijt, B.M.; Schouten, W.G. Decision support system for overall welfare assessment
in pregnant sows B: validation by expert opinion. J. Anim. Sci. 2002, 80, 1835–1845. [CrossRef] [PubMed]
3. Nilsson, M.; Herlin, A.; Ardö, H.; Guzhva, O.; Åström, K.; Bergsten, C. Development of automatic
surveillance of animal behaviour and welfare using image analysis and machine learned segmentation
technique. Animal 2015, 9, 1859–1865. [CrossRef] [PubMed]
4. Stookey, J.M.; Gonyou, H.W. The effects of regrouping on behavioral and production parameters in finishing
swine. J. Anim. Sci. 1994, 72, 2804–2811. [CrossRef] [PubMed]
5. Menesatti, P.; Costa, C.; Antonucci, F.; Steri, R.; Pallottino, F.; Catillo, G. A low-cost stereovision system to
estimate size and weight of live sheep. Comput. Electron. Agric. 2014, 103, 33–38. [CrossRef]
6. Wang, Y.; Yang, W.; Winter, P.; Walker, L. Walk-through weighing of pigs using machine vision and an
artificial neural network. Biosyst. Eng. 2008, 100, 117–125. [CrossRef]
7. Apichottanakul, A.; Pathumnakul, S.; Piewthongngam, K. The role of pig size prediction in supply chain
planning. Biosyst. Eng. 2012, 113, 298–307. [CrossRef]
8. Wu, J.; Tillett, R.; McFarlane, N.; Ju, X.; Siebert, J.P.; Schofield, P. Extracting the three-dimensional shape of
live pigs using stereo photogrammetry. Comput. Electron. Agric. 2004, 44, 203–222. [CrossRef]
9. Lee, J.; Jin, L.; Park, D.; Chung, Y. Automatic recognition of aggressive behaviour in pigs using a Kinect
depth sensor. Sensors 2016, 16, 631. [CrossRef] [PubMed]
10. Brandl, N.; Jorgensen, E. Determination of live weight of pigs from dimensions measured using image
analysis. Comput. Electron. Agric. 1996, 15, 57–72. [CrossRef]
11. Pope, G.; Moore, M. DPI Pig Tech Notes: Estimating Sow Live Weights without Scales; Department of Primary
Industries: Queensland, Australia, 2002. Available online: http://www.dpi.qld.gov.au/pigs/8668.html
(accessed on 7 September 2018).
12. Pezzuolo, A.; Guarino, M.; Sartori, L.; González, L.A.; Marinello, F. On-barn pig weight estimation based on
body measurement by means of a Kinect v1 sensor. Comput. Electron. Agric. 2018, 148, 29–36. [CrossRef]
13. Andújar, D.; Dorado, J.; Fernández-Quintanilla, C.; Ribeiro, A. An approach to the use of depth cameras for
weed volume estimation. Sensors 2016, 16, 972. [CrossRef] [PubMed]
14. Dubbini, M.; Pezzuolo, A.; De Giglio, M.; Gattelli, M.; Curzio, L.; Covi, D.; Yezekyan, T.; Marinello, F. Last
generation instrument for agriculture multispectral data collection. CIGR J. 2017, 19, 158–163.Sensors 2018, 18, 3603 11 of 12
15. Wang, Z.; Walsh, K.B.; Verma, B. On-Tree Mango Fruit Size Estimation Using RGB-D Images. Sensors 2017,
17, 2738. [CrossRef] [PubMed]
16. Zhang, H.; Wei, Q.; Jiang, Z. 3D Reconstruction of Space Objects from Multi-Views by a Visible Sensor.
Sensors 2017, 17, 1689. [CrossRef] [PubMed]
17. Han, J.; Shao, L.; Xu, D.; Shotton, J. Enhanced computer vision with Microsoft Kinect sensor: A review.
IEEE Trans. Cybern. 2013, 43, 1318–1334. [PubMed]
18. Kim, J.; Chung, Y.; Choi, Y.; Sa, J.; Kim, H.; Chung, Y.; Park, D.; Kim, H. Depth-Based Detection of
Standing-Pigs in Moving Noise Environments. Sensors 2017, 17, 2757. [CrossRef] [PubMed]
19. Kongsro, J. Estimation of pig weight using a Microsoft Kinect prototype imaging system. Comput. Electron. Agric.
2014, 109, 32–35. [CrossRef]
20. Vranken, E.; Berckmans, D. Precision livestock farming for pigs. Animal Front. 2016, 7, 32–37. [CrossRef]
21. Vázquez-Arellano, M.; Griepentrog, H.W.; Reiser, D.; Paraforos, D.S. 3-D Imaging Systems for Agricultural
Applications—A Review. Sensors 2016, 6, 618. [CrossRef] [PubMed]
22. Jadlovský, J.; Jadlovská, A.; Jadlovská, S.; Čerkala, J.; Kopčík, M.; Čabala, J.; Vošček, D. Research activities of
the center of modern control techniques and industrial informatics. In Proceedings of the 14th International
Symposium on Applied Machine Intelligence and Informatics (SAMI), Herlany, Slovakia, 21–23 January
2016; pp. 279–285.
23. Sansoni, G.; Trebeschi, M.; Docchio, F. State-of-the-art and applications of 3D imaging sensors in industry,
cultural heritage, medicine, and criminal investigation. Sensors 2009, 9, 568–601. [CrossRef] [PubMed]
24. Jay, S.; Rabatel, G.; Hadoux, X.; Moura, D.; Gorretta, N. In-field crop row phenotyping from 3D modeling
performed using Structure from Motion. Comput. Electron. Agric. 2015, 110, 70–77. [CrossRef]
25. Wróżyński, R.; Pyszny, K.; Sojka, M.; Przybyła, C.; Murat-Błażejewska, S. Ground volume assessment using
’Structure from Motion’ photogrammetry with a smartphone and a compact camera. Open Geosci. 2017, 9,
281–294. [CrossRef]
26. Javernick, L.; Brasington, J.; Caruso, B. Modelling the topography of shallow braided rivers using
Structure-from-Motion photogrammetry. Geomorphology 2014, 213, 166–182. [CrossRef]
27. Dai, F.; Lu, M. Assessing the accuracy of applying photogrammetry to take geometric measurements on
building products. J. Construct. Eng. Manag. 2010, 136, 242–250. [CrossRef]
28. Fathi, H.; Dai, F.; Lourakis, M. Automated as-built 3D reconstruction of civil infrastructure using computer
vision: Achievements, opportunities, and challenges. Adv. Eng. Inform. 2015, 29, 149–161. [CrossRef]
29. Brown, D. Tracker Video Analysis and Modelling Tool, 4.80 version; Open source physics, 2010. Available online:
https://www.compadre.org/osp/items/detail.cfm?ID=7365 (accessed on 23 October 2018).
30. Savio, E.; De Chiffre, L.; Schmitt, R. Metrology of freeform shaped parts. CIRP Ann. Manuf. Technol. 2007, 56,
810–835. [CrossRef]
31. Marchant, J.A.; Schofield, C.P. Extending the snake image processing algorithm for outlining pigs in scenes.
Comput. Electron. Agric. 1993, 8, 261–275. [CrossRef]
32. Schofield, C.P.; Marchant, J.A.; White, R.P.; Brandl, N.; Wilson, M. Monitoring pig growth using a prototype
imaging system. J. Agric. Eng. Res. 1999, 72, 205–210. [CrossRef]
33. Pastorelli, G.; Musella, M.; Zaninelli, M.; Tangorra, F.; Corino, C. Static spatial requirements of
growing-finishing and heavy pigs. Livest. Sci. 2006, 105, 260–264. [CrossRef]
34. Pezzuolo, A.; Guarino, M.; Sartori, L.; Marinello, F. A Feasibility Study on the Use of a Structured Light
Depth-Camera for Three-Dimensional Body Measurements of Dairy Cows in Free-Stall Barns. Sensors 2018,
18, 673. [CrossRef] [PubMed]
35. Pezzuolo, A.; Giora, D.; Guo, H.; Ma, Q.; Guercini, S.; Sartori, L.; Marinello, F. A comparison of low-cost
techniques for three-dimensional animal body measurement in livestock buildings. In Proceedings
of the MetroAgriFor 2018: 1st Workshop on Metrology for Agriculture and Forestry, Ancona, Italy,
1–2 October 2018.
36. Westoby, M.J.; Brasington, J.; Glasser, N.F.; Hambrey, M.J.; Reynolds, J.M. ‘Structure-from-Motion’
photogrammetry: A low-cost, effective tool for geoscience applications. Geomorphology 2012, 179, 300–314.
[CrossRef]Sensors 2018, 18, 3603 12 of 12
37. Shi, C.; Teng, G.; Li, Z. An approach of pig weight estimation using binocular stereo system based on
LabVIEW. Comput. Electron. Agric. 2016, 129, 37–43. [CrossRef]
38. Wang, K.; Guo, H.; Ma, Q.; Su, W.; Chen, L.; Zhu, D. A portable and automatic Xtion-based measurement
system for pig body size. Comput. Electron. Agric. 2018, 148, 291–298. [CrossRef]
© 2018 by the authors. Licensee MDPI, Basel, Switzerland. This article is an open access
article distributed under the terms and conditions of the Creative Commons Attribution
(CC BY) license (http://creativecommons.org/licenses/by/4.0/).You can also read