GLOBAL TRADE REPORT - BATTLING OUT OF SUPPLY-CHAIN DISRUPTIONS
←
→
Page content transcription
If your browser does not render page correctly, please read the page content below

Photo by Jj Ying on Unsplash
ALLIANZ RESEARCH

GLOBAL TRADE REPORT –
BATTLING OUT OF
SUPPLY-CHAIN DISRUPTIONS
09 December 2021
04   Global supply-chain disruptions will remain high until H2 2022

06   Three factors will drive the normalization of trade and supply

10   Inputs from China: Europe is on the weak side of the tug-of-war against the US

14   Global trade outlook for 2022-2023

Allianz Research
Global supply-chain disruptions will remain high until H2 2022, on the back of
renewed Covid-19 outbreaks globally, China’s continued zero-Covid policy and
EXECUTIVE demand and logistic volatility during Chinese New Year. After exceptionally strong
performance since H2 2020, global trade of goods contracted in Q3. We find that
production shortfalls are behind 75% of the current contraction in the global volume
SUMMARY of trade, with the rest explained by logistic bottlenecks. In this context, a soft recovery
in Q4 2021 is likely (+0.8% q/q after -1.1% in Q3 for trade in goods) but there is a risk
of a double-dip in Q1 2022 as volatility in trade flows should remain the norm until
the spring. Looking ahead, three factors will drive the normalization of trade from H2
2022: 1) A cooling down of consumer spending on durable goods, given their longer
replacement cycles and the shift towards sustainable consumption behaviors. 2) Less
acute input shortages as inventories have returned to or even exceeded pre-crisis
levels in most sectors and capex has increased (mainly in the US). 3) Reduced
shipping congestions as capacity increases.
Ana Boata, Global Head of Economic Research
ana.boata@eulerhermes.com When it comes to inputs from China, Europe is on the weak side of the tug-of-war
against the US. Europe is more at risk compared to the US when it comes to the heavy
reliance on intermediate inputs from abroad, due to a lack of capex in production
and shipping capacities. We simulate the impact of a shock represented by the
Chinese slowdown (i.e. a 10% drop in Chinese exports) on EU sector outputs and find
that the sectors that would be hit the hardest are the ones related to metals (basic
Françoise Huang, Senior Economist for Asia Pacific metals and fabricated metal products) and automotive (motor vehicles, trailers and
francoise.huang@eulerhermes.com semi-trailers, transport equipment). Without production capacity increases and
investments in port infrastructure, the normalization of supply bottlenecks in Europe
could be delayed beyond 2022 as demand remains above potential.
Yet, reshoring and nearshoring will remain more talk than walk. Despite supply-chain
disruptions, we find no clear trend of reshoring or nearshoring of industrial activities
Ano Kuhanathan, Sector Advisor and Data Scientist so far. The only exception is the UK, which is likely to have faced disruptions due to
ano.kuhanathan@eulerhermes.com
Brexit. However, protectionism reached a record high in 2021 and should remain ele-
vated, mainly in the form of non-tariff trade barriers (e.g. subsidies, industrial policies).
Overall, we expect global trade in volume to grow by +5.4% in 2022 and +4.0% in
2023, after +8.3% in 2021. But watch out for increased global imbalances: The US will
register record-high trade deficits (around USD1.3trn in 2022-2023), mirrored by a
Antoine Donnay, Economic Assistant
antoine.donnay@eulerhermes.com
record-high trade surplus in China (USD760bn on average). Meanwhile the Eurozone
will also see a higher-than-average surplus of around USD330bn. In terms of export
gains, Asia-Pacific should continue to be the main winner in the next few years (over
USD3trn in 2021-2023). By sector, energy, electronics and machinery & equipment
sectors should continue to outperform in 2022, but the main export winner globally in
2023 should be automotive, thanks to the backlog of work and lower capex in 2021.
2
09 December 2021

                                       Photo by on Unsplash

      +5.4%
Forecast for growth in global trade
                 in volume in 2022.

                                                          3
Allianz Research

    GLOBAL SUPPLY-CHAIN DISRUPTIONS WILL
    REMAIN HIGH UNTIL H2 2022

    Production shortfalls are behind 75%                                   affected by the current Chinese eco-                             clearly that the number of days with
    of the current contraction in global                                   nomic slowdown1, advanced econo-                                 congested traffic over 2020-2021 was
    volume of trade, while logistic bottle-                                mies are suffering more from supply                              much higher than the pre-pandemic
    necks explain the rest. After exception-                               bottlenecks rather than trouble with                             average2 on the back of unforeseen
    ally strong performance since H2 2020,                                 demand.                                                          events (weather-related, the energy
    global trade of goods began to                                                                                                          crunch and the closure of industrial
    contract in July (-1.1% q/q in Q3 2021),                                                                                                factories, as well as the zero-Covid
                                                                           Our China port congestion index (see
    especially in advanced and emerging                                                                                                     strategy).
                                                                           Figure    2),   built    based     on
    economies (see Figure 1). While
                                                                           high-frequency port calls data, shows
    emerging markets remain mainly

     Figure 1: Exports in goods in volume, %3m/3m                                                         Figure 2: China port congestion index

    17                       World exports                                                               100%
                             Advanced economies
    12                       Emerging economies
                                                                                                          80%
                                                                                                                                                                                  84%
     7
                                                                                                          60%                                                         68%
     2
                                                                                                                                                                                              56%
                                                                                                          40%                                             45%
     -3                                                                                                                                       41%
                                                                                                                     31%         33%
     -8                                                                                                   20%

    -13
                                                                                                           0%
    -18                                                                                                           2015       2016          2017          2018     2019        2020         2021
          2015       2016        2017       2018        2019        2020       2021                           Number of days port traffic is fluid       Number of days port traffic is congested

    Sources: CPB, Euler Hermes, Allianz Research                                                           Note: The China port congestion index is a proprietary indicator we have
                                                                                                           created based on the port calls data, using the 4-day difference between
                                                                                                           exports and imports (the number of days a ship stays on average in ports),
                                                                                                           normalized with the average and standard deviation of the pre-crisis period
                                                                                                           (2015-19).
                                                                                                           Sources: UNCTAD AIS database, Euler Hermes, Allianz Research

          1
           See our report China’s great crunch: Causes and consequences, at home and abroad
          2
           Days of congested traffic in 2019 also looks high, probably on the back of weather events and trade tensions. However, it is also important to note that the intensity of congestions was on
          average lower than in 2020-2021.

4
09 December 2021

   Figure 3: Historical variance decomposition on global trade                            Figure 4: Global trade of goods in volume (%y/y) and proxy for
             growth                                                                                 demand-inventories mismatch
  0.06                                                                                      80              Global trade of goods (volume, y/y) - rhs               30%

  0.04                                                                                      60              Change in demand (new orders & backlogs of works) vs.
                                                                                                                                                                    20%
                                                                                                            stocks (manufacturing, y/y) - lhs
  0.02                                                                                      40
                                                                                                                                                                    10%
     0                                                                                      20
                                                                                                                                                                    0%
  -0.02                                                                                      0
                                                                                                                                                                    -10%
  -0.04
                                                                                           -20

                                                                                           -40                                                                      -20%
  -0.06
          Jan-19          Jul-19    Jan-20        Jul-20          Jan-21        Jul-21
                                                                                           -60                                                                      -30%
                   Demand shock    Supply shock      Logistics shock       Total Shock
                                                                                                 08 09 10 11 12 13 14 15 16 17 18 19 20 21 22

  Sources: Euler Hermes, Allianz Research                                                Sources: CPB, IHS Markit, Euler Hermes, Allianz Research

In order to quantify the impact of each                            However, the contraction should be
factor affecting global trade, we                                  temporary, even as renewed global
estimate it as a function of global                                Covid-19 outbreaks, China’s sustained
demand (using US retail sales as a                                 zero-Covid policy and Chinese New
proxy), global supply (i.e. industrial pro-                        Year in February 2022 keep supply
duction) and logistic conditions (i.e. sup-                        bottlenecks high. Looking at the short-
pliers’ delivery times from PMI surveys)                           term outlook, a soft recovery in Q4
using a VAR model. Looking at                                      2021 is likely (+0.8% q/q), as suggested
historical variance decompositions,                                by country-level data that are consid-
which attribute the deviations from the                            ered bellwethers and considering that
baseline forecast of our model to each                             trade volume is c.4% below its trend
factor, we observe that demand shocks                              due to supply issues and port conges-
have      been     mostly     contributing                         tion over the past few months. Exports
positively to global trade growth since                            from China and Japan showed a se-
July 2020. On the other hand, supply                               quential improvement in October, and
had a massive positive impact in sum-                              preliminary November data for South
mer 2020 but since then supply shocks                              Korea exports suggest that recent
have been quite volatile, most likely                              headwinds might be easing. However,
reflecting Covid-19-related hiccups.                               the dynamics of global demand hint
Furthermore, we notice that recent                                 towards a risk of a double-dip in global
logistic shocks have been contributing                             trade in Q1 2022 (see Figure 4) amid
more than in previous periods. In partic-                          the Chinese economic slowdown and
ular, we find that the latest                                      renewed Covid-19 infections in Europe
“unexpected” drop in global trade is                               and the US.
mainly due to supply and logistic
factors. Both had a cumulative nega-
                                                                                                                                                                             Photo by Rosebox on Unsplash

tive effect of -1.2pp on month-on-
month global trade growth in Septem-
ber, with -0.3pp for the logistic factor
and -0.9pp for supply (see Figure 3).

                                                                                                                                                                      5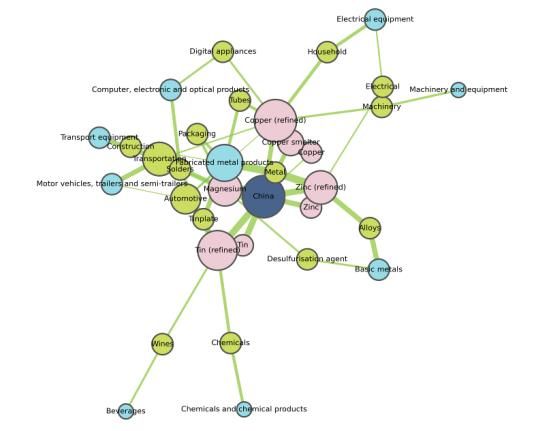
Allianz Research

    THREE FACTORS WILL DRIVE
    THE NORMALIZATION OF TRADE AND SUPPLY

    The ongoing supply-chain disruption is the legacy of mismatches in global demand and supply and shipping capacity that
    began with the Covid-19 outbreak.

    Factor #1: Consumer demand peaked                              self-regulated normalization. This is                               will continue to support consumer
    at unprecedentedly high levels and is                          explained first by the fiscal stimuli in                            demand well into 2022 and 2023. In
    likely to remain above trend, as excess                        reaction to Covid-19, which supported                               the US, we expect the saving rate to
    savings created during the crisis are                          demand rather than supply, especially                               reach its pre-crisis level (7.3% of dispos-
    not likely to be depleted by 2023. The                         in the advanced economies where gov-                                able income) towards the end of 2022,
    replacement cycle of durable goods                             ernments have deployed fiscal and                                   as the recovery in labor markets will
    shows that the peak of supply-chain                            monetary support equivalent to about                                support household purchasing power
    bottlenecks should have passed. The                            25% of GDP. While this support is                                   (see Figure 5). In Europe, excess
    demand side of global trade has been                           gradually being phased out, fiscal                                  savings are likely to support private
    well above potential and should                                policies will remain very accommoda-                                consumption by 0.9% of GDP in 2022
    remain at a high level in the coming                           tive in the US, Eurozone and China. In                              and 0.5% in 2023 after 1.4% in 2021
    year, gradually going through a                                addition, households’ excess savings                                (see Figure 6).

    Figure 5: US household savings (USDbn and % of disposable income)                         Figure 6: Expected boost to private consumption from remaining
                                                                                                        excess savings (as of mid-2021, latest available data),
                                                                                                        % of GDP
      7000                Nominal household savings (lhs)                                40   2.5%
                                                                                                                                                                                              2021        2022              2023
                                                                             Forecasts

      6000                Saving as % of disposable income (rhs)                         35
                                                                                              2.0%
                                                                                         30
      5000
                                                                                         25   1.5%
      4000
                                                                                         20   1.0%
      3000
                                                                                         15
      2000                                                                                    0.5%
                                                                                         10
      1000                                                                               5    0.0%
                                                                                                                                      France

                                                                                                                                                                                                                             Sweden
                                                                                                     UK

                                                                                                          Italy

                                                                                                                  Eurozone

                                                                                                                             Norway

                                                                                                                                                         Netherlands

                                                                                                                                                                                               Poland
                                                                                                                                               Belgium

                                                                                                                                                                                         EU
                                                                                                                                                                       Germany

                                                                                                                                                                                 Spain

                                                                                                                                                                                                        Austria

                                                                                                                                                                                                                                      Czechia
                                                                                                                                                                                                                  Denmark

         0                                                                               0
             80 82 84 86 88 90 92 94 96 98 00 02 04 06 08 10 12 14 16 18 20 22

    Sources: Refinitiv, Euler Hermes, Allianz Research                                        Sources: Eurostat, ONS, Euler Hermes, Allianz Research

6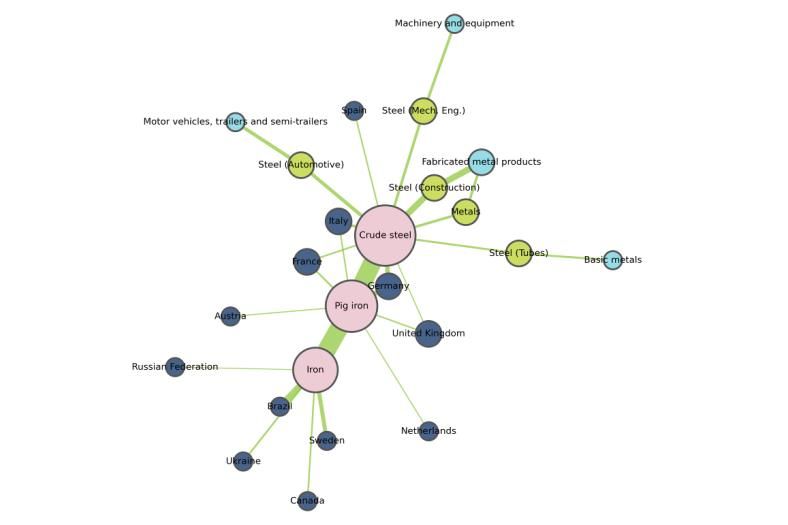
09 December 2021

Second, the impressive household                                                    renewed Covid-19 outbreaks. Indeed,                      mies. However, we do see risks tilted
spending shift towards (durable) goods                                              the replacement cycle of durable                         towards an earlier-than-expected tight-
rather than services (see Figure 7), in                                             goods is several years (see Figure 10)                   ening of the policy mix, which could
the context of curfews and lockdowns,                                               and households are moving towards                        make demand nosedive.
should be much more timid going for-                                                more sustainable consumption pat-
ward, even in a downside scenario of                                                terns, especially in advanced econo-

  Figure 7: Domestic household consumption in advanced                                                          Figure 8: Replacement cycle of selected goods (number of years)
            economies (100 = average over 2010-2019)
 135                                                                                                           20
                              Total domestic household consumption                                                            US
 125                          Durable goods                                                                    15             Western Europe
                              Non-durable goods
                              Services
 115                                                                                                           10

                                                                                                               5
 105

                                                                                                               0
  95

  85
       10       11       12       13       14        15       16   17      18     19      20   21

 Sources: OECD, Euler Hermes, Allianz Research                                                                  Sources: Multiple sources, Euler Hermes, Allianz Research

Factor #2: Inventories have reached                                                levels as soon as October 2020 (see                   The electronics, computers & telecom
pre-crisis levels and output capacity                                              Figure 9). The input shortage was                     and household equipment sectors in
will rise, thanks to increases in capex,                                           particularly high in Europe in 2021, and              particular were able to significantly
mainly in the US. After destocking at                                              to a lower extent in North America. The               increase their inventories despite semi-
the height of the Covid-19 crisis in early                                         good news is that the urgency to                      conductor shortages. The automotive
2020, manufacturers had to quickly                                                 restock has clearly peaked over the                   sector also managed to add invento-
restock in order to cope with the                                                  past few months (see Figure 10) and                   ries, though less successfully due to
unprecedented rebound in demand in                                                 the level of inventories is already                   higher difficulties in accessing semicon-
advanced economies (+22% from                                                      above pre-crisis long-term averages                   ductors and higher costs of accumulat-
trough to peak, and return to pre-crisis                                           among most sectors (see Figure 11).                   ing produced goods.

  Figure 9: Import in volume, 100 = pre-crisis peak during the                                                  Figure 10: Input stock urgency* in the manufacturing sector
             Global Financial Crisis and the Covid-19 crisis                                                              (positive = urgency to stock)
 120
                                                                                                                17
 115
                                                                                                                12
 110
 105                                                H2 2020                                                         7
 100                                                                                                                2
  95                                                                                                                -3
  90
                                                                                                                    -8
  85
                                                                                                                -13
  80                                                                                                                                               North America
  75                                                                                                            -18
                                                                                                                                                   Eurozone
  70                                                                                                            -23                                Asia
            1   2    3    4   5        6   7    8     9 10 11 12 13 14 15 16 17 18 19 20 21 22                                                     World
                                                                                                                -28
                         United States (Covid-19)                       United States (GFC)                              07   08   09   10    11   12   13   14    15   16   17   18    19   20   21   22
                         Euro Area (Covid-19)                           Euro Area (GFC)
                         Emerging economies (Covid-19)                  Emerging economies (GFC)

                                                                                                                * Quantity of purchases – Stocks of purchases
 Sources: CPB, Euler Hermes, Allianz Research                                                                   Sources: IHS Markit, Euler Hermes, Allianz Research

                                                                                                                                                                                                       7
Allianz Research
Unlike in Europe, additional supply (e.g. computers and machinery and higher demand. We see a potential for
could fix the current shortages sooner equipment) are exhibiting higher a catch-up in investment in Europe in
in the US, given the increases in capex capex than the pre-pandemic long- 2022 (and later on in production
in 2021. To understand where new term averages despite high levels of capacity), given favorable funding
production capacities stand in the US capacity utilization. European compa- conditions and elevated corporate
and Europe, we look at capex and nies seem comparatively less cash positions. Most surveys show that
capacity utilization rates (see Figure advanced in their investment cycle, a majority of companies have delayed
12). Generally speaking, investment with capex below normal levels, and investment decisions in 2021 due to
efforts are higher in the US than in they rather rely on above-normal ca- supply-chain bottlenecks and input
Europe. Indeed, some sectors in the US pacity utilization rates to respond to shortages.
Figure 11: Global sector inventories (average 2010-2019 =100) Figure 12: Capex vs capacity utilization rates in the US and Europe
Automotive 10
Transportation
Transport equipment Computers
Change in capacity utlization rate vs 2010-2019 average
8 Chemicals
Transport
Textiles
6
Retail
Pharmaceuticals
Paper
4 Machinery &
Metals equipment
Machinery & equipment 2
Software & IT services
Household equipment 0
Energy -50 0 50 100 150 200
Electronics -2
Construction
Computers & Telecom -4 Textile
Chemicals
Automotive suppliers -6 Europe
Automotive manufacturers Automotive
Agrifood -8 US
WORLD
60 80 100 120 140 160 180 -10
2020 Q3 2021 Q3
Q3 2021 Capex vs 2010-2019 average
Sources: Refinitiv, Euler Hermes, Allianz Research Sources: national sources, Euler Hermes, Allianz Research
Factor #3: Shipping congestions The rapidly growing new transporta- The US is planning USD17bn of
should be less acute as capacity is in- tion capacity orders (see Figure 13) additional spending on port infrastruc-
creasing: global orders for new con- should turn operational towards the ture and waterways3 and USD25bn on
tainer ships have reached record highs end of 2022, which should significantly airports to address repair and mainte-
over the past few months, amounting ease shipping bottlenecks (we esti- nance backlogs, reduce congestion
to 6.4% of the existing fleet, while the mate that c.4% of the volume of global and emissions and drive electrification
US will spend USD17bn on upgrading trade is currently blocked due to ship- and other low-carbon technologies.
its port infrastructure. In the short-term, ping constraints). Another factor that Indeed, over the past decade, both the
we expect shipping costs to gradually could help unclog shipping bottlenecks US and Europe have lagged in terms of
decline from Q4 2021, in line with the is port capacity. After all, adding ships the quality of port infrastructure, which
futures markets for shipping, after without increasing the infrastructure to has constantly missed the “well devel-
peaking in September 2021 at levels load and unload them would still lead oped and efficient by international
six to seven times higher than before to congestions. Industry data show that standards” mark assigned by the
the Covid-19 crisis. However, they will it now takes three times longer to clear World Bank (see Figure 14). Europe is
remain at elevated levels in 2022. vessels at Los Angeles and Long still lacking large-scale infrastructure
Beach, bringing the waiting time to investment plans (see Figure 15), which
7-12 days. This compares with up to 6 will maintain its vulnerability to supply-
days in Rotterdam, and 1-3 days at chain shocks in the long term, given its
large Chinese ports. dependency on inputs from abroad,
especially Asia.
3
https://www.whitehouse.gov/briefing-room/statements-releases/2021/11/09/fact-sheet-the-biden-harris-action-plan-for-americas-ports-and-waterways/
809 December 2021
Figure 13: New orders of container ships (12-month rolling sum, as % of Figure 14: Quality of port infrastructure, WEF (1=extremely underdevel
existing fleet) oped to 7=well developed and efficient by international
standards)
10% 8 Well developed and efficient
by international standards
8% 7
6 Advanced economies average
6% 5
4% 4
2% 3
2
0% 1
-2% 0
Netherlands
United Kingdom
France
Italy
Belgium
United States
Germany
China
-4%
-6%
-8%
-10%
08 09 10 11 12 13 14 15 16 17 18 19 20 21 2007 2017
Sources: Bloomberg, Euler Hermes, Allianz Research Sources: World Bank, Euler Hermes, Allianz Research
Figure 15: EU: Recovery and Resilience Fund grants (main investment
categories, % of total)
40 Advanced Europe
35 Emerging Europe
30
25
20
15
10
5
0
Labor Market
Education
R&D
Other Public
& Governance
Infrastructure
Climate Policy and
Healthcare
Social Inclusion
Agriculture
Digitalization
Public Admin.
Energy Transition
Investment
System
Sources: : European Commission, Euler Hermes, Allianz Research
9Allianz Research
INPUTS FROM CHINA:
EUROPE IS ON THE WEAK SIDE OF THE
TUG-OF-WAR AGAINST THE US
Stimulating demand in Europe without household equipment, consumer reliant on intermediate inputs. Only
fixing supply issues can only be infla- electronics, automotive and machinery nine sectors in the US, eight in Germa-
tionary. Europe is more at risk and equipment sectors are most vul- ny, six in France and seven in the UK
compared to the US when it comes to nerable to input shortages. Using the have a FL above one. Using these two
the heavy reliance on intermediate OECD 2018 Input-Output tables, we metrics, we can group sectors into four
inputs from abroad. In the absence of compute the Hirschman–Rasmussen segments: “key” sectors that have BL
production capacity increases and Backward Linkages (BL) and Forward and FL above one, “weak” sectors that
investments in port infrastructure, the Linkages (FL) indices4. In our sample have BL and FL below one, forward-
normalization of bottlenecks in Europe including 23 sectors, 14 have a BL oriented sectors that have BL below
could be delayed beyond 2022 if above one in the US, 16 in Germany, 17 one but FL above one and backward-
demand remains above potential (our in France and 12 in the UK. This means oriented sectors that have BL above
baseline scenario). More precisely, the that a majority of sectors are heavily one and FL below one (see Figure 16).
Figure 16: Hirschman-Rasmussen BL-FL indices
3.5
Forward-oriented sectors "Key" sectors
3 Wholesale Financial
and Retail services
2.5 Electricity & gas
Forward Linkages
USA
2
DEU
FRA
1.5 GBR Food and
beverages
1
0.5
"Weak" sectors Backward-oriented sectors
0
0.5 0.75 1 1.25 1.5
Backward Linkages
Sources: OECD, Euler Hermes, Allianz Research
4
See Hirschman–Rasmussen Backward Linkages (BL) measure the intensity of intermediate inputs. They indicates that a sector demands inputs from other sectors in order to produce. If the BL
index for a specific sector is above one, it means that a change in demand for that sector will increase output in the rest of the economy. Symmetrically, the Forward Linkages (FL) shows an
economic activity that supplies intermediate inputs to the rest of the economy. A sector with an FL index above one will benefit more than others if there is a positive demand shock in all
sectors.
1009 December 2021
Interestingly a number of sectors are chain tensions: In many industrial sec- Semiconductors are the one key input
backward-oriented in France, Germany tors, demand has been exceptionally for all the sectors. Asia-Pacific countries
and the US: food and beverages, tex- strong since Q3 2020 as sectors were account for about 90% of global semi-
tiles, paper, machinery and equipment either making up for the lost time of H1 conductor exports and a handful of
and automotive. In the UK, the automo- 2020 or enjoying booming consumer countries account for over 70% of glo-
tive, paper, chemical products, mining spending on goods. Looking at our pa- bal production capacities (Japan, South
and air transport sectors are backward- nel of European and US corporates, we Korea, China and Taiwan), which
oriented. find that 10 of the 17 sectors analyzed makes the global manufacturing sector
Although many sectors are input inten- will emerge from 2021 with both sales very vulnerable to any hiccups. Taiwan,
sive, and firms across all sectors in Eu- and profits exceeding their pre- the global leader in semiconductor pro-
rope and the US have reported higher- pandemic levels in Europe and those ducts, recently increased production,
than-average supply constraints, only a figures even climb up to 13 out of 17 for which should allow shortfalls to cool
few face very severe shortages: Ma- the US. However, we should note that down. Looking more closely, despite
chinery and equipment, automotive, the automotive sector, which has been volumes higher than in pre-pandemic
consumer electronics and household severely hit by shortages, is still in reco- years, we see that Asia and the US ma-
equipment report tensions way above very on both sides of the Atlantic. nage to get theirs hands on more semi-
the average of the entire manufactu- Consequently, the party could be spoi- conductor products than Germany, the
ring sector. At the other end of the spec- led for household equipment, machine- leading industrial country in Europe. In
trum, sectors such as food, metals or ry and equipment and consumer elec- the short run, the world should count
paper are experiencing shortages lo- tronics, which are benefiting from the more on the increase in semiconductor
wer than the manufacturing average5. post-pandemic boom, while the recove- production capacity from Taiwan rather
ry of the automotive sector could be than the US, Europe or China (see Fi-
As mentioned earlier, demand also
challenged by the current backdrop. gure 17).
plays a key role in the ongoing supply-
Figure 17: Summary of industrial policies related to semiconductors in major economies
Sources: national sources, Euler Hermes, Allianz Research
5
For more details on supply chain disruptions, see our report The big squeeze: supply disruptions pressure manufacturing margins in the US and Europe
6
See our report Semiconductor realpolitik: A reality check for Europe
11Allianz Research
China is a key downside risk for Eu- from its import origin to its use in a produce/use them. This enables us to
rope: We estimate that a 10% drop in manufacturing sector (see Figure 18). understand the linkages across sectors
EU imports from China could be a drag Countries represented by the dark blue and countries7.
of more than -6% on the metal sector, scatter points export a given raw mate- To illustrate, we look at the case of
more than -3% on the automotive sec- rial, represented by the pink scatter copper. Chile and China are two im-
tor (incl. transport equipment) and points; the size of the link corresponds portant partners: Chile accounts for
more than -1% on computer and elec- to the share the country represents in about a third of copper imports and
tronics. We replicate Nuss & Ciuta total EU imports. Raw materials are 10% of copper smelter imports while
(2018) to visualize the supply chains of then processed into other materials or China accounts for about 30% of cop-
some key industrial raw materials from used in products (green scatter points). per smelter imports in the EU. Close to
the EU perspective, namely aluminum, The size of the link corresponds to the 20% of copper is used in the production
lithium, iron ore, copper, tin, zinc and share the material represents in the of tubes that are then used in/made by
magnesium. The resulting visualiza- product. Products are then linked to the fabricated metals product sector.
tions allow us to map a raw material sectors (light blue scatter points) which
Figure 18: Visualization of EU supply chains for copper
Sources: Eurostat, Euler Hermes, Allianz Research
Taking a country perspective and fo- metals and fabricated metal products) Despite these vulnerabilities, reshoring
cusing on China within our commodi- and automotive (motor vehicles, and nearshoring will remain more talk
ties universe, we notice that the country trailers and semi-trailers, transport than walk. Our 2020 supply chain
is pivotal for Europe for tin, copper, equipment). However, we should note survey8 showed actual intentions for
zinc and magnesium (see Figure 19). that this impact implies that firms can- reshoring were not that widespread
Using this network, we estimate elastic- not substitute China for other suppliers among companies in the US and Eu-
ities and simulate the impact of a for these raw materials. In addition, the rope. In fact, looking at indices of dis-
shock represented by the Chinese impact could be stronger through tance-weighted imports (see Figure 21)
slowdown between 2015-2016 and Q1 intermediary goods imported from to see if goods are sourced from closer
2020 (i.e. a 10% drop in Chinese China as well. locations, we find no clear trend of
exports) on EU sector outputs (see reshoring or nearshoring of industrial
Figure 20). Overall, we see that the activities (apart from the UK, which
sectors that would be hit the hardest may have been subject to disruptions
are the ones related to metals (basic related to Brexit).
7
The size of the link represents the share of the product in the sector’s input. The size of scatter points measures interconnectedness and is determined by the number of links to other
points. For clarity, we did not include countries that represent less than 5% of raw material imports.
12 8
See our report Global supply-chain survey: In search of post-Covid-19 resilience09 December 2021
Figure 19: Visualization of EU links with China for selected raw materials Figure 20: Impact of a 10% drop in imports from China on output
Sectors Impact
Basic metals -2.5%
Beverages -0.6%
Chemicals and chemical products -0.8%
Computer, electronic and optical products -1.2%
Electrical equipment -0.8%
Fabricated metal products -6.3%
Machinery and equipment -0.3%
Motor vehicles, trailers and semi-trailers -3.3%
Transport equipment -3.2%
Sources: Eurostat, Euler Hermes, Allianz Research Sources: Euler Hermes, Allianz Research
Figure 21: Distance-weighted imports
100000
80000
US ↑Imports sourced further
Germany
60000 UK
France
40000
20000
0
-20000
-40000
-60000
↓ Imports sourced closer
-80000
Aug-19 Feb-20 Aug-20 Feb-21 Aug-21
Sources: Euler Hermes, Allianz Research
Looking at US-China relations in Regional Comprehensive Economic However, protectionism reached a
particular, we see a low likelihood of Partnership (among ASEAN+5) will record high in 2021 and should remain
escalation in the trade tariff dispute enter into force on 1 January 2022 and elevated, mainly in the form of
after purchase commitments of the could further increase regional integra- non-tariff trade barriers (e.g. subsidies,
Phase One Deal expire in 2022, as long tion in Asia at the expense of the US industrial policies).
as supply-chain bottlenecks remain. and Europe.
This is even more important as the
13Allianz Research
GLOBAL TRADE OUTLOOK
FOR 2022-2023
We expect global trade in volume to imbalances: The US will register record- half of these gains is likely to be
gradually return to its pre-crisis long- high trade deficits (around USD1.3trn achieved in 2021, followed by gains
term average, with growth at +5.4% in in 2022-2023), mirrored by a record- amounting to USD630bn in 2022 and
2022 and +4.0% in 2023, after +8.3% in high trade surplus in China (USD760bn USD710bn in 2023. European export-
2021. And while acute input shortages on average). Meanwhile the Eurozone ers’ performance in aggregate terms
coupled with higher shipping costs and will also see a higher-than-average over 2021-2023 could be similar to that
a strong dollar pushed up price effects surplus of around USD330bn. of Asia-Pacific, although these gains
in 2021 (growth in value terms In terms of export gains (see Figure 23), follow a much sharper contraction in
expected at +18.8% in 2021), we Asia-Pacific should continue to be the exports in 2020. Finally, North
expect this trend in price growth to main winner in the coming few years, America’s export gains are expected to
reverse in 2022 to below 2017-18 highs with gains adding up to more than reach close to USD800bn over 2021-
(see Figure 22). USD3trn over 2021-2023 (after an 2023 (after a close to USD500bn loss in
But watch out for increased global USD420bn loss in 2020). More than 2020).
Figure 22: Global trade growth (%) Figure 23: Trade by region, yearly change (USDbn)
18.8%
20%
Volume Price Value
Asia-Pacific
15%
10.0% Western Europe
10% 9.4% 7.2%
3.4% 4.2%
Central and Eastern Europe
5% 5.8%
3.0% 2.5% 8.3%
2.9% 5.4% 4.4% 0.7% 5.4% 4.0% Latin America
0%
1.7%
2020
-2.0%
-1.5% North America 2021E
-5% -8.1%
Middle East 2022E
-10%
-10.7%
-9.9%
Africa 2023E
-15%
-20%
-1000 -500 0 500 1000 1500 2000 2500 3000 3500
13 14 15 16 17 18 19e 20f 21f 22f 23f
Sources: Euler Hermes, Allianz Research Sources: Euler Hermes, Allianz Research
1409 December 2021
At a sector level, price effects are not in 2022, in particular the energy, to the backlog of work and lower
fading everywhere despite base electronics and machinery & equip- capex in 2021 (see Figure 24).
effects. The outperformers of 2021 ment sectors. The main export winner
should continue to see strong exports in 2023 should be automotive, thanks
Figure 24: Trade by sector, yearly change (USDbn)
Energy
Chemicals
Machinery&Equipment
Textiles
Computers&Telecom
Household Equipment
Automotive manufacturers
Construction
2022 2023
Automotive suppliers
0 50 100 150 200 250
Sources: Euler Hermes, Allianz Research
Photo on Unsplash
15Allianz Research
RECENT PUBLICATIONS
08/12/2021 Jostle the colossal fossil: A path to the energy sector transition
03/12/2021 Monetary policy: Omicron management & beyond
01/12/2021 Global FX volatility: still waters run deep
25/11/2021 Chinese capital markets: the panda in the room
21/11/2021 US retail: a not so black Friday for consumers
18/11/2021 Corporate credit: life after policy support
17/11/2021 The middle-income trap: inequality across countries after Covid-19
12/11/2021 Diabetes and Covid-19: The silent 45 billion euro problem
09/11/2021 The EU utility transition: A pathway powered by solar and wind
05/11/2021 Wrapping up? How paper and board are back on track
03/11/2021 Transport in a zero-carbon EU: Pathways and opportunities
02/11/2021 United Kingdom: Trapped by policy choices
28/10/2021 The big squeeze: Supply disruptions pressure manufacturing margins
21/10/2021 IPOs: turbocharged by private equity
20/10/2021 Energy prices & inflation: Backwardation keeps inflation expectations anchored
15/10/2021 China’s great crunch: causes and consequences, at home and abroad
11/10/2021 Energy prices in Europe: (a costly) winter is coming
07/10/2021 Allianz Global Wealth Report 2021
06/10/2021 Global Insolvencies: We'll be back
01/10/2021 Money supply, saving & hoarding: What you see is not what you get
28/09/2021 Eurozone: Reflation is not stagflation
23/09/2021 How to future-proof the German Wirtschaftswunder (allianz.com)
22/09/2021 Climate policy: Time for a "blood, toil, tears and sweat" speech
17/09/2021 Global economy: A cautious back-to-school
15/09/2021 European food retailers: The bitter digital aftertaste of the Covid-19 legacy
09/09/2021 Life after death: The phoenix-like rising of Japan´s life industry
08/09/2021 Export performance in Europe: a sink or swim game
02/09/2021 ECB: Roaring reflation no reason to flinch
01/09/2021 European SMEs: 7-15% at risk of insolvency in the next four years
30/07/2021 Europe´s pent-up demand party is just getting started
28/07/2021 Australia´s pension system: No reform can replace financial literacy
Discover all our publications on our websites: Allianz Research and Euler Hermes Economic Research
16OUR TEAM
17Director of Publications: Ludovic Subran, Chief Economist
Allianz and Euler Hermes
Phone +49 89 3800 7859
Allianz Research Euler Hermes Economic Research
https://www.allianz.com/en/ http://www.eulerhermes.com/economic-
economic_research research
Königinstraße 28 | 80802 Munich | 1 Place des Saisons | 92048 Paris-La-Défense
Germany Cedex | France
allianz.research@allianz.com research@eulerhermes.com
allianz euler-hermes
@allianz @eulerhermes
FORWARD-LOOKING STATEMENTS
The statements contained herein may include prospects, statements of future expectations and other forward -looking
statements that are based on management's current views and assumptions and involve known and unknown risks and
uncertainties. Actual results, performance or events may differ materially from those expressed or implied in such forward -
looking statements.
Such deviations may arise due to, without limitation, (i) changes of the general economic conditions and competitive situa-
tion, particularly in the Allianz Group's core business and core markets, (ii) performance of financial markets (particularly
market volatility, liquidity and credit events), (iii) frequency and severity of insured loss events, including from natural ca-
tastrophes, and the development of loss expenses, (iv) mortality and morbidity levels and trends, (v) persistency levels, (vi )
particularly in the banking business, the extent of credit defaults, (vii) interest rate levels, (viii) currency exchange rat es
including the EUR/USD exchange rate, (ix) changes in laws and regulations, including tax regulations, (x) the impact of
acquisitions, including related integration issues, and reorganization measures, and (xi) general competitive factors, in
each case on a local, regional, national and/or global basis. Many of these factors may be more likely to occur, or more
pronounced, as a result of terrorist activities and their consequences.
NO DUTY TO UPDATE
The company assumes no obligation to update any information or forward -looking statement contained herein, save for
any information required to be disclosed by law.
18You can also read