The Great Indian Gastro - Economy Succeeding In India With Investments In The Food Industry - Avalon Consulting
←
→
Page content transcription
If your browser does not render page correctly, please read the page content below
The Great Indian Gastro - Economy Succeeding In India With Investments In The Food Industry
"Avalon Consulting would like to acknowledge and thank Mandala Capital and IMC Chamber of Commerce and Industry
              for their support and co-sponsorship of The Investors Meet at New York, providing an opportunity
                                 to share the prospects of the Indian Food Processing Sector".

                               IMC
                       Chamber of Commerce and Industry

2
TABLE OF
  CONTENTS

India: An Investment Destination Of Choice.......................................................................... 6
     -A Demographic Eldorado
     -Rise Of The Middle Class
     -Changes In Lifestyle And Customer Preferences
     -Growth In Modern Retail And E-Commerce

About Time: Investment In Food & Agri-Business In India......................................................11
    - Stellar Sector Performance
    - Impetus From Government Reforms

Opportunity Hotspots: Sub-Sectors In F&B.......................................................................... 15
    - Lucrative Sectors In F&B
    - Opportunities In Food Services: Hotels, Restaurants And Catering
    - Opportunities In Allied Sectors And Agri-Business

Investment Landscape In The Food & Agri-business Industry In India................................... 22
     - Resurgent Private Equity Eco-System
     - Proof Of The Pudding: Why Food & Agri-business Is Attractive

Conclusion: What Can Investors Do To Benefit From The India Growth Story?........................ 25

                                                                                                                         3
FOREWORD

    F   ood has changed and so has the way we consume it. The fruit we eat at breakfast could have
        been grown on another continent, cooking food could mean only mixing and processing the
    ingredients of a packet, or simply warming an already cooked packet of our favorite meal.

    The food industry has opened up an entire spectrum of possibilities from how food is grown, to
    how it is sourced, processed, packaged and served. Genetic engineering has made it possible to
    improve crop yield, even create pest-resistant strains of food. Robotic machines can reap and
    process crop produce several times faster than the manual process. Food packaging has made
    it possible to preserve and transport food to far-off destinations. There are farms growing food
    on vertical walls to optimize space.

    The food and agri-business in India is ripe for such innovation in product development,
    technology integration and process excellence. Half of India's land is arable as compared to
    the global average of a tenth. A huge agricultural base coupled with one of the world's largest
    populations of employable human capital, makes India, the sixth largest economy in the world,
    an investors' haven.

    One of the apprehensions of doing business in India for foreign investors has been administrative
    challenges. However, that is fast changing. There is a clear focus from the government to
    enable foreign investments. This is reflected in the marked improvement in India's ranking on
    the "Ease of Doing Business" index. The government is also specifically focused on food and
    agri-business and is implementing several initiatives to support it. The returns gained by early
    investors in this space are an indicator of the promise this sector holds for future investors.

    Mandala Capital together with Avalon Consulting has prepared this report to demonstrate
    the opportunities offered by the food and allied businesses in India for foreign investors. The
    paper takes a deep dive into key aspects of the opportunity such as demographics, sub-sectors,
    industry performance and investment landscape.

4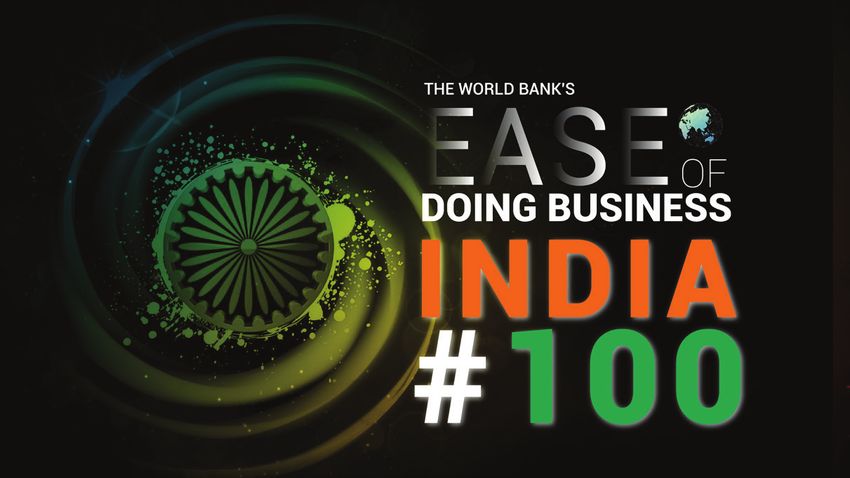
EXECUTIVE
  SUMMARY

  As India gears up to become the third largest economy in the world by 2030, it offers significant
opportunities for investors to gain from and contribute to this growth story.

   India's demographic dividend provides an unparalleled strategic advantage to businesses. India
has almost one-fifth of the world's people between the ages of 15 and 64 years, giving it a large
base of employable human capital and customers. India will be the world's youngest country in 2020
with an average age of 29. A large base of millennial customers who are known to spend on new
experiences augurs well for business growth in the food industry.

   Food and agri-business in India have been among the best performing sectors with respect to
value creation and returns generated. The government has implemented several policies to boost
business. The impact is visible in the significant improvement in India's ranking on "Ease of Doing
Business". Many initiatives specific to food and agri-business are being implemented across the
continuum from mega food park schemes to R&D and skill development.

   The food industry has investment hotspots across many sub-sectors, allied sectors, agri-business
and food services. The opportunity ranges across packaged food, fruits and vegetables, warehousing,
food packaging, contract farming, food ingredients, etc. Demographic and lifestyle changes along
with increasing purchasing power will drive growth in processed food, meat, poultry and dairy.
There is also significant opportunity for new product development and technology integration.

   Private equity and venture capital investments have experienced positive growth. The investment
in food and agri-business sector has tripled in the last 10 years. There have been several successful
and sizeable exits. The sector has also witnessed notable acquisitions and partnerships.

  This is the right time for investors to enter the food and agri-business in India to capture the
share of market of what is clearly a high growth area in an investor-friendly eco-system.

                                                                                                    5
INDIA
An Investment Destination Of Choice
INDIA
An Investment Destination Of Choice
1. India is expected to reach a GDP of $10 trillion by 2030, making it the world's third largest
economy by 2030, after China and USA
2. The pyramid structure of the Indian economy will transition to a diamond structure
due to the rising middle class with a higher disposable income and an appetite for
various food products
3. Set to be the world's youngest country in 2020, India has a sizable population
of millennials keen on new food experiences
4. Demographic and lifestyle shifts are changing food consumption patterns;
demand for Ready-To-Eat (RTE), Ready-To-Cook (RTC), premium and
specialty food is on the rise
5. The rise in demand has fuelled growth in modern retail and
e-commerce in India
6. Business leaders across large global and Indian food
companies are already investing heavily to take advantage
of the growth of the food industry in India
6INDIA
An Investment Destination Of Choice
A DEMOGRAPHIC ELDORADO
India's demographic dividend is a story that has been told often.
The size of opportunity
Soon to be the world's youngest country in 2020, India offers the dual here means we need to
advantage of a sizeable human capital and large consumer base.
double our business. The
Economically, India is currently the world's sixth largest economy
with a GDP of $2.6 trillion. It will become the world's third largest
aim is to continue to grow in
economy by 2030, with a forecasted real GDP growth of CAGR 7% double digits
approximately.
- Regional President and CEO, PepsiCo India
Top 10 GDPs in the world, 2017 & 2030 ($ Tn)
CAGR Rank
(2017-30) 2017 2030
United States 33.0 4.2% 1 2
19.4
China 34.3 8.4% 2 1
5.1 12.0
Japan 4.9 0.3% 3 4
4.7
Germany 3.7 1.9% 4 5
United Kingdom 4.6 4.4% 5 6
2.6
India 10.1 11.0% 6 3
2.6
3.3
France 2.6
1.9% 7 9
3.4 At a Real Growth of
Brazil 3.9% 8 8
2.1 7%, India’s GDP
2.4
Italy
1.9
would be $6.3 Tn 1.6% 9 13
2.8
Canada 4.0% 10 10
1.7
2030 2017
Countries Expected
to Rise in Ranking
Source: World Bank, Morgan Stanley, CEBR Forecasts
Demographically, India has the world's second largest population at Geographically, 53% of India's land is arable as compared to the world
1.2 billion. By 2027, India will have 18.6 % of the world's 15 to 64-year- average of 10.9%.
olds, making it the country with the highest working age population.
This would result in a large section of earning population with a higher India offers unparalleled demographic advantage that can be
demand for food products. leveraged by businesses to create value and returns.
7INDIA
An Investment Destination Of Choice
RISE OF THE MIDDLE CLASS
The opportunity in food in India is India is predicted to undergo a marked shift in population distribution
by 2031. BARC (Broadcast Annual Research Council India) categorizes
huge, with a population of 1.3 billion SECs (Socio-Economic Classes) based on ownership of "discriminating
people, emerging middle class, a durables" which are indicative of the purchasing power and education
youth segment larger than the entire level. Between 2021 and 2031, population level is expected to grow at
CAGR of 7-8% for SEC A, 4-5% for SEC B, 1-2% for SECs C and D and
population of the US, and increasing negative growth in SEC E. The growing middle class is expected to
rate of urbanization. The opportunity alter the population distribution from a pyramid to a diamond.
for providing nutritious, safe and
tasty food to over one billion people
must be addressed
- Global President, Foods, Unilever
Shift in distribution of Socio-Economic Classes (SECs) in India
Population distribution Population distribution Population distribution
SEC
– 2011 (Mn) – 2021 (Mn) – 2031 (Mn)
CAGR CAGR
A1 & A2 26.4
6% 47.3 8% 102.1
(2.2%) (3.4%) (6.4%)
38.4 7%
A3 (3.2%)
6.5% 72.1 141.8
(5.2%) (9%)
115.2 6.5 % 216.2 335.8
B1 & B2 (9.6%) (15.5%)
4.5 % (21.2%)
498 607.1 704.5
C1,C2, D1 & D2 (41.5%) 2% (43.6%) 1.5% (44.5%)
522 448.8
E1,E2 & E3 (43.5%)
-1.5% (32.3%)
-4% 298.4
(18.9%)
Overall, the purchasing power of the Indian customer is increasing between India and other developed nations.
which is a lead indicator of greater consumption. FAO (Food and
Agriculture Organization) estimates consumption across nations Further, a shift in the macro-nutrient consumption pattern is also
through a metric called per-capita food supply, measured in expected due to the change in SECs. Traditionally, 71% of per-capita
kilocalories per capita per day. In 2013, it was 2459 for India compared food supply comes from carbohydrates as compared to approximately
to 3108 for China, 3276 for Australia, 3424 for UK and 3682 for USA. 50% for other nations. However, the demand for protein and fat based
The demographic shift will create a large middle class increasing the food such as meat and fish are expected to increase in the future.
overall consumption levels resulting in narrowing the calorie gap
8INDIA
An Investment Destination Of Choice
Comparison
Comparison of per-capita of per-capita
food supply in food supply in of per-capita
Comparison Comparison of per-capita food supply,
food supply,
2013 (kcal/capita/day) by macro-nutrient type
2013 (kcal/capita/day) byin
macro-nutrient
2013 type in 2013
Protein Fat Protein
Carbohydrates Fat Carbohydrates
USA USA 3,682 11.9%
3,682 39.5% 11.9% 48.6%39.5% 48.6%
UK 3,424 12.1% 36.4% 12.1%51.6%36.4% 51.6%
UK 3,424
Australia 3,276 13.0% 41.4% 13.0% 45.6%41.4% 45.6%
Australia 3,276
China 3,108 12.6% 27.8% 59.6%27.8%
12.6% 59.6%
China 3,108
India 2,459 9.8% 19.1% 71.1%
India 2,459 9.8% 19.1% 71.1%
CHANGES IN LIFESTYLE AND CUSTOMER PREFERENCES
Few critical changes in customer lifestyle and preference is catalysing non-essential impulse purchases, driving further growth in the food
greater demand for food products. services industry. As more women contribute at workplaces, coupled
People living in urban settlements will increase from 33% to 40% with busier lifestyles in general, there will be a shift towards RTC and
between 2016 and 2025. Higher exposure to western lifestyles is RTE food products.
increasing, improving general awareness of brands and expectations
on quality. Indian Food & Beverage
Family size is decreasing, simultaneously increasing the number of Consumption, 2017 - 2025 ($ Bn)
decision makers which is an indicator of higher consumption. Nuclear
families are expected to increase by 6% over the next 10 years.
More women are expected to join the workforce. Girls' secondary GR
education enrolment rate increased by approximately 30% between CA
2005 and 2014. This is a strong lead indicator of a larger skilled
female workforce in the near future.
The current level of processing in the food industry is approximately
10% in India compared to 80% in USA and 70% in France. All the 1,142
above trends are expected to drive growth in F&B consumption at a
CAGR of 15% till 2025, making the overall value of food and beverage
consumption reach $1.14 trillion by 2025. As brand awareness
increases with urbanization and higher disposable incomes, the 369
organized sector will get an impetus due to demand for branded,
high quality and specialized food. Increase in disposable income
2017 2025(F)
will make consumers seek more differentiated food experiences and
9INDIA
An Investment Destination Of Choice
GROWTH IN MODERN RETAIL AND E-COMMERCE
Growth in modern trade and retail in India provides a robust launch pad for investment in food and allied sectors. Between 2015 and 2020,
modern trade is expected to grow at CAGR of 22.4%. E-commerce market will also grow at a CAGR of 26% from 2017-2020. This corresponds to
a $165 billion modern trade market and a $107 billion e-commerce market in India by 2020.
Indian Retail Market Size by Type, Indian e-commerce Market,
2015-2020(F) ($ Bn) 2014-2020(F) ($ Bn)
The opportunity is huge because
%of MT 15.6%
branded packaged food is about
9.8% GR 107.0
12 percent ofCAthe %
total food
26 84.7
1055 market and there is a huge
GR
CA portion that is 67.0
unbranded and
165
G R 53.0
CA %unorganized. Only 3 percent of
GR 36 35.0 43.1
CA
610 the staple market is organized,
60 21.0
16 percent of the dairy products
GR 890
CA market is organized and in oil
550
2014 the2015organized
2016 2017 market
2018 2019is only
2020 14
percent
2015 2020(F)
- Divisional Chief Executive, Foods, ITC
GT MT
Indian e-commerce Market,
2014-2020(F) ($ Bn) With e-commerce and modern trade facilitating wider range
selling, there will be opportunity for more brands to operate
in the market. Opportunities for different categories of
GR 107.0 foods will emerge, such as:
CA %
26 84.7 1. Refrigerated and frozen products such as frozen vegetables
and snacks, aided by improved cold chain infrastructure
67.0
GR 53.0 2. Premium, imported and specialty food products such as
CA % berries, croissants, dips, condiments imported chocolates
36 35.0
43.1
and pastries, aided by specialty food stores such as Godrej
Nature's basket and Brown Tree; along with online food
21.0
grocers such as Big Basket and Amazon
2014 2015 2016 2017 2018 2019 2020
10INVESTMENT IN FOOD &
AGRI-BUSINESS IN INDIA
About Time:
INVESTMENT IN
FOOD & AGRI-
BUSINESS IN INDIA
1. The growth in market cap in the last 16 years is a
clear indicator that India is an attractive destination
for investment
2. F&B and agri-business have been among the best
performing sectors with respect to value creation and
returns generated
3. Economic reforms and policy changes have enabled
marked improvement in the ease of doing business in
India
4. Significant investments have been made in air, rail and
road connectivity as well as cold-store infrastructure
5. Government programs that support food processing
and cold store infrastructure have further increased
the attractiveness of the food & allied sectors
11INVESTMENT IN FOOD &
AGRI-BUSINESS IN INDIA
STELLAR SECTOR PERFORMANCE
Market Capitalization of companies listed on the BSE (Bombay Stock Exchange) increased from $210.7 billion in FY00 to $2,207.5 billion in FY18.
Indian Listed companies on BSE - Market Cap (USD Billion) and Average Sensex, FY00-18
32436.7
27319.1
26525.2 26213.0
18568.9 17443.1
20067.4
15404.2 18215.8
16459.8
2,207.5
12162.7 12319.8
1,811.9
1,625.2
8289.4 1,520.1
1,355.2 1,413.8
1,273.2 1,235.1 1,209.6 1,215.4
5731.7
4641.6 4269.1 4499.6
3327.5 3196.9 805.2
679.4 602.4
341.2 388.7
210.7 125.1 125.6 120.1
FY00 FY01 FY02 FY03 FY04 FY05 FY06 FY07 FY08 FY09 FY10 FY11 FY12 FY13 FY14 FY15 FY16 FY17 FY18
Market Cap Sensex
Plotting average ROCE (Return on Capital Employed) percentage generated. It is evident that food and agri-business is an industry that
against value creation growth for different sectors during FY10- makes business sense and is comparable to industries like ITES, auto
16 shows that F&B and agri-business sectors are among the best and consumer goods.
performing sectors in India with respect to value creation and returns
12INVESTMENT IN FOOD &
AGRI-BUSINESS IN INDIA
Average ROCE (%) vs. Market Capitalization (% growth) (FY10-17)
Chemicals , 11% , 21% Auto, 15% , 21%
Retail, 5% , 23% Consumer goods ,
Other Manufacturing , 28%,23%
Healthcare ,
Plastic and Rubber
High
9%, 19% 14% , 20%
products , 15% , 19%
Electronics & Consumer
Durables , 8%, 17%
Agriculture, Forestry and
BFSI , 7% , 16% Food and
Media and Entertainment , 12% , beverages , 15% , allied products , 16% ,
Value Creation % Growth (FY 10-17)
14% 17%
17%
Transport & ITES , 25%, 12%
Textiles , 10% , 13%
Medium
Distribution, 11% ,
13%
Diversified , 8%, 11%
Real Estate & allied
Other Services , 6%, 10% activities, 12% , 10%
Industrial machinery and
equipments , 12% , 5%
Infrastructure, 11% , 5%
Low
Telecom , 5% , 5%
Energy, Oil & Gas , 11% , 2%
Mining and allied
Trading , 5% , -14%
products , 10% , -2%
Low Medium High
Avg ROCE % (FY 10-17)
Note : The above plot is not to scale. (X,Y) denote Value Creation % Growth and % RoCE during the period
Note : Number of companies for FY10 is 3,146 and for FY17 is 2,726
IMPETUS FROM GOVERNMENT REFORMS
India climbed up 30 ranks in the Ease of Doing Business ranking
in 2017. India was also among the 10 economies in the world that
improved the most in parameters used for measuring the ease
of doing business by World Bank. Among the parameters used,
India vaulted up 53 places on the taxation index. This is expected
to improve once GST is factored in since the cut-off for last year's
index was June 1, 2017. This improvement has been enabled by
investment in infrastructure and implementation of government
reforms such as:
1. Faster building permits through an online single window
system for approval
2. Streamlined business incorporation through SPICe (Simplified
Proforma for Incorporating Company electronically)
3. Reduced border compliance time due to improved port
infrastructure
4. Reduced export and import border compliance costs
5. Strengthened access to credit
13INVESTMENT IN FOOD &
AGRI-BUSINESS IN INDIA
Budget allocation to Approximately 7,600 2nd largest road Posted its highest ever
Civil Aviation Ministry cold storage facilities network in the world. freight loading in FY18 at
tripled in FY19 to $1.01 with combined capacity Approximately $83 approximately 1.2 billion MT
billion. Investment of of 35 million MT; billion approved for "National Rail Plan" to be
$25 billion expected in expected to grow by phase 1 of Bharatmala launched soon to create a
the aviation sector approximately 15% program covering 35000 multi-model transport
over the next decade annually over the next km of road to improve system by connecting rail to
few years connectivity other transport modes
The government has come up with several schemes which will make it easier for food & agri-business companies specifically to operate in India.
1. Mega food park scheme: Is based on a cluster approach which envisages a well-defined food processing zone containing state-of-the-art
processing facilities
2. Scheme of cold chain, value addition and preservation infrastructure: To promote the development of integrated cold-chain from
farm to the end-consumer
3. Scheme for creation/expansion of food processing/preservation capacities: To improve the state of existing food processing and
preservation and improve future capacity
4. Scheme for creation of backward and forward linkages: To help plug the gaps in the supply chain with raw material availability and
linkages to the market
5. Scheme for R&D in the food processing sector: To develop new products, cost-effective food processing and packaging technologies; and
standardize various products such as additives, coloring agents and preservatives
6. Scheme for promotional activities, advertisements, publicity, studies and surveys: To help organize seminars, commission studies
and surveys; create awareness and develop software for the food processing sector
7. Scheme for skill development: To enable skill development and make human capital available for the food processing industry
8. Scheme for strengthening of institutions: To enable improvement of Food Processing related Government institutions such as NIFTEM
(National Institute of Food Technology Entrepreneurship and Management) and IIFPT (Indian Institute of Food Processing Technology)
The government's policy support will not only help in developing the processed food segment but also enable the overall shift to the
organized sector.
14OPPORTUNITY HOTSPOTS:
Sub-Sectors In F&B
OPPORTUNITY HOTSPOTS:
Sub-Sectors In F&B
In the F&B sector, there is great opportunity in sub-sectors across different types of products, including the following:
Packaged Food | Fish and Marine Products | Fruits and Vegetables (F&V) | Dairy Products
Poultry Products | Meat Products | Beer & Alcohol
Trends such as westernization and higher disposable incomes have increased
the frequency of people eating-out, driving growth of the hotel and restaurant
industry, which is becoming increasingly organized
Institutional catering market in India is also sizeable at approximately $6.3
billion, with a presence of many organized sector players
The growth in the F&B sector is also creating attractive investment opportunities
in allied sectors and agri-business industry such as:
Warehousing & Cold chain |
Food Packaging | Food Ingredients | Contract Farming
Bio-fertilizers & Bio-pesticides | Seeds
15OPPORTUNITY HOTSPOTS:
Sub-Sectors In F&B
LUCRATIVE SECTORS IN F&B
Packaged Food
The packaged food market in India is approximately $25 billion with expected in savouries and snacks, carbonated soft drinks, biscuits,
high growth expected across most product categories. Big wins are bakery products and chocolates.
Key trends include:
1. Premiumization across categories
2. High growth in indulgence products such as chocolate and confectionery
3. Growth in products that increase convenience such as RTE, RTC and breakfast cereals
Size and growth of organized food market category-wise
Category - wise Organized Value growth in
market size,2017 ($ Mn) next five years
Savouries and Snacks 4,666 12%
Among packaged
Carbonated soft drinks 4,355 4%
food, highest growth
Biscuits 3,733
8% is expected in
Bakery products 2,286
Chocolates 2,131
8%
savouries and snacks
Juices 1,555
8%
8%
growing at CAGR 12%
Confectionery
Spices and Masalas
1,493
1,244 5%
over the next five
Sauces 622 8% years
RTC 373 10%
- Regional President and CEO, PepsiCo India
Others 3,469
10%
Ferrero’s India growth story: Tapping customer willingness to pay a premium
When Ferrero entered India in 2004, the most expensive chocolate was priced at $0.37. Ferrero identified that there was a segment willing
to buy chocolates at a premium. Ferrero focused on this segment and built its business in India. It launched Kinder Joy, a product targeted
towards children, positioned as a healthy choice with milk contents and priced at a premium. By targeting these unaddressed customer
needs, Ferrero became the number two chocolate confectionery player in India with a market share of 14% and a revenue of approximately
$220 million in FY17.
16OPPORTUNITY HOTSPOTS:
Sub-Sectors In F&B
Fish and Marine and farm preservation systems can reduce wastage levels and improve
India is the 2nd largest producer of fish with a production of 9.6 quality for export. There is also good opportunity in organized
million MT in 2014 at a CAGR of 4% from 2010-14. India's share in F&V retail to cater to the quality conscious customers arising from
global shrimp exports is 60%. increased levels of awareness about hygiene and western practices.
The processing levels of fish in India is approximately 23% with high Processed F&V
quality products catering to export demand. India is among the In processed F&V, there is good head-room for growth with current
fastest growing consumer markets for processed fish and seafood. levels of processing in India being at 2% as compared to 23% in
Good availability of resources and domestic potential will create China and 70% in USA. Categories such as sauces, fruit juices and
opportunities such as value-added product development in RTE and jams, dried vegetables and fruits are some of the key high-growth
RTC category and cold chain development for marine food. processed consumer F&V products.
Top 5 fastest growing retail markets for processed There are attractive opportunities in new technology for improving
fish and seafood (CAGR 2011-15)
levels of processing in the F&V supply chain and new product
India 24.9% development such as:
Indonesia 19.5%
1. Dehydrated F&V
Turkey 11.8%
2. Nutraceuticals
South Africa 11.2% 3. Natural ingredients for processed foods
Russia 10.8%
4. Traditional beverages based on F&V
SECTORS CHARACTERISED BY LOW PER-CAPITA
Fruits and Vegetables CONSUMPTION
Dairy
India is the second India's per-capita consumption of milk is one-third of USA and Europe.
largest producer of Fresh Milk dominates the dairy market with 55% share. This category
has an EBITDA of 6% to 7% and is expected to grow at 8% CAGR till
F&V in the world and 2020. Value added dairy products, which have EBITDA% levels at
the world’s largest 20%-30%, are expected to grow at 25% CAGR till 2020 thus making
the dairy sector very attractive.
producer of mango,
guava, banana and Per-capita Milk consumption by Region,
2016 (L/Year)
papaya
India 97
India's exports of F&V between FY13 and FY17 grew at a CAGR of 9.2%. Europe 281
Although the availability of resources is high, there is significant
USA 285
level of wastage that happens in F&V in India, amounting to a loss of
approximately $6 billion worth of F&V. Investing in modern harvesting
17OPPORTUNITY HOTSPOTS:
Sub-Sectors In F&B
Poultry
India's per-capita consumption of chicken meat and eggs is
significantly low. However, with a positive growth outlook and new
demographic scenario, it is likely that the per-capita consumption India has the largest
levels of egg and poultry meat would witness significant growth
in India. Opportunities which will arise owing to the anticipated
livestock population
growth in this market include: in the world and is the
1. Improving poultry processing machinery world’s largest producer
2.
3.
Improving quality of feed given to poultry
Infrastructure development such as climate-controlled farm houses
of buffalo meat and
and automated feed lines world’s second largest
Per Capita Consumption Chicken
producer
Per Capitaof goat meat
Consumption of Eggs,
Meat, 2017 (Kgs/year) 2014 (No of Eggs per year)
India 1.9 Non-poultryIndia
Meat 60
Peru The per-capita consumption level of meat in205
Spain India is significantly
38.2
below developed
France nations. For example, the
215per capita meat
Brazil 39.9
consumption for
USAIndia in 2016 was 1.2 kg annually as compared to 37.9
Australia 44.5 267
kg for china and 49.7 kg for US. The demographic shift is expected
USA 48.8 Mexico 350
to grow the meat consumption levels in India as a result of increased
purchasing power. Increase in consumption will create several
opportunities such as infrastructure development, modern abattoir,
processed frozen meat products and modern meat retail.
Per Capita Consumption of Eggs,
2014 (No of Eggs per year)
Per-capita consumption of
India 60 Non-Poultry Meat, 2016(Kgs/year)
Spain 205
France 215
USA USA 49.7
267
Mexico 350 China 37.9
India 1.2
18OPPORTUNITY HOTSPOTS:
Sub-Sectors In F&B
Beer and Alcohol The overall hotels and restaurants market in India was $45
The alcoholic beverages industry in India in FY16 was $7.6 billion billion in 2016. The organized segment is expected to grow fast
and grew at a CAGR of 8% between FY12-16. Per-capita consumption and contribute to approximately 43% of the overall hotels and
of alcohol in India, at 4.6 litres per annum, is almost one-third of restaurants market in India by 2021. This corresponds to a CAGR
Australia. Some of the opportunities that are emerging in this space of 15% for standalone restaurants and 20% for chains during the
include selling of craft beer and setting up of microbreweries. same period.
Across different restaurant categories, the share of chains was
Per Capita Consumption of Alcohol, highest in QSRs (Quick Service Restaurants) at 45% followed by
2015 (L/year) dessert counters at 40%. In all categories, the share of chains was
above 10% indicating that there is an opportunity to set up chains
Australia 12.6 across various formats.
United Kingdom 12.0
European Union 10.6 Indian Hotels & Restaurants Market, 2016-2021 ($Bn)
United States 9.0
India 4.6 CAGR
77 Total 10%
15
45 13 45
4 Unorganized 7%
OPPORTUNITIES IN FOOD SERVICES: 30
13
26
Standalone / Local 15%
HOTELS, RESTAURANTS AND CATERING 3
2016 Food Service Standalone / Unorganized
7
2021
Chains 20%
Chains Local
Mobile penetration has With a good projected GDP outlook, there is also opportunity in
enabled hyperlocal food the organized food catering and services business. Institutional
catering in India is approximately $6.3 billion. Small caterers hold
delivery firms such as Swiggy more than 60% of the market. MNCs and large caterers hold 20%
of the market each and both segments are growing fast
and Zomato. This augurs well
for the generation of young OPPORTUNITIES IN ALLIED SECTORS AND
AGRI-BUSINESS
digital natives who are on Allied Sectors
the lookout for new food Warehousing and Cold Chain
experiences
Cold chain
industry in India
is expected to
grow at a CAGR of
25% over the next
5 years
19OPPORTUNITY HOTSPOTS:
Sub-Sectors In F&B
The annual loss in all agri-produce in India is approximately Food Ingredients
$13.7 billion owing to gaps across components of the cold-chain. The market for food ingredients in India is $764 million of which nearly
The percentage gap from required capacity for pack houses is 50% is from food flavours and remaining 50% from food emulsifiers,
99.6%, ripening chambers is 91%, reefer vehicles is 85% and cold stabilizers, sweeteners, food enhancers and food preservatives. Key
storage is 10%. These gaps are expected to drive an opportunity drivers for growth in this market are rising urbanization, changing
of $6.5 billion in areas including modernization of existing storage customer needs, development of mega food parks, high growth in
infrastructure, building an integrated cold-chain and creation of demand for processed foods, RTE and RTC products. There will be
opportunity in R&D to create innovative and quality flavours and natural
energy efficient storage technology.
food ingredients.
Food Packaging
Food packaging market in India is $15 billion, expected to grow at a CAGR Agri-business
of 11% till 2020 to reach $20 billion. Significant impetus to this sector is Contract Farming
expected to come from:
Recent government policies, such as the Model Contract Farming Act, aim
1. Growth in convenience foods enabled by busier lifestyles and higher to promote contract farming in the agriculture sector. Opportunities in
disposable incomes contract farming include:
2. Growth in packaged fruit juices and dairy products markets
1. Poultry contract farming, with expected growth in meat consumption
3. Growth in hyperlocal food delivery leading to growth in food
takeaways 2. Services for contract farming community such as easier access to
agri-inputs, technology, credit
There are attractive opportunities in creation of packaging for RTE foods
to increase shelf life and light and cost-effective packaging options for
food delivery.
PepsiCo has successfully implemented contract farming
in Punjab for tomatoes. Ugar Sugar took the contract
farming route in Karnataka to produce barley
20OPPORTUNITY HOTSPOTS:
Sub-Sectors In F&B
Fertilizers and Pesticides Seeds
Production of biofertilizers in India more than tripled between FY09 and The seeds market for food crops in India was $2.48 billion in 2016 and
FY15. Bio-pesticides market is expected grow at a CAGR of 19% till FY20 grew at a CAGR of 16% between 2010-16. Rice, vegetables, maize, pulses
to reach $362.1 million by FY20. Key growth drivers are: and wheat seeds make up approximately 50%-60% of the overall seeds
1. Government's support to promote bio-agriculture market by value. With food consumption in India set to grow, there is a
2. Rising demand for chemical free products for crop protection and clear need for increasing food productivity. One of the ways to improve
yield enhancement due to increased consumer awareness productivity is through the use of hybrid seeds. There is an opportunity
3. Growing demand of organic food as a result of increased health to increase the hybridization level across many products to help boost
consciousness among consumers productivity.
Hybridization Levels in the
Seed Market in India (FY13, %)
Sunflower
Cabbage 85%
>95%
Tomato 60%
Cotton ~95% Watermelon 40%
Jowar >90% Okra 23%
Gourd 15%
Maize 65% Chilli 14%
Bajra 35% Cauliflower 11%
Rice
Eggplant 8%
6%
Cucumber 3%
21INVESTMENT LANDSCAPE
In The Food & Agri-Business
Industry In India
INVESTMENT LANDSCAPE
In The Food & Agri-business
Industry In India
1. The food and agri-business space has attracted several strategic investments from global leaders
2. PE investments in India are in resurgence since 2014 and have hit an all-time high of $22.6 billion in 2017
3. The exit scenario is also very good supporting further growth in investments
4. There have been several sizeable PE exits with attractive returns across the food and allied sectors over the past few years
5. IPO issues have also grown significantly in value in the last few years; there were significant number of IPOs in 2017 that could
have been potentially backed by PEs
22INVESTMENT LANDSCAPE
In The Food & Agri-Business
Industry In India
RESURGENT PRIVATE EQUITY PE Exits in India, 2010-2017 ($ Bn)
ECO-SYSTEM
23.6%
25.0%
23.0% 12.9
PE (Private Equity) in India has grown from $169 million in 1998
to $22,604 million in 2018. The industry has gone through several 20.0%
phases over the years. 9.1
18.8%
15.0%
14.3% 15.0%
7.8
The period of 1998 to 2003 was characterised by growing interest in Asia 10.1% 10.9%
12.0%
following the China growth story and ASEAN meltdown. In 2004-2007, 5.0
4.6
10.0%
4.5
4.2
there was high interest in India due to a booming economy. The global 3.2
meltdown impacted the period between 2008-2013, and the shocks were 5.0%
felt in India as well. The last five years have witnessed resurgence, as the
post-meltdown recovery on the back of fiscal support, has resulted in 2010 2011 2012 2013 2014 2015 2016 2017
0.0%
improvement in the investment climate in India. Exits (by Exit Value ) IRR
PE evolution in India
PROOF OF THE PUDDING: WHY FOOD &
Cautious Entry
Characterised by growing
interest in Asia following
Bullish Outlook
High interest in
India due to a
Selective Play
Global meltdown
had its impact on
Resurgence
Recovery post-meltdown on the
back of fiscal support and
AGRI-BUSINESS IS ATTRACTIVE
the China growth story and booming economy India as well improvements in investment climate
ASEAN meltdown
25,000
PE and VC (Venture Capital) investments in food & agri-business
37
22,604
27 16,473
20,000
sectors in India have grown from $299.5 million in 2007 to $1,128
27
14,614 21
27
14,137 15,000
million in 2017. The average size of investments has also grown
21 19 22
22
21
18
18
10,125
8,121
9,906
9,208
10,053
10,000
over the last decade, with the average increasing from $13 million
7,213 7,199
10
9 10 9
11 13
4,009
14
5,000
in 2007 to $22.1 million in 2017.
6 2,508
1,877
410 733 805 555 730
169
0
1998 1999 2000 2001 2002 2003 2004 2005 2006 2007 2008 2009 2010 2011 2012 2013 2014 2015 2016 2017
Investments ($ Mn ) Avg size of deals ($ Mn)
The exit scenario in India has also been very attractive with the
overall value of exits in India growing from $4.5 billion in 2010 to
$12.9 billion in 2017.
23INVESTMENT LANDSCAPE
In The Food & Agri-Business
Industry In India
PE/VC Investments in Food and Agri-business firms* Food and agri-business sectors have also witnessed a number of
2007-2017, ($ Mn)
large acquisitions and partnerships over the last decade. Some of
1,128.0 the notable acquisitions include:
1,010.8
101
1. Swedish Specialty Fats manufacturer AAK's acquisition of
Investment Number of Deals
India's Kamani Oil industries
778.0
76
2. Global dairy industry leader Lactalis' acquisition of Tirumala
Milk
588.1
555.4 60
3. European processed food company Orkla's acquisition of MTR
50
40
413.5
36 42 Foods
324.5
299.5
274.5 20
27 17 189.1
The food and agri-business in India is ready for its next leap. There
23
121.9
are established success stories of investments that stand to testify
the opportunity that this sector offers, to create real value and
2007 2008 2009 2010 2011 2012 2013 2014 2015 2016 2017
*Includes foodtech, agri-logistics firms and venture debt
generate return on investments. The consumer base is massive and
purchasing power is increasing. The government is taking concrete
Some of the large PE investments in the recent years include: steps to make it easy for companies to invest and operate in India.
1. $184.7 million investment by General Atlantic in Capital Foods Thus, food and agri-business in India is a lucrative investment
in 2018 opportunity. The time is right for investors to foray into the sector
2. $104 million investment by Temasek in Godrej Agrovet in 2012 to gain an early advantage to capture their share of a growing
market.
3. $82 million investment by Temasek in Devyani International
in 2014
4. $60 million investment by Mandala Capital in Jain Farm Fresh
in 2016
There have been several sizeable PE exits with attractive returns
across the food and allied sectors. Some examples of successful
exits are:
1. In 2012, Proterra invested $20 million in Dodla Dairy. In 2017,
Proterra sold its 23% stake in a secondary sale for $44.7
million generating a return of 2.2 times and an IRR of 17.5%
2. In 2014, Faering Capital made an investment of $2.71 million
in Snowman Logistics between Dec-15 and Aug-16. Faering
Capital sold its complete stake in a public market sale for
$5.55 million generating a return of 2.04 times and an IRR of
47.3%
24CONCLUSION
WHAT CAN INVESTORS DO TO BENEFIT FROM THE
INDIA GROWTH STORY?
There are many ways in which investors can benefit from the investment
opportunity in the Food industry in India which include:
Evaluate investing in Food and Agri-focused Funds in India: There are
Food and Agri-focused funds in India such as Mandala Capital which focus
on Food and Agri-business companies across the value chain and provide
financial and operational support to create sector-leadership. Investors
should consider evaluating the attractiveness of investing in Food and Agri-
focused funds in India
Evaluate the potential of Fund Managers giving higher allocation to
Food Sector in India: Given the immense opportunity in Food and allied
sectors in India, it would be worthwhile to evaluate the attractiveness of
allocating higher funds to Food sector in India
Evaluate direct investment in attractive opportunities in the Food
business in India: Government policies facilitate direct investment in Food
business in India and investors can evaluate the best ways to directly invest
in India
Evaluate the potential of current portfolio Companies in Food Business
to explore expansion into India: There are several sectors in Food and
allied sectors which are expected to witness robust growth over the next
few years in India and evaluating expansion into India should be considered
25Authors:
Naimish Dave, Executive Director, naimish.dave@consultavalon.com
Santosh Sreedhar, Executive Director, santosh.sreedhar@consultavalon.com
Sriram Sunder, Senior Consultant, sriram.sunder@consultavalon.com
Supported by:
Niyati Dave, Aastha Agarwal, Ashrafil Shaikh
26AVALON
Consulting
Founded in 1989, Avalon Consulting is part of the 2,200+ strong Avalon Group with operations across the entire knowledge spectrum
covering Consulting, Business Research and Analytics. At Avalon Consulting, we provide solutions to business problems related to Strategy,
Performance Improvement, Organisation Transformation and Transaction Support to companies across the globe. Our practice areas
include Agri and Food Processing, Automotive, Chemicals, Engineering & Capital Goods, Metals and Infrastructure, among others.
Mumbai
101, Suraj Prakash, First floor, 86 Shankar Ghanekar Marg, Prabhadevi, Mumbai 400 025. INDIA
Phone: +91-22-4946 6600 | Fax: +91-22-4946 6666
E-mail: mumbai@consultavalon.com
Delhi
E-141, Okhla Industrial Area, Phase III New Delhi – 110020, INDIA
Phone: +91-11-4051 6600 | Fax: +91-11- 4051 6650
E-mail: delhi@consultavalon.com
Chennai
Door No: 128, First Floor, East West Centre, Nelson Manickam Road, Aminjikarai, Chennai - 600029. INDIA
Phone: +91-44-4345 5345 | Fax: +91-44-4345 5338
E-mail: chennai@consultavalon.com
Bangalore
Level 2, Prestige Omega, No.104, EPIP zone, Whitefield, Bangalore 560066, INDIA
Phone: +91 80 6771 0709 | Fax: +91 80 6771 0700
E-mail: bangalore@consultavalon.com
Singapore
Level 30, Six Battery Road Singapore 049909
Phone: +65 3159 0046
Email: admin@apex-avalon.sg
For more details please visit
www.consultavalon.com
27You can also read