Wastewater Treatment Facility Plan Amendment 2 Staples,Minnesota April2018 - Submitted by
←
→
Page content transcription
If your browser does not render page correctly, please read the page content below
Wastewater Treatment Facility Plan
  Amendment 2
  Staples, Minnesota         April 2018

Submitted by:
Bolton & Menk, Inc.
7533 Sunwood Drive NW #206
Ramsey, MN 55303
P: 763-433-2851
F: 763-427-0833
Certification

                                Wastewater Treatment Facility Plan
                                        Amendment 2

                                                        for

                                      City of Staples, Minnesota

                                                W13.104619

                                                 April 2018

                                                I hereby certify that this plan, specification or report was
                                                prepared by me or under my direct supervision, and that I
                                                am a duly Licensed Professional Engineer under the laws of
                                                the State of Minnesota.

                                                By:
                                                         Paul Saffert, P.E.
                                                         License No. 43485

                                                Date:         April 25, 2018

Prepared by: Bolton & Menk, Inc.                                                                   Certification
Wastewater Treatment Facility Plan Amendment 2 W13.104619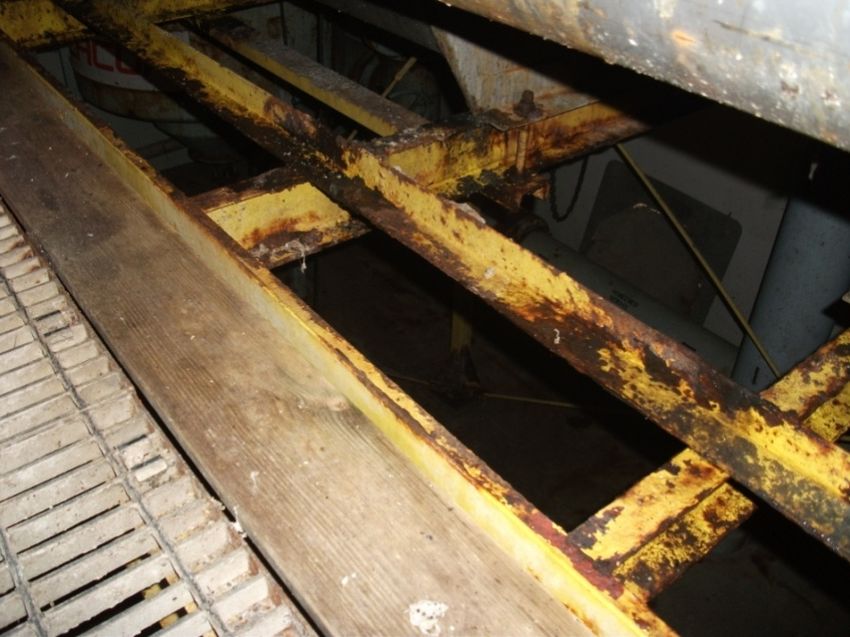
Table of Contents
        I.      INTRODUCTION ...................................................................................................................... 1
                     PURPOSE....................................................................................................................... 1
                     BACKGROUND .............................................................................................................. 1
        II.     DESIGN CONDITIONS.............................................................................................................. 2
                     PLANNING PERIOD ....................................................................................................... 2
                     CUSTOMER/USER PROJECTIONS .................................................................................. 2
                     WASTEWATER FLOWS .................................................................................................. 3
                     WASTEWATER LOADINGS ............................................................................................ 7
                     MERCURY...................................................................................................................... 9
                     BIOSOLIDS................................................................................................................... 10
                     CURRENT EFFLUENT LIMITS ....................................................................................... 11
                     FUTURE EXPECTED EFFLUENT LIMITS ........................................................................ 11
        III.    EVALUATION OF EXISTING FACILITIES .................................................................................. 13
                     TREATMENT FACILITY ................................................................................................. 13
                     FACILITY CONDITION .................................................................................................. 14
        IV.     WASTEWATER TREATMENT FACILITY IMPROVEMENTS ...................................................... 31
                     GENERAL ..................................................................................................................... 31
                     WASTEWATER TREATMENT FACILITY IMPROVEMENTS ............................................ 31
                     FACILITY CLASSIFICATION ........................................................................................... 36
        V.      RECOMMENDATION ............................................................................................................ 37
                     RECOMMENDATION................................................................................................... 37
                     PROJECT FUNDING ..................................................................................................... 37
        VI.     CONSTRUCTION COST ESTIMATE ......................................................................................... 39
                     GENERAL ..................................................................................................................... 39
                     CAPITAL COSTS ........................................................................................................... 39
                     OPERATIONAL COSTS ................................................................................................. 40
                     TOTAL PROJECT COST ................................................................................................. 40
                     USER RATES ................................................................................................................ 41
        VII.    IMPLEMENTATION ............................................................................................................... 42
                     IMPLEMENTATION SCHEDULE ................................................................................... 42

Figures
        Figure 2.1: Historical and Projected Populations ............................................................................ 3
        Figure 2.2: Historical Flow Data ...................................................................................................... 5
        Figure 2.3: Historical CBOD5 and TSS Loading................................................................................. 8
        Figure 3.1: Existing Static Screen .................................................................................................. 15
        Figure 3.2: Static Screen Supports ................................................................................................ 16
        Figure 3.3: Eutek Teacup Grit Removal System ............................................................................. 17
        Figure 3.4: Trickling Filter Arm ...................................................................................................... 18
        Figure 3.5: Trickling Filter Mechanism .......................................................................................... 19

Prepared by: Bolton & Menk, Inc.                                                                                               Table of Contents
Wastewater Treatment Facility Plan Amendment 2 W13.104619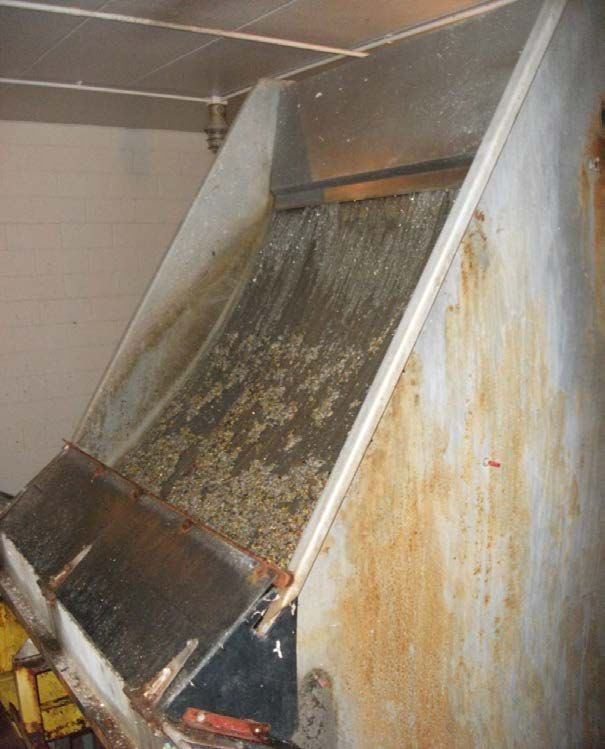
Figure 3.6: Bypass Pipe Leak ......................................................................................................... 20
        Figure 3.7: Aeration Basin Splitter Box ......................................................................................... 21
        Figure 3.8: Aeration Basin Air Header Hoist ................................................................................. 22
        Figure 3.9: Aeration Basin and Return Sludge Piping ................................................................... 22
        Figure 3.10: Older Clarifier ............................................................................................................ 23
        Figure 3.11: Influent to Older Clarifier .......................................................................................... 24
        Figure 3.12: Newer Clarifier .......................................................................................................... 24
        Figure 3.13: Chlorine Contact Basin .............................................................................................. 25
        Figure 3.14: Lime Feed System ..................................................................................................... 26
        Figure 3.15: Aerobic Digesters ...................................................................................................... 27
        Figure 3.16: Chlorine Enclosure .................................................................................................... 28
        Figure 3.17: Blowers...................................................................................................................... 29

Tables
        Table 2.1     Population Projections .................................................................................................... 2
        Table 2.2     Average Daily Flows - City of Staples............................................................................... 4
        Table 2.3     Determination of Design Flows - City of Staples ............................................................. 6
        Table 2.4     Historical Influent Loadings - City of Staples ................................................................... 7
        Table 2.5     Design Wastewater Flows and Loadings - City of Staples ............................................... 9
        Table 2.6     WWTP Mercury – City of Staples ................................................................................. 10
        Table 2.7     Biosolids Land-Applied – City of Staples ....................................................................... 10
        Table 2.8     Effluent Limits - City of Staples...................................................................................... 11
        Table 2.9     Future Expected Effluent Limits - City of Staples .......................................................... 11
        Table 3.1     Staples WWTF Unit Process Summary .......................................................................... 13
        Table 4.1     Alternative 1: Moderate Improvements to Optimize Current Processes ..................... 32
        Table 4.2     Alternative 2: Rehabilitation of Existing Facility with the Addition of Flow
                      Equalization ................................................................................................................... 33
        Table 4.3     Alternative 3: Rehabilitation of Facility with Addition of Extended Aeration Process . 34
        Table 4.4     Alternative 4: New Extended Aeration Activated Sludge Treatment Facility ............... 36
        Table 6.1     Capital Cost Estimates for Recommended Alternative 4 .............................................. 39
        Table 6.2     Operations & Maintenance Cost Changes – City of Staples.......................................... 40
        Table 6.3     Total Annual Project Costs– City of Staples .................................................................. 40
        Table 6.4     Estimated User Rates City of Staples ............................................................................ 41
        Table 7.1     Project Implementation Schedule - City of Staples ....................................................... 42

Appendix
        Appendix A: Preliminary Cost Estimates
        Appendix B: City Council Presentation Materials

Prepared by: Bolton & Menk, Inc.                                                                                                   Table of Contents
Wastewater Treatment Facility Plan Amendment 2 W13.104619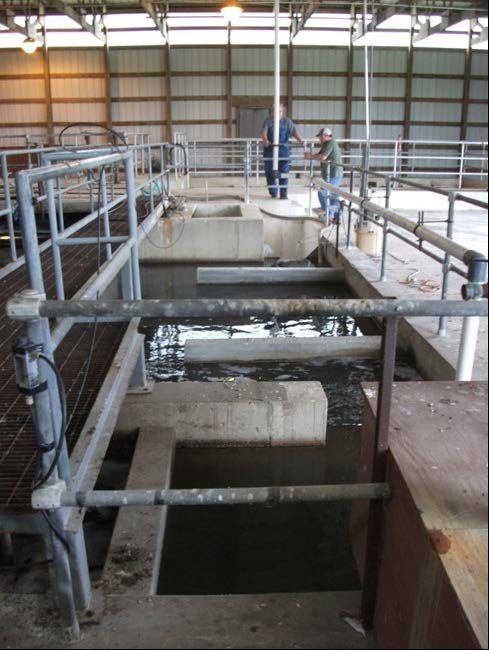
I.   INTRODUCTION
             PURPOSE
             This report provides the City of Staples, Minnesota with recommendations for wastewater
             facility improvements, including a prioritized list of items for repair or replacement.
             Recommendations are based on input from the city staff, a visual inspection of the
             infrastructure, and an evaluation of facility requirements in accordance with the current
             recommended practice.
             Section 2 provides a review of the current design conditions. An evaluation of the existing
             facility is provided in Section 3. Alternatives for wastewater treatment facility improvements
             are discussed in Section 4, with costs presented in Section 5 and the proposed project
             implementation in Section 6.
             BACKGROUND
             The Staples Wastewater Treatment Facility was originally constructed in 1965 and expanded
             in 1991. The aeration basins, two of the final clarifiers, the chlorine contact tank, and the
             aerobic digesters were originally constructed in 1965. A new pretreatment and control
             building, trickling filter and one final clarifier were added in 1991. In 1997, the city replaced
             the influent main lift station. Since 1991, the city has maintained the facility, replacing parts
             and rehabilitating pumps and equipment as necessary, but no significant rehabilitation or
             construction has been done on the facility itself. Overall, the existing system can be effective
             to treat the facility’s current flows and loadings, but the facility requires significant
             rehabilitation and upgrades.
             Additionally, the city staff has noted that when there are high flows (typically in excess of 0.5
             million gallons per day), the aeration basins and the final clarifier splitter box experience
             some overflow and vortex issues that are of concern. The city is interested in ways to remedy
             these issues, as well as recommendations for general rehabilitation or improvements
             necessary to allow the facility to operate appropriately over the next few permit cycles.
             Finally, the facility has limited biosolids digestion and storage capacity. MPCA regulations
             require sludge be stabilized before land application. Because of the limited capacity, the City
             of Staples has been required to use lime to stabilize the sludge prior to land application,
             which is year-round. This system is inefficient and potentially dangerous, as lime can be a
             very dangerous chemical if improperly stored or handled.

Prepared by: Bolton & Menk, Inc.                                                                 INTRODUCTION
Wastewater Treatment Facility Plan Amendment 2 W13.104619                                               Page 1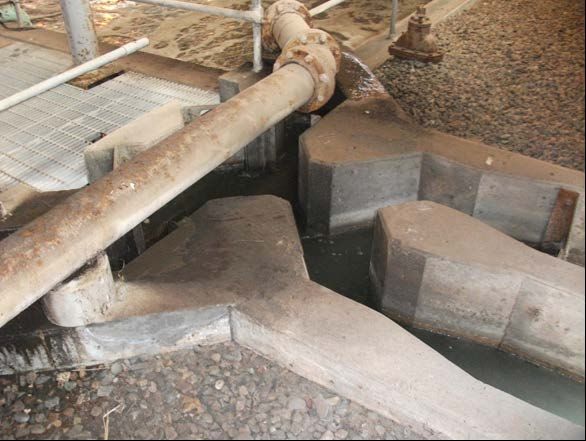
II. DESIGN CONDITIONS
             PLANNING PERIOD
             Wastewater treatment facilities are typically designed based on a 20-year planning period, as
             it is generally not feasible to make numerous changes in the capacity of a wastewater
             treatment facility. In addition, a 20-year planning period is required for the project to be
             eligible for funding assistance with the Public Facilities Authority (PFA).
             A design year of 2035 is used for this evaluation. Projected wastewater flows and loadings
             are determined using a combination of population trends and expected commercial and
             industrial growth. There are currently no significant industrial users in the City of Staples,
             though there is a nearby hospital that sends wastewater to the facility. As hospital waste is
             typically similar to domestic waste, all projections are based on typical domestic strength
             wastewater.
             CUSTOMER/USER PROJECTIONS
                   1.     Domestic and Commercial Projections
                          A number of methods are used to predict population trends, including a review of
                          historical city and county population trends and various mathematical
                          projections. A combination of methods is involved in projecting the future
                          population.
                          Table 2.1 summarizes the historical and projected populations for the city of
                          Staples and Wadena and Todd Counties as reported by the Minnesota State
                          Demographic Center. The City of Staples straddles the boundary line between the
                          two counties. As shown in Table 2.1 and Figure 2.1, the projected population
                          followed a decreasing trend from 2006 through 2010, but is projected to begin
                          increasing through 2035. The design population for the year 2035 for the City of
                          Staples is 3,189 people.

                                             Table 2.1 Population Projections

                             Year      City of Staples      Todd County      Wadena County

                             2006         3,149           24,469           13,615
                             2010         2,981           25,200           14,110
                             2015         3,005           25,720           14,470
                             2020         3,050           26,230           14,830
                             2025         3,095           26,620           15,210
                             2030         3,142           26,630           15,300
                             2035         3,189           26,660           15,440
                            Source: Minnesota Office of Geographic and Demographic
                            Analysis/State Demographic Center

Prepared by: Bolton & Menk, Inc.                                                            DESIGN CONDITIONS
Wastewater Treatment Facility Plan Amendment 2 W13.104619                                              Page 2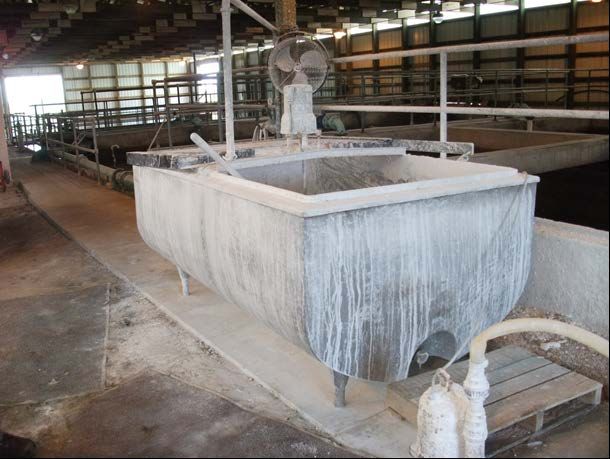
Figure 2.1 - Historical and Projected Populations
                                                       City of Staples, Todd County, and Wadena County
                         3,500                                                                                                         30,000

                                                                                                                                                Todd and Wadena Counties Population
                         3,000                                                                                                         25,000
City of Staples Population

                         2,500                                                                                                         20,000

                         2,000                                                                                                         15,000

                         1,500                                                                                                         10,000

                         1,000                                                                                                         5,000
                              2000           2005         2010         2015         2020         2025        2030       2035       2040
                                                                                    Year
                                                             City of Staples       Todd County          Wadena County

                                                           Figure 2.1: Historical and Projected Populations

                                          WASTEWATER FLOWS
                                          The City of Staples National Pollutant Discharge Elimination System (NPDES) Permit allows
                                          for an influent average wet weather (AWW) flow of 0.68 million gallons per day (MGD) and
                                          a peak flow of 1.3 MGD. A historical summary of the influent flows of the Staples
                                          Wastewater Treatment facility for the past ten years is presented in Table 2.2 and Figure 2.2.

                             Prepared by: Bolton & Menk, Inc.                                                            DESIGN CONDITIONS
                             Wastewater Treatment Facility Plan Amendment 2 W13.104619                                              Page 3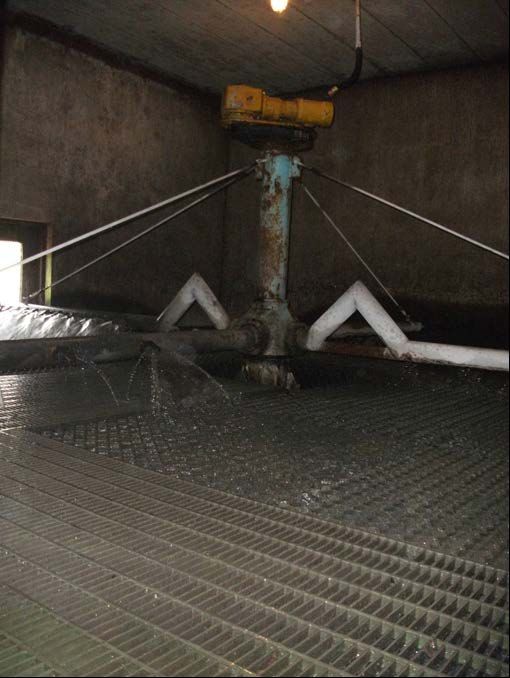
Table 2.2 Average Daily Flows - City of Staples

                                                                                                                                         Monthly
                        2003         2004         2005       2006       2007       2008        2009       2010       2011       2012
       Month                                                                                                                             Average
                        (gpd)        (gpd)        (gpd)      (gpd)      (gpd)      (gpd)       (gpd)      (gpd)      (gpd)      (gpd)
                                                                                                                                          (gpd)
  January              319,871      307,097      304,323    334,419    301,323    256,387     256,194    275,871   289,677     276,516   292,168
  February             308,179      325,759      294,250    312,107    301,500    245,966     259,321    311,250   290,536     266,000   291,487
  March                306,226      341,710      303,226    321,645    303,258    258,000     312,387    379,419   325,645     269,516   312,103
  April                366,767      352,133      392,867    396,367    454,867    335,300     404,467    358,867   427,867     294,167   378,367
  May                  441,097      362,258      394,194    406,903    417,935    372,613     339,968    353,581   493,452     369,774   395,177
  June                 500,233      367,067      512,933    339,233    404,867    393,233     318,433    363,200   484,233               401,853
  July                 612,968      407,935      427,258    297,968    319,452    329,323     351,677    412,548   406,452               402,723
  August               414,548      369,742      379,710    286,161    292,968    284,613     326,645    463,161   410,387               377,418
  September            343,433      396,767      376,467    299,167    294,300    273,333     292,033    377,867   310,433               343,985
  October              330,129      410,323      420,903    298,355    333,323    332,000     363,645    344,397   296,194               338,504
  November             320,633      360,367      388,033    283,033    301,767    286,067     417,833    354,867   296,500               341,020
  December             316,323      326,935                 288,419    269,452    259,129     352,419    316,903   264,806               317,852
  Yearly
  Average              381,701      360,674      381,288    321,982    332,917    302,164     332,919    359,328   358,015     295,195

  Note: A blank space indicates a month where no flow data was available.

Prepared by: Bolton & Menk, Inc.                                                                                   DESIGN CONDITIONS
Wastewater Treatment Facility Plan Amendment 1 W13.104619                                                                     Page 4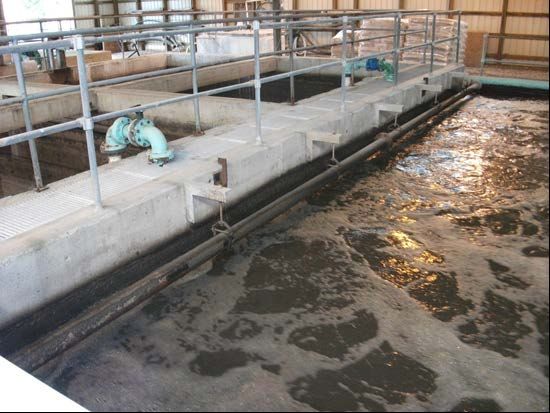
Figure 2.2 - Historical Flow Data
                                            Staples Wastewater Treatment Facility

        Flow (MGD)

                                                           Month-Year

                            Average Daily Flow (MGD)                          Permitted AWW Flow (MGD)
                            Maximum Daily Flow (MGD)                          Permitted Peak Flow

                                              Figure 2.2: Historical Flow Data

                     The average daily flow peaks in the spring months each year, but the spring peaks are less
                     than the permitted average wet weather flow. The maximum daily flow also peaks during the
                     spring months and, in 2010 and 2011, exceeded the permitted AWW flow. These large
                     fluctuations in influent flow to the treatment facility are attributed to infiltration and inflow
                     (I/I). I/I flows are heavily influenced by seasonal and precipitation events and are present in
                     essentially all gravity collection systems. The City of Staples is committing to an infiltration
                     and inflow reduction program over the next few years in an effort to reduce these large
                     fluctuations in flow.
                     The Minnesota Pollution Control Agency (MPCA) has guidelines for determining flow
                     projections. Future projections developed for different climactic conditions as described. The
                     Average Dry Weather (ADW) flow is based on the flow with no inflow due to precipitation
                     and/or snow melt and no infiltration due to high groundwater. The ADW flow typically
                     occurs in winter months or in very dry summer months. This flow corresponds with water
                     pumped from the drinking water source.
                     The Average Wet Weather (AWW) flow, or peak month flow, is the daily average flow for
                     the wettest 30 consecutive days for mechanical treatment systems such as Staples. AWW
                     flow is based on flow with infiltration due to high groundwater and typical inflow due to
                     precipitation and/or snowmelt. This flow usually occurs in spring and early summer. The
                     Peak Hourly Wet Weather (PHWW) flow is the peak flow during the peak hour of the day at
                     a time when the ground water is high and a five-year storm is occurring. The Peak
Prepared by: Bolton & Menk, Inc.                                                                    DESIGN CONDITIONS
Wastewater Treatment Facility Plan Amendment 1 W13.104619                                                      Page 5
Instantaneous Wet Weather (PIWW) flow is the peak instantaneous flow during the day at a
             time when the ground water is high and a twenty-five year one-hour storm event is occurring.
             This flow is used for sizing pumps and piping systems.
             An MPCA Determination of Design Flows worksheet was prepared using historical
             wastewater treatment facility flow data from the past five years. This worksheet is presented
             in Table 2.3.

                           Table 2.3 Determination of Design Flows - City of Staples

  A)      For Determination of Peak Hourly Wet Weather Design Flow (PHWW)                          gpd
   1      Present peak hourly dry weather flow                                                  1,104,000
   2      Present peak hourly flow during high ground water period (no runoff)                  1,700,000
   3      Present peak hourly dry weather flow [same as (1)]                                  - 1,104,000
   4      Present peak hourly infiltration                                                    = 596,000
        Present hourly flow during high ground water period and runoff at point of
    5 greatest distance between Curves Y and Z
          Present hourly flow during high ground water (no runoff) at same time of day as -
   6    (5) measurement
   7      Present peak hourly flow                                                               =
   8      Present peak hourly inflow adjusted for a 5-year 1-hour rainfall event                    199,000
   9      Present peak hourly infiltration [same as (4)]                                            596,000
  10      Peak hourly infiltration cost effective to eliminate                                   -     0
  11      Peak hourly infiltration after rehabilitation (where rehabilitation is cost effective) = 596,000
  12      Present Peak hourly adjusted inflow [same as (8)]                                         199,000
  13      Peak hourly inflow cost effective to eliminate                                         -     0
  14      Peak hourly inflow after rehabilitation (where rehabilitation is cost effective)       = 199,000
  15      Population increase __0__ @ _100_ gpcd times 2.5 (peaking factor)                            0
  16      Peak hourly flow from planned industrial increase                                            0
  17      Estimated peak hourly flow from future unidentified industries                               0
  18      Peak hourly flow from other future increases                                                 0
  19      Peak hourly wet weather design flow [(1)+(11)+(14)+(15)+(16)+(17)+(18)]                  1,899,000

       For Determination of Peak Instantaneous Wet Weather Design Flow
                                                                                                     gpd
  B) (PIWW)
  20   Peak hourly wet weather design flow [same as (19)]                                          1,899,000
       Present peak hourly inflow adjusted for a 5-year 1-hour rainfall event [same as
                                                                                               -   199,000
  21 (8)]
  22   Present peak inflow adjusted for a 25-year 1-hour rainfall event                       + 271,000
  23   Peak instantaneous wet weather design flow                                             = 1,971,000

  C)      For Determination of Average Dry Weather Design Flow (ADW)                                 gpd
  24      Present average dry weather flow                                                         241,000
Prepared by: Bolton & Menk, Inc.                                                          DESIGN CONDITIONS
Wastewater Treatment Facility Plan Amendment 1 W13.104619                                            Page 6
25 Population increase __494__ @ _100_ gpcd + 49,400
26 Average flow from planned industrial increase + 0
27 Estimated average flow from other future unidentified industries + 0
28 Average flow from other future increases + 0
29 Average dry weather design flow [(24)+(25)+(26)+(27)+(28)] = 290,400
D) For Determination of Average Wet Weather Design Flow (AWW) gpd
30 Present average dry weather flow 241,000
31 Average infiltration after rehabilitation (where rehabilitation is cost effective) + 292,200
32 Average inflow after rehabilitation (where rehabilitation is cost effective) + 97,400
33 Population increase __494__ @ _100_ gpcd + 49,400
34 Average flow from planned industrial increase + 0
35 Estimated average flow from future unidentified industries + 0
36 Average flow from other future increases + 0
37 Average wet weather design flow [(30)+(31)+(32)+(33)+(34)+(35)+(36)] = 680,000
The ADW flow determined by this worksheet is 0.29 MGD and the AWW flow is 0.68
MGD. These flows are similar to the existing design flows, which were determined in 1991.
There are several reasons why the design flows from 1991 may match the current design
flows, including conservative planning in 1991.
WASTEWATER LOADINGS
Pollutant loadings for the design year are required to size a wastewater treatment facility.
Projected loadings are calculated by determining a pounds-per-capita-per-day (lb/capita/day)
value for five-day carbonaceous biochemical oxygen demand (CBOD5), total suspended
solids (TSS), and phosphorus (P) and multiplying this value by the projected population.
Historical loading rates and per-capita values for the City of Staples are presented in Table
2.4.
Table 2.4 Historical Influent Loadings - City of Staples
Parameter 2007 2008 2009 2010 2011
Population 3,146 3,131 3,099 2,981 2,976
CBOD5: Influent Load (lb/day) 627 535 553 509 409
CBOD5: Per Capita Load (lb/day) 0.199 0.171 0.178 0.171 0.138
TSS: Influent Load (lb/day) 694 564 578 500 534
TSS: Per Capita Load (lb/day) 0.221 0.180 0.187 0.168 0.179
Phosphorus: Influent Load (lb/day) 19.91 17.27 22.12 20.60 15.36
Phosphorus: Per Capita Load (lb/day) 0.0063 0.0055 0.0071 0.0069 0.0052
Figure 2.3 presents a chart of the historical CBOD5 and TSS loadings.
Prepared by: Bolton & Menk, Inc. DESIGN CONDITIONS
Wastewater Treatment Facility Plan Amendment 1 W13.104619 Page 7Figure 2.3 - Historical CBOD5 and TSS Loading
Staples Wastewater Treatment Facility
Influent Loading (lb/day)
Month-Year
Influent CBOD5 Permitted CBOD5
Influent TSS Permitted TSS
Figure 2.3: Historical CBOD5 and TSS Loading
The existing loadings have spiked over the permitted CBOD5 loading of 730 lb/day and the
permitted TSS loading of 850 lb/day on a regular basis over the past ten years. The influent
CBOD5 typically peaks during the spring months and exceeded the permitted and design
values almost every year. The influent TSS follows a similar trend.
Existing flows and loadings are used in conjunction with projected growth to develop design
flows and loadings. Design parameters are presented in Table 2.5.
Prepared by: Bolton & Menk, Inc. DESIGN CONDITIONS
Wastewater Treatment Facility Plan Amendment 1 W13.104619 Page 8Table 2.5 Design Wastewater Flows and Loadings - City of Staples
Parameter Value Unit
Design Year 2035 -
Design Population 3,791 persons
Average Dry Weather (ADW) Flow 0.290 MGD
Average Wet Weather (AWW) Flow 0.680 MGD
Peak Hourly (PHWW) Flow 1.90 MGD
Peak Instantaneous (PIWW) Flow 1.97 MGD
Biochemical Oxygen Demand, Carbonaceous 5-day (CBOD5) 730 lb/day
Total Suspended Solids (TSS) 850 lb/day
Total Phosphorus (P) 27 lb/day
Total Mercury Monthly Average (Hg) 10 ng/l
MERCURY
Approximately two-thirds of the water on Minnesota’s 2014 Impaired Waters List is due to
mercury. Mercury is a powerful neurotoxin that can enter the environment through a variety
of methods such as volcanoes, burning fossil fuels, mining, metal processors, and gas
combustion. The mercury often ends up in the bottoms of lakes and oceans where it
accumulates in fish. As humans eat the fish, they are exposed to the mercury which
accumulates in their bodies and can become toxic. The MPCA is implementing a TMDL by
2025 to reduce the mercury released into the environment. Identifying the potential sources
of the mercury is the first step in minimizing the discharge of mercury from the wastewater
treatment facility into rivers and streams. The following is a list of activities or businesses
which may have historically shown the potential to be significant sources of mercury.
• Hospitals
• Dentists
• Electroplaters
• Metal Finishers
• Schools
• Septic Haulers
• Industrial Laundries
• Laboratories
• Veterinary Clinics
• Printing Industry
• Pottery and Arts
• Automobile Service
• Painting and Paint Stripping
Prepared by: Bolton & Menk, Inc. DESIGN CONDITIONS
Wastewater Treatment Facility Plan Amendment 1 W13.104619 Page 9• Landfill Leachate
• Scrap Dealers
Table 2.6 WWTP Mercury – City of Staples
Date Influent Mercury (ng/l) Effluent Mercury (ng/l)
January 2014 0.01 20
January 2015 158 17
July 2015 307 26
January 2016 48 9
July 2016 117 8.8
January 2017 135 6
July 2017 24 2.5
January 2018 21.7 5.88
Average 101.3 11.9
According to the U.S. Environmental Protection Agency (US EPA) data, typical mercury
concentrations in wastewater treatment facility effluents ranges from 1 to 20 ng/l.
BIOSOLIDS
Sludge produced by the biological process is either injected or surface-sprayed on agricultural
land. The City of Staples has a contract with a local land-owner to allow biosolids to be
spread on a year-round basis. Lack of storage capacity forces the city to continuously using
lime to stabilize the biosolids and then loading it out for land application. Table 2.7 below
shows the amount of biosolids that was land-applied by the city over the past nine years.
Table 2.7 Biosolids Land-Applied – City of Staples
Year Amount Applied
2004 870,400 gallons
2005 771,200 gallons
2006 838,400 gallons
2007 766,400 gallons
2008 806,400 gallons
2009 523,200 gallons
2010 646,400 gallons
2011 758,400 gallons
Average 787,700 gallons
The existing aerobic digesters have a total volume of 152,000 gallons. The recommended
amount of biosolids storage for any facility is at least 180 days to achieve appropriate
stabilization and allow for a condensed period of land-application. Based on the above
information, the City of Staples generates an average of 2,000 to 2,200 gallons of biosolids
per day. With the addition of phosphorus removal, as required by the Facility’s permit, there
Prepared by: Bolton & Menk, Inc. DESIGN CONDITIONS
Wastewater Treatment Facility Plan Amendment 1 W13.104619 Page 10is estimated to be an additional 100 to 150 gallons of biosolids generated per day. Total
biosolids generated per day is estimated to be approximately 2,300 gallons; therefore, in order
to meet the recommendation of 180-days of storage, a total of 415,000 gallons of storage is
required.
CURRENT EFFLUENT LIMITS
Current effluent limits require a monthly average CBOD5 concentration of 25 mg/L or less
and a TSS concentration of 30 mg/L or less. In addition, an 85% removal of CBOD5 and TSS
is required. Projected effluent limits for CBOD5 and TSS are not anticipated to change in the
next permit renewal cycle. The facility now also has a phosphorus mass loading limit, which
is new with the current permit cycle. Existing effluent limits are summarized in Table 2.8.
Table 2.8 Effluent Limits - City of Staples
Parameter Limit
25 mg/l monthly, 85% Removal
5-Day CBOD
40 mg/l max. calendar week average
Dissolved Oxygen (DO) Monitor Only
Fecal Coliform Bacteria
200 organisms/100 mL
(May - October)
Hardness, Calcium and Magnesium Monitor Only
(as CaCO3)
pH 6.0 - 9.0
Total Kjeldahl Nitrogen (TKN) Monitor Only
Total Phosphorous 939 kg/year (2070 lb/year)
Total Residual Chlorine 0.038 mg/L daily max.
30 mg/l monthly, 85% Removal
Total Suspended Solids (TSS)
45 mg/l max. calendar week average
FUTURE EXPECTED EFFLUENT LIMITS
The existing NPDES permit must be renewed every six years. With the upcoming renewal,
the MPCA has kept most of the permit parameters the same, but the facility will now have a
new mercury limit. The MPCA will phase in the new mercury limit if the facility makes
improvements to the facility to meet the mercury limit. If the facility does not make
enhancements to meet the mercury limit, the facility immediately fall under the final mercury
limit.
The new permit levels are show in Table 2.9.
Table 2.9 Future Expected Effluent Limits - City of Staples
Parameter Limit
25 mg/l monthly, 85% Removal
5-Day CBOD
40 mg/l max. calendar week average
Dissolved Oxygen (DO) Monitor Only
Fecal Coliform Bacteria
200 organisms/100 mL
(May - October)
Prepared by: Bolton & Menk, Inc. DESIGN CONDITIONS
Wastewater Treatment Facility Plan Amendment 1 W13.104619 Page 11Hardness, Calcium and Magnesium Monitor Only
(as CaCO3)
pH 6.0 - 9.0
Total Kjeldahl Nitrogen (TKN) Monitor Only
Total Phosphorous 939 kg/year (2070 lb/year)
Total Residual Chlorine 0.038 mg/L daily max.
30 mg/l monthly, 85% Removal
Total Suspended Solids (TSS)
45 mg/l max. calendar week average
50 ng/l daily maximum (interim)
Total Mercury 17 ng/l maximum (final)
10 ng/l monthly average (final)
Prepared by: Bolton & Menk, Inc. DESIGN CONDITIONS
Wastewater Treatment Facility Plan Amendment 1 W13.104619 Page 12III. EVALUATION OF EXISTING FACILITIES
TREATMENT FACILITY
The existing wastewater treatment facility consists of an influent lift station, a manually
cleaned static bar screen, a cyclone grit removal system, two 46,000-gallon aeration basins,
three final clarifiers, a chlorine contact basin, and four 38,400-gallon biosolids digester tanks.
This section reviews the treatment capacity for the various unit processes at the Staples
WWTF based on current design recommendations. This review indicates that the existing
facility is adequate to meet the proposed design average wet weather flow, but is undersized
to meet the proposed peak flow of 1.9 MGD.
Table 3.1 Staples WWTF Unit Process Summary
Maximum Available Capacity
Parameter Value Units Design Criteria AWW PWW CBOD5
(MGD) (MGD) (lb/day)
Static Screens
Number 2 PIWW each
Bar Spacing 0.060 Inches 0.680
Volume 10 ft3/MG
Grit Removal
Number 1 centrifugal 0.680
system
Unit Size 54 inch diameter
95% Capture Size 100 micron
Grit volume 5 ft3/MG
Trickling Filter
Diameter 24 foot
Area 452 ft2
Depth 6 feet min 6 ft
Peak Hydraulic Loading 1.99 gpm/ft2 1.30
BOD Loading 242 lb/1000 ft3 700
Aeration Basins
Number 2 2+
Dimensions 20 x 35 feet
Sidewater Depth 12 feet >10 ft and < 30 ft
Volume 124,000 gallons
Freeboard 0.25 – 2 feet >1.5 ft
Detention Time
ADW Flow 10.2 hours
AWW Flow 4.4 hours
PHWW Flow 1.6 hours
BOD Loading 30 lb/day/1000ft32 units (1965) 8.5 feet min 12 ft
1 unit (1991) 10 feet min 12 ft
Surface Area 1,260 ft2
Surface Settling Rate
ADW Flow 230 gpd/ft2
AWW Flow 540 gpd/ft2 0.68
PHWW Flow 1,507 gpd/ft2The screenings dump from the trough directly into a dumpster on the level below.
The screenings are not adequately dewatered and are taken to the landfill in a
rather wet state. This situation may soon need to change as landfill or waste
management regulations evolve and move towards requiring a drier waste to
allow disposal. Static screens may not be the best application to produce the
desired screenings.
Figure 3.1: Existing Static Screen
Prepared by: Bolton & Menk, Inc. EVALUATION OF EXISTING FACILITIES
Wastewater Treatment Facility Plan Amendment 2 W13.104619 Page 15Figure 3.2: Static Screen Supports
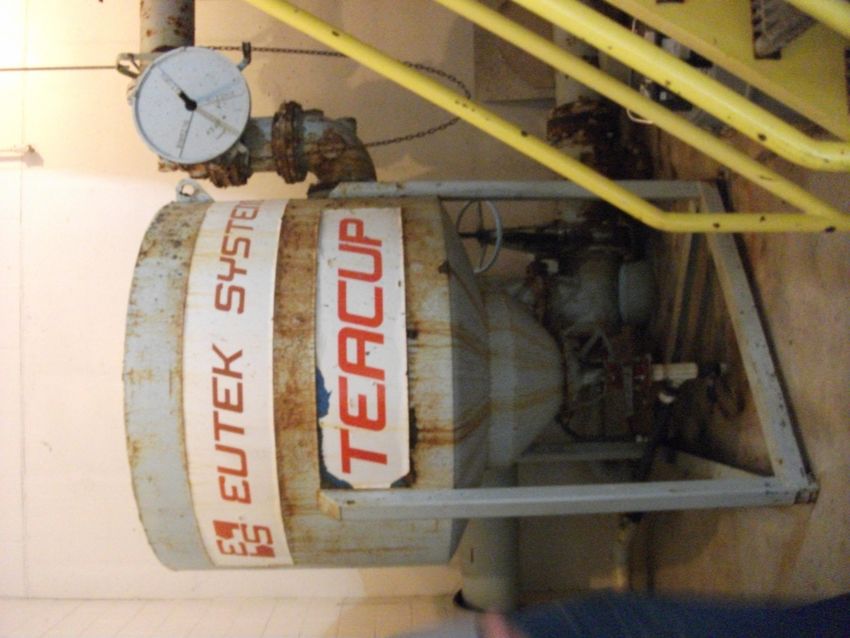
3. Cyclone Grit Remover
Grit is removed with a Eutek Teacup cyclone grit removal system. The system
was installed in 1991 and is in poor condition. The exterior of the Teacup is
showing large amounts of rusting and flaking. This equipment has reached the
end of its useful life and replacement is recommended.
Prepared by: Bolton & Menk, Inc. EVALUATION OF EXISTING FACILITIES
Wastewater Treatment Facility Plan Amendment 2 W13.104619 Page 16Figure 3.3: Eutek Teacup Grit Removal System
4. Trickling Filter
The trickling filter is contained in a square room and has a motor actuated rotor
and four trickling arms. The trickling filter has no recirculation feed which
reduces the effectiveness of the process. The rotor mechanism and granular
media are original from 1991. The mechanism is rusting and the rotor arms have
significant leaks at the end, as well as plugged openings along the arms. The
typical lifespan of granular filter media is 20 years and the media is currently 27
years old. The media has likely reached the end of its lifespan, though it has not
been tested.
The trickling filter bypass pipe leaks where it enters the tricking filter effluent
trough and repairs are required.
Prepared by: Bolton & Menk, Inc. EVALUATION OF EXISTING FACILITIES
Wastewater Treatment Facility Plan Amendment 2 W13.104619 Page 17Figure 3.4: Trickling Filter Arm Prepared by: Bolton & Menk, Inc. EVALUATION OF EXISTING FACILITIES Wastewater Treatment Facility Plan Amendment 2 W13.104619 Page 18
Figure 3.5: Trickling Filter Mechanism

Prepared by: Bolton & Menk, Inc.                                            EVALUATION OF EXISTING FACILITIES
Wastewater Treatment Facility Plan Amendment 2 W13.104619                                            Page 19
Figure 3.6: Bypass Pipe Leak
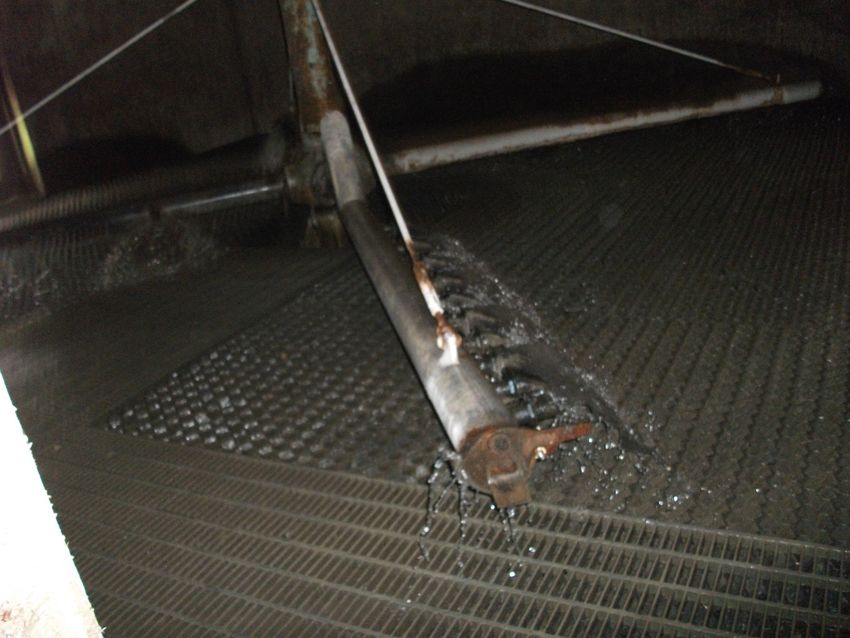
5. Aeration Basins
The trickling filter is followed by a four-way splitter structure and two aeration
basins. Each basin has two influent flow locations. The basins were constructed
in 1965 and the air piping is original to that construction. The basin is
constructed for a modified step influent and short hydraulic and solids retention
times.
The existing basins appear to be in poor condition, though a full inspection
cannot be completed until they are emptied and cleaned. The air piping, headers,
and diffusers are in poor condition and should be replaced. New equipment
improves the efficiency of oxygen transfer to the water.
Prepared by: Bolton & Menk, Inc. EVALUATION OF EXISTING FACILITIES
Wastewater Treatment Facility Plan Amendment 2 W13.104619 Page 20Figure 3.7: Aeration Basin Splitter Box Prepared by: Bolton & Menk, Inc. EVALUATION OF EXISTING FACILITIES Wastewater Treatment Facility Plan Amendment 2 W13.104619 Page 21
Figure 3.8: Aeration Basin Air Header Hoist

                            Figure 3.9: Aeration Basin and Return Sludge Piping
Prepared by: Bolton & Menk, Inc.                                          EVALUATION OF EXISTING FACILITIES
Wastewater Treatment Facility Plan Amendment 2 W13.104619                                          Page 22
6. Final Clarifiers
The splitter box leading to the clarifier has three slide gates. The gates are no
longer functional and do not allow the city to isolate a clarifier. The structure
hydraulics cause overflow and unintentionally bypass the new clarifier in high
flow situations.
The system has three rectangular final clarifiers. Two were constructed in 1965
and one in 1991. All three have the original arms and piping. Chains and
sprockets were replaced as needed on all three clarifiers. The motors were rebuilt
and gearboxes replaced on the older clarifiers within the past five years.
The clarifier structures are generally in fair condition, but the arms, piping, slide
gates and baffle walls are in poor condition for all three clarifiers. The design of
the clarifiers does not meet existing standards on depth associated with chemical
addition necessary for nutrient control. A new mercury limit will be added to the
next wastewater discharge permit, and the inefficiencies of the final clarifiers
pose potential for NPDES permit violations.
Figure 3.10: Older Clarifier
Prepared by: Bolton & Menk, Inc. EVALUATION OF EXISTING FACILITIES
Wastewater Treatment Facility Plan Amendment 2 W13.104619 Page 23Figure 3.11: Influent to Older Clarifier
Figure 3.12: Newer Clarifier
Prepared by: Bolton & Menk, Inc. EVALUATION OF EXISTING FACILITIES
Wastewater Treatment Facility Plan Amendment 2 W13.104619 Page 247. Return Sludge System
The return activated sludge (RAS) system was constructed in 1965 and is in very
poor condition. The RAS splitter box which divides the returned sludge between
the two aeration basins is extremely rusted and in poor structural condition.
Return sludge is pumped by two vertical centrifugal pumps which are an
outdated model. The pumps are in need of rebuilding or replacement and parts
are very difficult to find and can be expensive.
8. Chlorine Contact Basin
The chlorine contact basin is a concrete structure constructed in 1965. The
structure is in generally fair condition, but the basin is inadequately sized for
current and proposed peak flows. The tank has concrete baffle walls which are
four feet apart.
At the beginning of the chlorine contact tank is the draw for a heat exchange
system that the city uses to provide heat to some of the Public Works buildings.
Because this draw is after the chlorine injection point, the system can only be
used during the winter months when the system is not being chlorinated. If the
draw would be relocated to before the chlorine injection point, the system could
be used year-round and provide both heating and cooling.
Dechlorination is achieved at the end of the chlorine contact basin using liquid
chemical stored nearby.
Figure 3.13: Chlorine Contact Basin
Prepared by: Bolton & Menk, Inc. EVALUATION OF EXISTING FACILITIES
Wastewater Treatment Facility Plan Amendment 2 W13.104619 Page 259. Aerobic Digesters
There are four rectangular aerobic digester tanks. Two structures were
constructed in 1965 and two in 1991. The diffusers were all new in 1991. There
are significant concrete repairs necessary on the interior of the basins.
The capacity of the existing digesters equals approximately 50 days of sludge
storage. Due to MPCA sludge stabilization requirements and the limited storage
capacity, the city uses lime to stabilize the sludge prior to land-application.
Because this was not intended in the original design, the city has a cobbled-
together lime stabilization process that is potentially dangerous and is not cost
effective. Lime is added to one basin each week on average and the process is
time consuming and expensive. Longer biosolids storage time would allow for
the lime stabilization process to be eliminated.
Figure 3.14: Lime Feed System
Prepared by: Bolton & Menk, Inc. EVALUATION OF EXISTING FACILITIES
Wastewater Treatment Facility Plan Amendment 2 W13.104619 Page 26Figure 3.15: Aerobic Digesters
10. Chemical Feed Systems
The facility currently feeds chlorine, sodium bisulfite, polymer, and a flocculant
to meet effluent limits.
a) Chlorine System
The city feeds gas chlorine to the beginning of the chlorine contact tank and to
the RAS influent. The chlorine system is in fair condition and can continue to be
used. The chlorine system is currently stored in an open enclosure outside of the
facility that does not provide adequate weather protection during the winter
months. Beginning this year, the city is feeding chlorine to control filamentous
on a year-round basis, and a weather-tight enclosure is necessary. In addition,
the chlorine should be stored in a secure location.
Prepared by: Bolton & Menk, Inc. EVALUATION OF EXISTING FACILITIES
Wastewater Treatment Facility Plan Amendment 2 W13.104619 Page 27Figure 3.16: Chlorine Enclosure
b) Polymer System
The polymer system is located inside of the old control building and is in good
condition. However, the system is not isolated from the other equipment in the
room, particularly the heat exchanger, and does not have sufficient containment.
The operators feel that the polymer pumps are not ideal for continuous use and
would like to see them replaced.
c) Dechlorination
The city feeds sodium bisulfite as a method of chemical dechlorination. This
system includes a chemical tank, containment, a chemical feed pump, tubing, and
an injection port. Since sodium bisulfite in solution freezes at approximately 45
degrees Fahrenheit, a weatherproof shelter with heating system was constructed.
d) Phosphorus Removal
The city added a chemical feed system for use in phosphorus removal in the fall
of 2013.
Prepared by: Bolton & Menk, Inc. EVALUATION OF EXISTING FACILITIES
Wastewater Treatment Facility Plan Amendment 2 W13.104619 Page 2811. Blowers
There are three positive displacement blowers located in the basement of the old
control building. These blowers provide air for the aeration basin diffusers and
the aerobic digester diffusers. The blowers were installed in 1991 and have been
partially submerged in water and repaired several times since then. They are
considered to be at the end of their useful lives and in need of replacement.
Figure 3.17: Blowers
12. Pumps and Piping
There are six pumps throughout the facility: two RAS pumps, two scum pumps,
and two sludge loadout pumps. The six pumps are identical vertical centrifugal
pumps; four of which were installed in 1967 and two in 1991. They have all been
rebuilt several times and are an outdated model that is very difficult to find parts
for, and it is recommended these pumps be replaced as the expected life of
equipment is 20 years.
In general the piping and valves throughout the facility are in fair condition.
There are several valves that will likely need to be replaced through this project.
13. Control Buildings
There are two controls buildings at this facility. The old control building was
originally constructed in 1965 and is now used for secondary uses. The main
floor contains the heat exchanger, the polymer system, and the electrical panel
for the equipment installed in 1965. The basement contains the blowers, pumps
and piping, and pressure filter for facility water.
Prepared by: Bolton & Menk, Inc. EVALUATION OF EXISTING FACILITIES
Wastewater Treatment Facility Plan Amendment 2 W13.104619 Page 29The new control building was constructed in 1991 and contains the pretreatment
units and trickling filter, the electrical system for all of the equipment installed in
1991, and the office.
The old control building is in poor condition and is not being fully utilized. The
new control building is in good condition and generally needs little repair work.
14. Sludge Tanker Truck
The city has a new sludge tanker truck that is used year-round for sludge loading
and land-application. Because the old truck was stored in the basement of the
control building, wastewater fumes have caused the electrical system to degrade
and replacement is required for several items.
Prepared by: Bolton & Menk, Inc. EVALUATION OF EXISTING FACILITIES
Wastewater Treatment Facility Plan Amendment 2 W13.104619 Page 30IV. WASTEWATER TREATMENT FACILITY IMPROVEMENTS
GENERAL
In the following paragraphs, several categories of alternatives are given general
consideration. Alternative solutions include: 1) optimization of operation and/or rehabilitation
of existing facilities, 2) regionalization, or 3) construction of a new facility.
Optimization of operation and rehabilitation/expansion of existing facilities includes
improvements to the facility and site to make the treatment process more effective and
efficient. Components of the existing facility are in fair condition, but the process will not
meet future effluent limits or treatment goals.
Construction of a new or expanded facility is proposed to be completed on the existing site.
Various construction options are discussed further in this report.
1. Optimization of Operation and/or Rehabilitation of Existing Facilities
The existing facility has maintained adequate treatment to meeting effluent
requirements. However, the facility’s proposed peak flow is higher than the
current design peak flow. The existing system potentially could be rehabilitated
and improved to provide required capacity and ensure future effluent quality
remains adequate.
2. Regionalization
This category includes the possibility of diverting wastewater from the city to the
wastewater treatment facility of a nearby community. A lift station with large
pumps and a significant length of forcemain is typically required for
regionalization, along with the demolition or mothballing of the existing
treatment facility.
The flows from the City of Staples are quite large and regionalization for this
quantity of wastewater would be very difficult. Due to the distance and costs
associated with regionalization in comparison to the magnitude of the required
facility improvements, regionalization was not considered feasible at this time.
3. Construction of a New Facility
The current facility is a mechanical treatment facility with continuous discharge.
The current treatment processes are adequate to meet existing effluent limits.
The facility may not be able to meet the new mercury limit. Based on existing
sampling, the facility would have violated the proposed limit in the past five
years. Construction of a new mechanical facility would require the demolition of
the existing facility and the construction of a new facility, which would contain
similar processes to the existing one. Constructing a new facility would allow
the City of Staples to effectively and reliably treat the wastewater to permitted
standards.
WASTEWATER TREATMENT FACILITY IMPROVEMENTS
The recommended improvements discussed in this section are based on optimization and
rehabilitation of the existing facility. There are four alternatives discussed:
• Alternative 1: Moderate Improvements to Optimize Current Processes
• Alternative 2: Rehabilitation of Facility with Addition of Flow Equalization
• Alternative 3: Rehabilitation of Facility with Addition of Extended Aeration Process
Prepared by: Bolton & Menk, Inc. WASTEWATER TREATMENT FACILITY IMPROVEMENTS
Wastewater Treatment Facility Plan Amendment 2 W13.104619 Page 31• Alternative 4: Construction of New Extended Aeration Activated Sludge Treatment
Facility
1. Alternative 1: Moderate Improvements to Optimize Current Processes
Alternative 1 includes a significant rehabilitation of all existing unit processes
and modification of the chlorine contact basin to increase length-to-width ration.
In addition, it includes constructing a new return activated sludge (RAS) system,
and provided adequate containment for chemical feed systems. Table 4.1 presents
a summary of the recommended improvements, based on the condition of the
processes described above in Section 3.
Table 4.1 Alternative 1: Moderate Improvements to Optimize Current Processes
Pretreatment • Rebuild static screen gear boxes
• Construct new static screen support structure
• Install screenings/dewatering press
• Replace centrifugal grit removal system
Trickling Filtration • Replace trickling filter drive and arms
• Replace media
• Install recirculation pipe/pumps
• Install bypass pipe to bypass portion of flow to filter
Aeration • Replace fine bubble diffusers and air piping
• Replace RAS system
• Replace the blowers
• Raise the elevation of the wall at the effluent end of the basins
Final Clarification • Replace piping and mechanism parts as required
• Add baffle walls to prevent short-circuiting
Disinfection • Remove existing baffle walls and install new fiberglass baffle walls
2’ apart from each other
• Install sulfur dioxide system for dechlorination
Biosolids Storage and Handling • Construct a 265,000 gallon biosolids holding tank
• Modify loadout piping to accommodate new tank
• Provide exterior loadout area
Chemical Phosphorus Removal • Install ferric chloride feed system for phosphorus removal
Other Chemical Feed Systems • Rehabilitate existing “old” control building into chemical building
with rooms for ferric chloride, polymer, chlorine, and sulfur
dioxide or sodium bisulfate
Pumps and piping • Rehabilitate RAS, scum, and sludge loadout pumps as needed
• Provide a recirculation pump for the trickling filter
• Replace some valves and piping throughout the facility as needed
Control Building • None
Miscellaneous • Repair or rehabilitate steel building over aeration/biosolids
storage area as necessary
Alternative 1 allows the city to continue to use the processes that the operators
are familiar with, rehabilitates equipment that is in poor condition, and provides
dedicated and safe spaces for all chemicals.
Prepared by: Bolton & Menk, Inc. WASTEWATER TREATMENT FACILITY IMPROVEMENTS
Wastewater Treatment Facility Plan Amendment 2 W13.104619 Page 32Alternative 1 does not include any improvements that would allow the facility to
operate more efficiently under current peak flow events or meet the proposed
peak flows. However, the city intends to research and implement an infiltration
and inflow reduction program and hopes to eliminate a portion of those peak
flows.
The reliance on unit processes, piping, and some valves that have been in service
since 1965 (50+ years) exposes the city to risk of significant future costs. This
risk is too great and is not further considered.
Replacing the chlorine contact tank baffle walls with fiberglass baffles only 2-
feet apart will increase the contact time in the basin to approximately 21 minutes
at the existing peak flow of 1.3 MGD and to 14.5 minutes at the proposed peak
flow of 1.9 MGD.
2. Alternative 2: Rehabilitation of the Facility with the Addition of Flow
Equalization
Alternative 2 includes moderate to extensive rehabilitation of the pretreatment
processes, the trickling filter, and the existing aeration basin, as well as
construction of a flow equalization basin, two new final clarifiers, and a new
chlorine contact chamber. A summary of these recommendations is provided in
Table 4.2 below.
Table 4.2 Alternative 2: Rehabilitation of Existing Facility with the Addition of Flow Equalization
Pretreatment • Rebuild static screen gear boxes
• Construct new static screen support structure
• Install screenings/dewatering press
• Replace centrifugal grit removal system
Trickling Filtration • Replace trickling filter drive and arms
• Replace media
• Install recirculation pipe/pumps
• Install bypass pipe to bypass portion of flow to filter
Aeration • Replace fine bubble diffusers and air
• Replace RAS system
• Replace the blowers
• Raise the elevation of the wall at the effluent end of the
basins
Final Clarification • Construct two new 35-foot diameter circular final clarifiers
• Provide automatic wasting
Disinfection • Construct new chlorine contact basin
• Install sulfur dioxide or sodium bisulfite system for total
chlorine residual reduction
Flow Equalization • Construct a 1.0 million gallon flow equalization basin (75-foot
diameter, 30-foot depth) and associated piping
Biosolids Storage and Handling • Convert the existing final clarifiers and chlorine contact
chamber into additional biosolids storage (add approximately
100,000 gallons or 40 additional days of storage)
• Replace the coarse bubble diffusers in the existing storage
tanks
Prepared by: Bolton & Menk, Inc. WASTEWATER TREATMENT FACILITY IMPROVEMENTS
Wastewater Treatment Facility Plan Amendment 2 W13.104619 Page 33• Extend sludge loadout piping out of garage so that loading
into a larger tank is possible
• Potentially replace existing tank truck with larger truck or
tractor and tank combination
Chemical Phosphorus Removal • Install ferric chloride feed system for phosphorus removal
Other Chemical Feed Systems • Rehabilitate existing “old” control building into chemical
building with rooms for ferric chloride, polymer, chlorine, and
sulfur dioxide or sodium bisulfate
Pumps and piping • Replace RAS, scum, and sludge loadout pumps
• Provide a recirculation pump for the trickling filter
• Replace valves and piping throughout the facility as needed
Control Building • Rehabilitate existing MCCs, including consolidating both MCC
units in the “new” control building
• Repair or replace building HVAC as required
Miscellaneous • Repair or rehabilitate steel building over aeration/biosolids
storage area as necessary
Alternative 2 allows the city to continue using the existing processes that the
operators are familiar with and provides flow equalization, dedicated and safe
spaces for all chemicals, and rehabilitates or replaces equipment in poor
condition. It provides dechlorination and phosphorus removal systems as
required by the Facility’s most recent NPDES permit. This alternative provides
new final clarifiers which will allow the facility to easily handle current and
proposed peak flows and a new chlorine contact tank that has adequate chlorine
contact time and sufficient space for dechlorination. It also provides some
additional biosolids storage, though it may not provide enough holding time to
complete eliminate the lime stabilization process. Other aspects to consider
include the fact that the proposed flow equalization basin is quite large for the
property and the improvements only provide 100 days of sludge storage, while
180 days is recommended.
The reliance on unit processes, piping, and some valves that have been in service
since 1965 (50+ years) exposes the city to risk of significant future costs. This
risk is too great and is not further considered.
3. Alternative 3: Rehabilitation of Facility with Addition of Extended Aeration
Process
Alternative 3 includes rehabilitation of the pretreatment processes and the
trickling filter, as well as construction of an activated sludge process and a new
chlorine contact chamber. A summary of the recommendations for this
alternative can be seen below in Table 4.3.
Table 4.3 Alternative 3: Rehabilitation of Facility with Addition of Extended Aeration Process
Pretreatment • Rebuild static screen gear boxes
• Construct new static screen support structure
• Install screenings/dewatering press
• Replace centrifugal grit removal system
Trickling Filtration • Replace trickling filter drive and arms
Prepared by: Bolton & Menk, Inc. WASTEWATER TREATMENT FACILITY IMPROVEMENTS
Wastewater Treatment Facility Plan Amendment 2 W13.104619 Page 34• Replace media
• Install recirculation pipe/pumps
• Install bypass pipe to bypass portion of flow to filter
Aeration • Construct three chamber concrete aeration basin with a hydraulic
retention time of 18 hours
Final Clarification • Construct two new 35-foot diameter circular final clarifiers
• Provide automatic wasting
Disinfection • Construct new chlorine contact basin
• Install sulfur dioxide or sodium bisulfite system for total chlorine
residual reduction
Biosolids Storage and Handling • Convert the existing aeration basin, final clarifiers and chlorine
contact chamber into additional biosolids storage
• Replace the coarse bubble diffusers in the existing storage tanks
and install coarse bubble diffusers in the existing aeration basin
(for use in biosolids storage)
• Extend sludge loadout piping out of garage so that loading into a
larger tank is possible
• Potentially replace existing tank truck with larger truck or tractor
and tank combination
Chemical Phosphorus Removal • Install ferric chloride feed system for phosphorus removal
Chemical Mercury Removal • Install ferric chloride feed system for mercury removal
Other Chemical Feed Systems • Rehabilitate existing “old” control building into chemical building
with rooms for ferric chloride, polymer, chlorine, and sulfur
dioxide or sodium bisulfite
Pumps and piping • Replace RAS, scum, and sludge loadout pumps
• Replace valves and piping throughout the facility as needed
Control Building • Rehabilitate existing MCCs, including consolidating both MCC
units in the “new” control building
• Install electrical as necessary for new process equipment
• Repair or replace building HVAC as required
Miscellaneous • Repair or rehabilitate steel building over biosolids storage area as
necessary
Alternative 3 provides rehabilitated and new process equipment for the entire
facility, does not require flow equalization, and provides additional biosolids
storage space. It also provides dechlorination and phosphorus removal systems as
required by the Facility’s most recent NPDES permit. With the additional sludge
storage space, there will be approximately 150 days of sludge storage. As a
result, the biosolids will have time to thicken and will potentially be able to meet
required standards without the addition of lime stabilization. However, this
alternative does not provide 180 days of sludge storage as recommended and will
require the operators to learn and operate a new treatment process.
The reliance on unit processes, piping, and some valves that have been in service
since 1965 (50+ years) exposes the city to risk of significant future costs. This
risk is too great and is not further considered.
4. Alternative 4: New Extended Aeration Activated Sludge Treatment Facility
Alternative 4 includes the construction of a new extended aeration activated
sludge treatment facility. The existing facility would be abandoned due to age,
Prepared by: Bolton & Menk, Inc. WASTEWATER TREATMENT FACILITY IMPROVEMENTS
Wastewater Treatment Facility Plan Amendment 2 W13.104619 Page 35You can also read