Numerical Analysis of Azimuth Propulsor Performance in Seaways: Influence of Oblique Inflow and Free Surface
←
→
Page content transcription
If your browser does not render page correctly, please read the page content below
Journal of
           Marine Science
           and Engineering

Article
Numerical Analysis of Azimuth Propulsor
Performance in Seaways: Influence of Oblique
Inflow and Free Surface
Nabila Berchiche, Vladimir I. Krasilnikov * and Kourosh Koushan
 SINTEF Ocean, P.O. Box 4762 Torgard, N-7465 Trondheim, Norway; nabila.berchiche@gmail.com (N.B.);
 Kourosh.Koushan@sintef.no (K.K.)
 * Correspondence: Vladimir.Krasilnikov@sintef.no; Tel.: +47-92-09-08-84

 Received: 28 February 2018; Accepted: 27 March 2018; Published: 5 April 2018

 Abstract: In the present work, a generic ducted azimuth propulsor, which are frequently installed on
 a wide range of vessels, is subject to numerical investigation with the primary focus on performance
 deterioration and dynamic loads arising from the influence of oblique inflow and the presence of free
 surface. An unsteady Reynolds-Averaged Navier-Stokes (RANS) method with the interface Sliding
 Mesh technique is employed to resolve interaction between the propulsor components. The VOF
 formulation is used to resolve the presence of free surface. Numerical simulations are performed,
 separately, in single-phase fluid to address the influence of oblique inflow on the characteristics
 of a propulsor operating in free-sailing, trawling and bollard conditions, and in multi-phase flow
 to address the influence of propulsor submergence. Detailed comparisons with experimental data
 are presented for the case of a propulsor in oblique flow conditions, including integral propulsor
 characteristics, loads on propulsor components and single blade loads. The results of the study
 illustrate the differences in propulsor performance at positive and negative heading angles, reveal
 the frequencies of dynamic load peaks, and provide quantification of thrust losses due to the effect of
 a free surface without waves. The mechanisms of ventilation inception found at different propulsor
 loading conditions are discussed.

 Keywords: CFD; RANS; azimuth propulsor; unsteady loads; ventilation

1. Introduction
     Pushing type ducted azimuth propulsors have become a very popular solution for propulsion
system on such vessels as tugboats, anchor handlers, offshore supply vessels, research vessels and
others. They are found to combine the advantages of ducted propellers under heavy loading with
the superior maneuvering characteristics of pod propulsors at low speed operation, while offering
reasonable efficiency in free sailing. At the same time, azimuth propulsors may experience considerable
deterioration in their performance characteristics and come at risk of failure due to high dynamic loads
arising from various factors. Heavy propeller loading in combination with large azimuth angles is
the frequent scenario at low speed operation that results in unsteady loads of high amplitude on the
whole propulsor as well as on the individual propeller blades. These loads put extra demands on
the structural strength of propulsor, and reliability of blade bearings and transmission mechanisms.
The operation conditions are further complicated by vessel drift, presence of sea current, orbital
velocities induced by free surface waves, and wave induced ship motions. Massive flow separation
develops on propulsor components such as pod housing and ducts, which makes the inflow on a
pushing propeller highly inhomogeneous. As a consequence, propeller blades may experience sheet
and vortex cavitation of an unsteady nature, causing increased levels of noise and vibration, and posing

J. Mar. Sci. Eng. 2018, 6, 37; doi:10.3390/jmse6020037                          www.mdpi.com/journal/jmse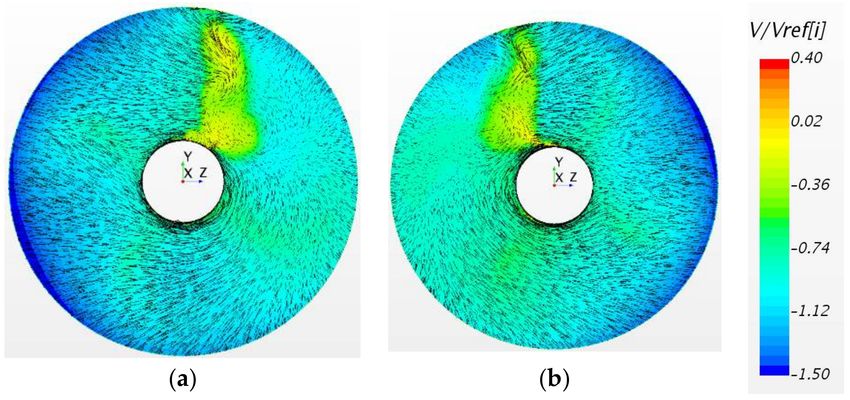
J. Mar. Sci. Eng. 2018, 6, 37                                                                     2 of 24

the danger of blade erosion. Operation in the vicinity of free surface is associated with the risk of
ventilation. The aforementioned aspects of propulsor operation are the focus of the ongoing R&D
Project “INTER-THRUST” supported by the MARTEC II ERA-NET program (Maritime Technologies),
where the authors participate on behalf of SINTEF Ocean (formerly known as MARINTEK).
      The complexity of hydrodynamic interactions taking place between the components of a ducted
azimuth propulsor has been noted in a number of studies [1,2]. Advanced numerical methods such as
those of Computational Fluid Dynamics (CFD) need to be employed when targeting improvements
in propulsor design and its operational reliability. For the successful implementation of CFD results
in design practice, validation is however crucial. While there is a considerable amount of validation
material on pod propulsors with open propellers [3–6] and shaft ducted propellers [7,8], for ducted pod
propulsors, the available data are quite limited. The majority of CFD models currently employed for the
numerical simulation of pod propulsors are based on the unsteady Reynolds-Averaged Navier-Stokes
(RANS) method with one or another isotropic turbulence closure model [9–11]. The SST k-ω turbulence
model is by far the most popular choice in this type of simulation, whether one considers an open
propeller case [3] or a ducted propeller case [8,12]. In model scale analyses, the GaReTheta transition
model based on the SST k-ω model formulation is more and more frequently employed to address
the influence of laminar-turbulent flow transition at low Reynolds numbers [6,13,14]. More advanced
turbulence modelling approaches such as. for example, Detached Eddy Simulation (DES) gradually
find their way into the engineering analyses, in particular, to address the scenarios where complex
unsteady interaction and massive separation are the salient flow features, as in the case of a podded
thruster turning with constant azimuth speed [15]. As regards computational mesh, many authors
favour unstructured meshing approaches that offer ease of mesh generation and greater flexibility
compared to structured meshes, when dealing with complex geometries. Adaptive mesh techniques
are shown to have certain advantages in modelling pod propulsors operating at very large heading
angles [16]. In the present work, the authors attempt a detailed validation study with the generic model
of a ducted azimuth thruster tested earlier at the SINTEF Ocean laboratory. The comparisons between
the numerical simulations and experiments cover a range of operational conditions from bollard to
free sailing, and a range of propulsor heading angles, at fixed propeller RPM and zero azimuth speed,
in unbounded flow. Both the total forces and moments acting on the unit and its components such
as the propeller, duct and gear housing, and loads on single blade are compared. Separately, CFD
calculations are performed with the same thruster operating in the presence of an initially undisturbed
free surface, at different magnitudes of submergence and different propulsor loading conditions,
in order to quantify the impact of free surface presence and ventilation phenomenon on propulsor
thrust losses and individual blade loads. The findings regarding the trends in propulsor characteristics
are supported by the analysis of underlying flow mechanisms.

2. Propulsor Model and Simulated Conditions
      The main characteristics of the generic model of the azimuth ducted pushing thruster tested in the
towing tank at SINTEF Ocean and used in the CFD simulations are given in Table 1. A picture showing
the general view of the test setup is presented in Figure 1. A more detailed model specification,
including propeller blade drawings, is found in [17]. Regarding the propeller model, it has to be
noted that the blade design represents a compromise solution between an open propeller and a ducted
propeller, since the same propeller model and the same pod unit have been tested earlier in both the
ducted and open configurations [3,18].
      The model tests in oblique flow are conducted at constant propeller shaft immersion of 345 mm
(1.38 Dp, where Dp is the propeller diameter). A plate is mounted on top of the thruster to avoid wave
generation and aeration. Nevertheless, at high heading angles propeller rate of revolution had to be
reduced, in order to avoid aeration and mitigate excessive free surface disturbance. The propeller
was driven by an electric motor installed on top of the thruster via a right-angle transmission gear.
A six-component balance was positioned on top of the thruster unit to measure total loads on the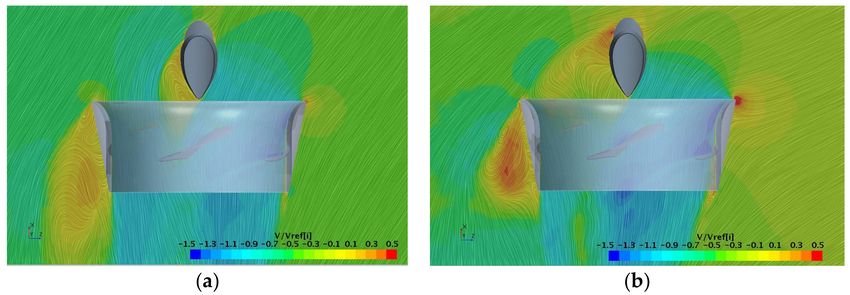
J. Mar. Sci. Eng. 2018, 6, 37                                                                         3 of 24

thruster, including propeller, but excluding the duct. A cylindrical rod of 35 mm diameter connected
the duct to the two force transducers, which separately measured the axial and transverse forces acting
on the duct. A propeller balance measured propeller thrust and torque, the measured signals being
wirelessly transmitted to the acquisition system. During the blade load measurements, one of the
propeller blades was mounted on a blade dynamometer placed inside the hub. A pulse meter on the
shaft provided propeller rate revolutions, while another pulse meter inside the thruster registered the
angular position of the reference blade. An angular meter was installed on top of the rig to measure
the heading angle of the unit.

                                Table 1. Main particulars of the tested propulsor model.

                                  Thruster Particular                                      Value
         Vertical distance from propeller centre to upper end of strut (mm)                 342
                                Gondola length (mm)                                         181
                               Strut chord length (mm)                                       86
                        Propeller P-1374 direction of rotation                         Right-handed
                             Propeller diameter, Dp (mm)                                    250
                                 Hub diameter (mm)                                           60
                              Design pitch ratio, P0.7 /Dp                                  1.1
                                Blade skew (degrees)                                        25
                              Expanded blade area ratio                                     0.6
                                  Number of blades                                            4
                                       Duct type                                           19A
                                  Duct length (mm)                                          125
                              Duct inner diameter (mm)                                    252.78
                              Blade tip clearance, tc/Dp                                  0.0056
                           Duct max. outer diameter (mm)                                  303.96
                           Duct leading edge radius (mm)                                   2.78
                           Duct trailing edge radius (mm)                                  1.39

                                      Figure 1. General view of model test setup.

     The tests are performed at different heading angles ranging from −90◦ to +90◦ , at both negative
and positive advance coefficients. The measured forces and moments include propeller thrust and
torque, duct thrust and side force, total thrust and total side force, steering moment, blade thrust
and torque, and blade spindle and bending moments. The conditions selected for the numerical
simulations and comparisons with experimental data in oblique unbounded flow are summarized in
Table 2. The simulation conditions in the presence of free surface are reduced in Table 3.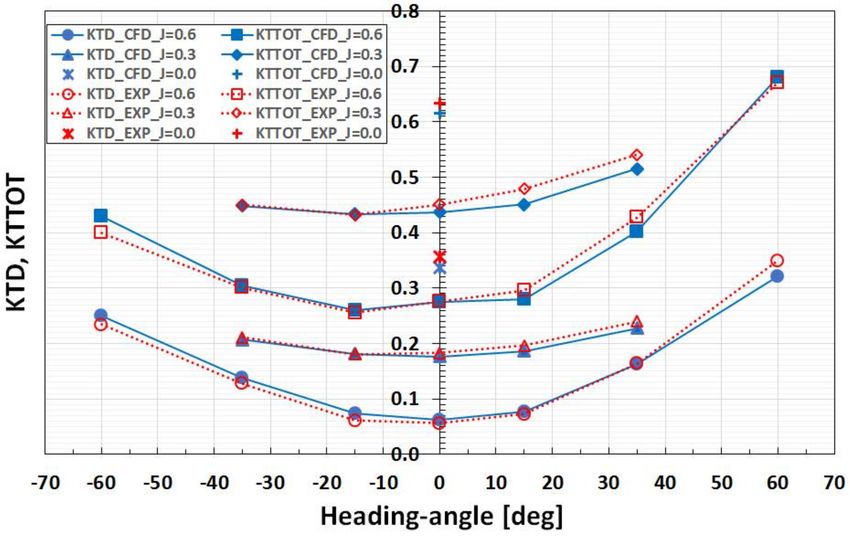
J. Mar. Sci. Eng. 2018, 6, 37                                                                                                   4 of 24

                                  Table 2. Simulation conditions in oblique unbounded flow.

                                Advance Coefficient, J 1                         Heading Angle (◦ )
                                    0.6 (free sailing)                            ±60, ±35, ±15, 0
                                     0.3 (trawling)                                 ±35, ±15, 0
                                       0 (bollard)                                       0
                                                           1   J = V/(n × Dp).

                                   Table 3. Simulation conditions in presence of free surface.

             Advance Coefficient, J                  Heading Angle (◦ )                   Submergence, H/Dp 1
                   0.6 (free sailing)                             0                 2, 1.7, 1.5, 1.3, 1.0, 0.9, 0.8, 0.6, 0.5
                    0.2 (trawling)                                0                          1.5, 1.0, 0.9, 0.8, 0.7
                      0 (bollard)                                 0                            1.0, 0.9, 0.8, 0.7
             1   H is the vertical distance from propeller center to water surface level; Dp is the propeller diameter.

       The thrust force, T, is defined along the propeller shaft axis, and is positive forward. The side force,
S, is the horizontal force perpendicular to propeller shaft axis, and is positive to portside. The steering
moment, MY, is positive in an anti-clockwise direction when viewing from above. The blade loads are
defined in the local Cartesian blade coordinate system with the origin at the blade root, and Yb-axis
along the Blade Reference Line. The blade thrust, Tb, is positive in the direction of the propulsor thrust
force. The blade torque, MXb, the blade spindle moment, MYb, and the blade bending moment, MZb,
are positive in an anti-clockwise direction when viewing from the end of the respective axes of the
blade coordinate system. Positive heading angles correspond to crossflow from portside. Propulsor
submergence is defined as the vertical distance from propeller center to water surface level. These
definitions and sign conventions are illustrated in Figure 2.

      Figure 2. Definitions of forces and moments and sign conventions: (a) propulsor loads; (b) blade loads.

      The standard definition of advance coefficient is used as follows: J = V/(n × Dp), V being the
speed of inflow, and n being the propeller rate of revolution. In all simulations, the blade pitch setting
is P(0.7)/Dp = 1.10, which corresponds to the design pitch. At this pitch setting, the operation point
J = 0.6 selected for free sailing conditions is near the maximum of propulsor efficiency. All numerical
simulations are performed in model scale conditions, and propeller rate of revolution is fixed to
11 (rps), according to model tests. The speed of inflow V corresponding to the speed of towing carriage
in model tests equals to V = 1.65 (m/s) at J = 0.6, and it equals 0.55 (m/s) at J = 0.2.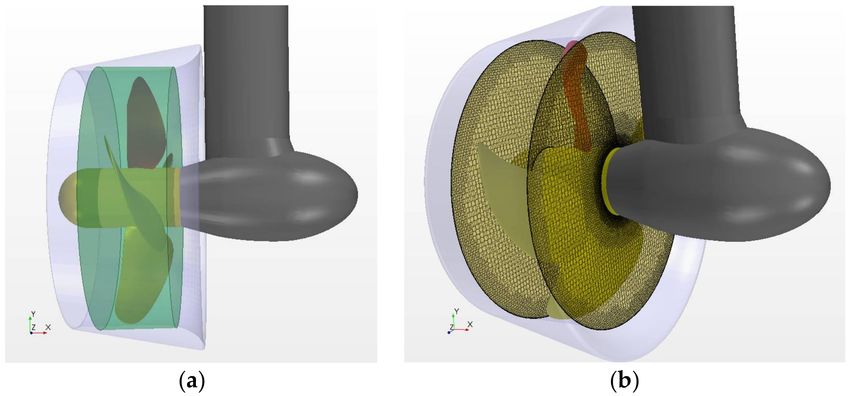
J. Mar. Sci. Eng. 2018, 6, 37                                                                                      5 of 24

3. Numerical Method
     The unsteady RANS equations are solved in the commercial solver STAR-CCM+ (Version
11.02.010), using a finite volume method, to simulate the flow around the studied propulsor. For the
resolution of interaction between the rotating and stationary components of propulsor, the interface
sliding mesh technique is employed, which allows the mesh region containing the propeller to rotate
at the same rotational speed as that of the propeller with respect to the outer region of stationary fluid.
The implicit unsteady method is used with a first-order temporal discretization scheme. The flow is
considered fully turbulent, and the Shear-Stress-Transport (SST) k-ω model is used for turbulence
closure in most of the simulations, except additional test calculations in straight flow condition,
where the GaReTheta transition model based on the same SST k-ω model formulation has been used.
The turbulence models are used in combination with All-Y+ wall treatment approach as implemented
in STAR-CCM+. In the problem, involving the presence of free surface, an Eulerian Multiphase Mixture
formulation is employed, with the Volume of Fluid (VOF) method and the Flat VOF Wave model to set
up the free surface conditions. The High-Resolution Interface Capturing (HRIC) scheme is used for
tracking the water-air interface. No cavitation model is included in the analyses, since the intention
was to separate, in the present study, the pure effects of free surface and ventilation.
     The computational domain consists of two sub-domains (mesh regions): (1) a rotating sub-domain
that contains the propeller, part of the hub and part of the duct above the propeller; and (2) a stationary
sub-domain that includes the pod gondola and strut, and parts of the duct and hub, which are not in
the rotating propeller region. The rotating sub-domain is a cylinder surrounding the propeller. Both its
upstream and downstream boundaries are located at 0.15 Dp, as shown in Figure 3. In the present
approach, the circumferential boundary of the rotating propeller region coincides with the duct inner
surface. Therefore, only two sliding interfaces—upstream and downstream—are created between the
stationary and rotating mesh regions.

      Figure 3. Rotating propeller region and sliding mesh interfaces: (a) propeller region; (b) sliding interfaces.

     The boundary condition on the duct inner surface inside the rotating region is satisfied by setting
the wall rotation velocity to zero. In earlier studies, this approach has been tested against a more
traditional approach that implies the use of a complete cylindrical region around the propeller, with
additional circumferential sliding interface in the gap between the blade tip and duct inner surface.
Both the aforementioned approaches bring very close results in terms of integral (forces, moments)
and distributed (pressure, velocities) characteristics. However, the former approach with only two
sliding interfaces shows somewhat lower levels of solution residuals and lower oscillations in the
overall pattern of force convergence. It is also better suited for meshing the cases with more complex
configurations of the duct interior surface.
     The computational grid is generated in STAR-CCM+ using polyhedral cells in the rotating mesh
block and hexahedral trimmed cells in the stationary mesh block. The boundary layer mesh consists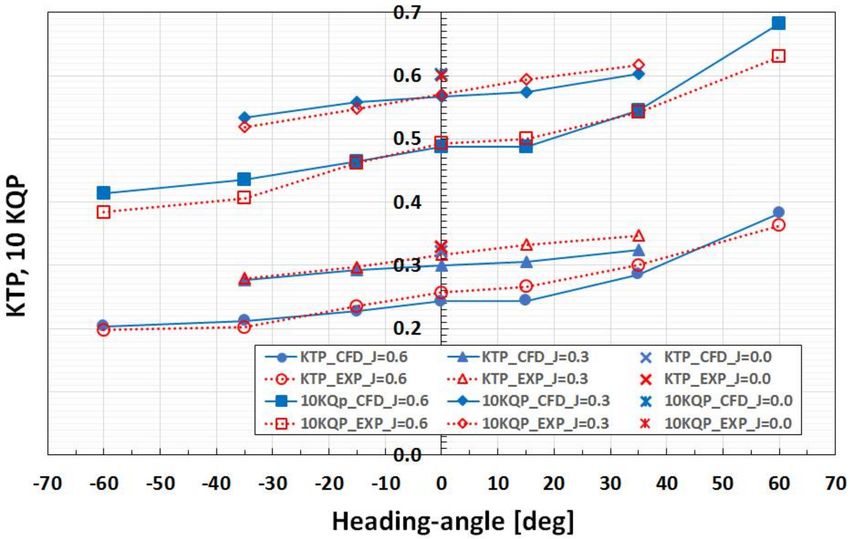
J. Mar. Sci. Eng. 2018, 6, 37 6 of 24
of 10 prismatic layers applied on all solid surfaces, except the extended part of the strut, which is
protruded to the upper boundary of computation domain. The values of the stretching factor and
total thickness of the boundary layer have been set in order to achieve the target range of wall Y+
from 0 to 5 in model scale calculations, and at the same time, to ensure sufficiently smooth transition
from the boundary layer mesh to the core mesh. The inlet and outlet boundaries of the computation
domain are placed at 22 propeller diameters from the propeller center by applying prismatic extrusion
upstream and downstream from the core mesh, while the upper, bottom and side boundaries are
placed at 10 Dp. The mesh refinement is regulated by means of curve, surface and volume controls.
The most important areas for mesh refinement include the domain around the propulsor, leading and
trailing edges of the propeller blades, duct and strut, junction between the strut and gondola of the pod
housing, gap between the pod gondola and propeller hub, blade tip clearance, and wake downstream
of the pod housing. The gap between the rotating propeller hub and stationary gondola of the pod
housing is modelled explicitly, with about 25 cells placed across the gap. A similar number of cells
is accommodated in the clearance between the blade tip and duct inner surface. In the simulations
involving free surface, additional refinement is applied in a vertical direction at the level of free surface
everywhere in the domain, and in all three directions above the propulsor, where deformations of free
surface and, eventually, ventilation are expected. Some details of surface mesh on propeller and duct
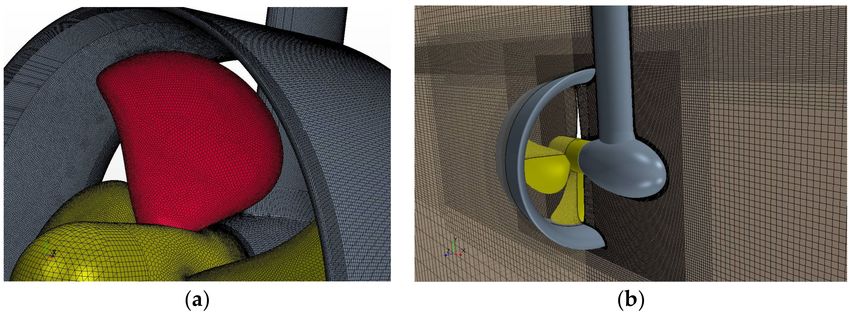
and volume mesh around the propulsor and free surface can be seen in Figure 4. The total cell count in
the computation mesh is about 21.5 million cells, of which about 4 million cells are in the propeller
region. The applied meshing approach is based on best practices elaborated by the authors in their
earlier studies regarding the CFD simulations of ducted propellers [7,19] and pod propulsors [20,21].
Figure 4. Details of computation mesh: (a) surface mesh on propeller and duct; (b) volume mesh
around propulsor and free surface.
4. Propulsor Operation in Oblique Flow Conditions
All the simulations discussed below have been run in two stages. At the first stage, a converged
steady-state solution was attained using the Moving Reference Frame (MRF) method applied in the
propeller region. At the second stage, the implicit unsteady solution has been activated from the
solution of the first stage, and the case has been run for 40 complete propeller revolutions, with the
time-step corresponding to 1 degree of propeller rotation. For comparison with the measurements,
the computed forces and moments are expressed as non-dimensional coefficients by dividing them by
($ × n2 × D4 ) and ($ × n2 × D5 ), respectively. When post-processing the simulation results, the force
and moment coefficients are time-averaged over the last 20 propeller revolutions.
4.1. Integral Forces and Moments on the Propulsor
The computed and measured propeller thrust, KTP, propeller torque, KQP, duct thrust, KTD,
and total unit thrust force, KTTOT, are compared in Figures 5 and 6. The numerical simulations
reproduce fairly well the variation of propeller thrust and torque with heading angle, for all loading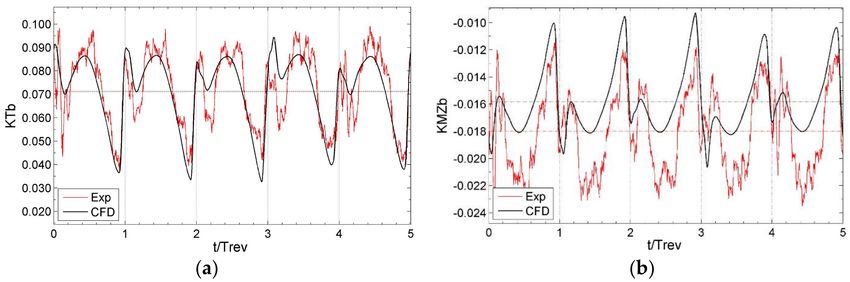
J. Mar. Sci. Eng. 2018, 6, 37                                                                         7 of 24

conditions. The propeller torque is predicted somewhat better than thrust in most cases. At heavier
loading (J = 0.3), KQP is in a very good agreement with the measurements for the whole range of
heading angles. At J = 0.6, the computed KQP values are also close to the measured data except the
largest heading angles of ±60◦ , where KQP is over-predicted. The latter scenarios are associated with
massively separated flow over the pod and duct, and therefore they represent considerable challenges
for numerical simulations. The numerical predictions of duct thrust, KTD, and total unit thrust, KTTOT,
are found to be in good agreement with the measurements in the whole range of studied conditions.

      Figure 5. Measured (red) and computed (blue) propeller thrust, KTP, and propeller torque, KQP, at
      different heading angles and loading conditions.

      Figure 6. Measured (red) and computed (blue) duct thrust, KTD, and total unit thrust, KTTOT, at
      different heading angles and loading conditions.

      Regarding the prediction of KTP, at least two important phenomena are believed to play a role:
(1) effect of the gap between the rotating hub and stationary pod; and (2) pattern of the flow over the
duct. In order to address the first effect, additional CFD calculations have been performed in straight
flow for different loadings and at two propeller pitch ratios, P/D. The simulations predict lower pod
resistance and lower KTP, compared to the measurements, while the computed total thrust, KTTOT,
and propeller torque, KQP, are predicted close to the measured data, as it can be concluded from
Figures 7 and 8, similar to the observations from Figures 5 and 6.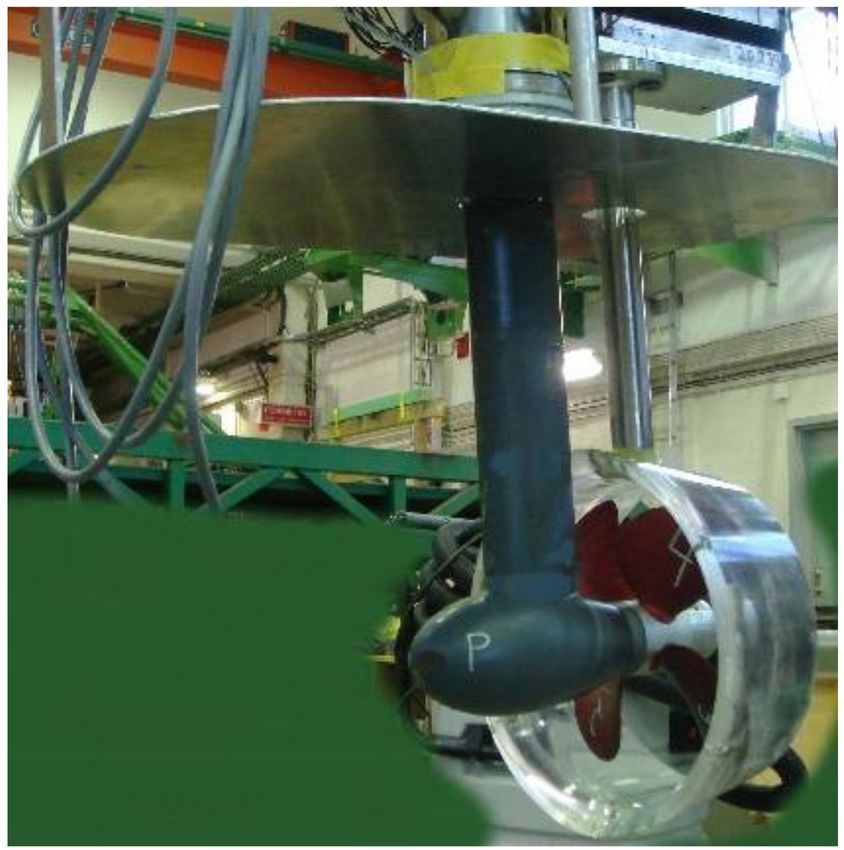
J. Mar. Sci. Eng. 2018, 6, 37                                                                          8 of 24

     While, as mentioned above, in the CFD model the gap width is included in exact accordance
with the test setup, the details of shafting, bearings and seals are not modelled. Furthermore, there
are also uncertainties associated with the pressure levels in the gap during model tests and their
effect on the measured propeller thrust KTP. At the same time, one needs to point out that without
including the hub/pod gap in the numerical model, one cannot achieve a realistic prediction of pod
resistance and hub contribution to propeller thrust, due to the uncertainties associated with pressure
integration over the sides of the pod and hub facing the gap. In general, the influence of gap flow on the
results of CFD/EFD comparisons is relatively higher for podded propellers than for conventional shaft
propellers, either ducted or open. The “gap effect” is more pronounced for conical hub configurations
compared to cylindrical hub configurations, and it is also found dependent on the location of the gap
with respect to the cone, as well as on propeller operation mode with respect to the pod housing,
or dynamometer shaft, i.e., pulling more or pushing mode. For example, when using the numerical
model similar to the one employed in the present study, the predictions of propeller thrust for shaft
propellers featuring cylindrical hubs was found to be in close agreement with the measurements done
on ducted propellers [7] and on open propellers [21]. It is worth noting that the same propeller P1374
as used in the present study was also used in the referred papers.

      Figure 7. Measured (red) and computed (blue—fully turbulent model, green—transition model)
      propeller thrust, KTP, at the two propeller pitch settings, P/D, and different loading conditions.

      Figure 8. Measured (red) and computed (blue—fully turbulent model, green—transition model)
      propeller torque, KQP, at the two propeller pitch settings, P/D, and different loading conditions.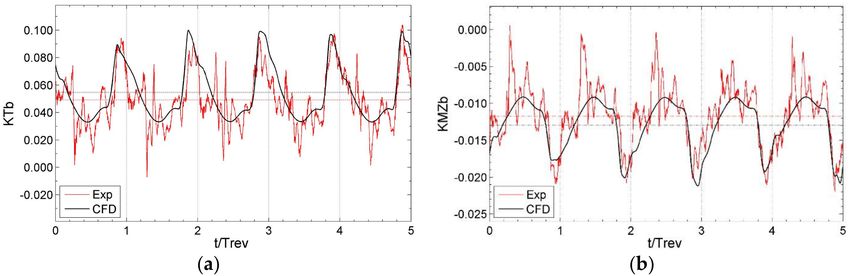
J. Mar. Sci. Eng. 2018, 6, 37                                                                       9 of 24

      The second phenomenon is attributed to the flow over the duct at low Re numbers in model
scale, and it is closely related to flow regime transition on the outer side of the duct. Unlike
the phenomenon of gap effect, it is mostly evident in light loading conditions. An estimation of
characteristic Reynolds number ReD for the duct flow at J = 0.6, where the aforementioned flow
transition effect becomes appreciable, results in the following figures: ReD = 1.8 × 10⁵ for the outer
duct surface, and ReD = 3.0 × 10⁵ for the outer duct surface. Flow transition affects the extent of flow
separation on the duct, and also the flow pattern over the duct trailing edge. It is mainly the trailing
edge flow that influences the flow velocity through the duct and results in changes in propeller thrust
and torque. In most cases, for conventional shaft ducted propellers, it has been observed that transition
leads to a somewhat larger expansion rates of propeller slipstream, and hence lower velocity through
the propeller compared to fully turbulent flow conditions [7]. It leads to an increase of propeller thrust
and torque as observed in Figures 7 and 8, where the results of calculation using the transition model
show higher values of KTP and KQP at high advance coefficients. At lower advance coefficients (J < 0.6),
in straight flow, propeller torque is very well predicted, while at higher advance coefficients (J > 0.6),
KQP is under-predicted, as it can be seen from Figure 8. Since propeller torque is not influenced by the
gap flow effect, one can conclude that in the range of loading conditions J ≤ 0.6, the influence of flow
transition is minor, and the main reason for the differences in KTP should probably be attributed to
uncertainties associated with the gap flow in both the physical and numerical models. In oblique flow,
the flow around the gap is no longer axisymmetric, and consequently, the contributions of gap walls to
pod resistance and propeller thrust change. In such cases, the gap flow is also strongly influenced by
the configurations of hub and pod in the vicinity of the gap, as well as by the vortices shed from the
pod housing. Therefore, in the case of oblique flow, even small differences in flow pattern between the
simulations and tests may result in large differences in contributions to thrust from the gap walls.
      Figure 5 shows that propeller thrust and torque increase with the increase in positive heading
angle, while they decrease with the increase in negative heading angle, in comparison with their
values at zero heading. This asymmetry of forces with respect to zero heading is a characteristic
feature of pushing podded units, and it is mainly associated with the interaction between the rotating
propeller and cross-flow in the separated wake behind the strut. This phenomenon has been discussed
in detail in [9]. For ducted pushing propulsors, the force asymmetry is smaller than for open pushing
propulsors, due to the flow-straightening effect of the duct. Furthermore, as it can be observed
from Figure 5, the asymmetric influence of cross-flow altered by the strut wake on KTP is larger for
lighter loadings.
      As mentioned above, the numerical predictions of duct thrust, KTD, and total unit thrust, KTTOT,
compare well with the measurements in the whole studied range. As one can see from Figure 6, KTD
exhibits nearly symmetric behavior with respect to zero heading angle, for the heading angles within
±35◦ , since the duct experiences very similar conditions in terms of inflow. At larger heading angles,
some asymmetry is introduced in the distribution of KTD by the differences in propeller loading at
positive and negative heading angles, as discussed above.
      The comparisons of the measured and computed side forces acting on the duct, KSD, and on the
whole unit, KSTOT, are presented in Figures 9 and 10, for the loading conditions of J = 0.6 and J = 0.3,
respectively. Figure 10 also includes the results obtained for bollard condition, J = 0.0.
      The major contribution to the total side force, KSTOT, is given by the duct at all heading angles,
and as the heading angle increases, the contributions by the pod and propeller are added. It has to
be noted that due to the flow straightening effect of the duct on propeller flow, the contribution by
the propeller to the total side force is much smaller than it is in the case of open pushing thrusters.
The duct straightens both the oblique inflow onto the propeller and the slipstream downstream of the
propeller. These two effects result in a reduction of propeller side force.
      The numerical simulations appear to under-predict the total side force for all tested conditions.
This is obviously due to the under-prediction of the duct side force, KSD. It has been found from
earlier studies in the cases where flow separation develops on the duct in straight flow, that a fully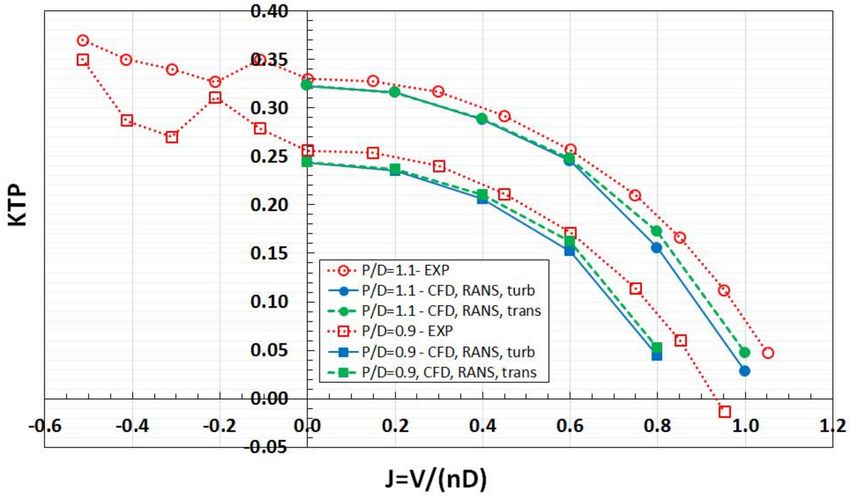
J. Mar. Sci. Eng. 2018, 6, 37                                                                            10 of 24

turbulent calculation, especially with the SST k-ω model in use, results in a greater separation extent
than obtained from the calculations using the transition model [7,19]. Under the conditions of oblique
flow, flow separation on the duct leeward side becomes massive, which puts even heavier demands on
the turbulence closure. The use of a transition model does not remedy the situation in these cases.

      Figure 9. Measured (red) and computed (blue) duct side force, KSD, and total unit side force, KSTOT,
      at different heading angles and loading condition of J = 0.6.

      Figure 10. Measured (red) and computed (blue) duct side force, KSD, and total unit side force, KSTOT,
      at different heading angles and loading conditions of J = 0.3 and J = 0.0.

     The comparison between the measurements and calculations in terms of the steering moment,
KMY, have been done for the moment quantity, excluding the duct contribution, since only this
quantity is measured in the tests. This comparison is presented in Figure 11, while the computed
distributions of the steering moment acting on the duct, KMYD, are shown in Figure 12. As one can
see from Figure 11, quite large deviations are observed between the measurements and calculations,
particularly at a high advance coefficient of J = 0.6, and at large heading angles. However, the overall
variation of the steering moment with the loading and heading angle appears qualitatively well
reproduced by the CFD simulations, in particular at lower J = 0.3. The quantitative agreement with the
measurements is more difficult to achieve, since the values of KMY are small, because KMY is the result
of opposing contributions from the propeller, KMYP, and from the pod, KMYG. At higher speeds,
the experimental data also appear affected by considerable scattering. At zero heading angle, KMY is
entirely determined by the contribution from the propeller. Minor difference in the location of resulting
force centers on the pod and propeller may lead to considerable difference in the contributions from
respective forces to KMY due to the force arm.
J. Mar. Sci. Eng. 2018, 6, 37 11 of 24
Figure 11. Measured (red) and computed (blue) steering moment, KMY, excluding duct contribution,
at different heading angles and loading conditions.
Figure 12. Computed steering moment on the duct, KMYD, at different heading angles and
loading conditions.
Both the side force on the propeller, KSP, and side force on the pod, KSG, act in the direction
of cross-flow caused by the heading angle. At zero heading, the propeller develops a small side
force acting in the direction of portside (for the right-handed propeller studied herewith) due to its
interaction with the wake of the pod housing. This small side force causes a deviation of the total
reaction force, resulting in a non-zero positive steering moment acting on the unit. The moment KMY
is larger at lower J values, where propeller loading is heavier. This is an important phenomenon that
has direct impact on course-keeping characteristics of vessels equipped with pushing and dual-end
pod propulsors.
At heading angles, the major contribution to the total steering moment is given by the duct.
It can be observed from Figure 12 that, for the same heading angle, the steering moment on the duct
(KMYD) may have different signs, depending on loading condition. More specifically, for the positive
heading angle of +35 degrees, at J = 0.6 the moment KMYD is positive, i.e., it tends to turn the rear
part of the unit in the direction of cross-flow (opposite clockwise), whereas at J = 0.3 this moment acts
in the opposite direction. This result is explained by the differences in the contributions to KMYD
originating from the duct thrust and duct side force at different loading conditions. The side force
developed on the duct tends to turn the rear part of the unit in the direction of cross-flow, similar to
the side force on the propeller. The force center of the duct reaction in oblique flow is however not
located at the propeller shaft but is shifted towards the windward side of the duct (side facing theJ. Mar. Sci. Eng. 2018, 6, 37 12 of 24
cross-flow), and thus the duct thrust tends to turn the rear part of the unit in the direction opposite to
cross-flow. At lighter loading conditions (J = 0.6), the duct side force gives a greater contribution to
KMYD. At heavier loading conditions (J = 0.3), it is on the contrary the duct thrust that gives a greater
contribution to KMYD, which explains the differences in sign of this quantity observed in the results.
As the heading angle increases, a massive flow separation develops on the duct at higher speeds
(J = 0.6). It slows down the growth of duct side force with heading angle, while duct thrust continues
to increase with approximately the same gradient as at lower heading angles.
Thus, the ratio KSD/KTD is reduced, and due to the redistribution of pressure on the duct,
the arm of the KSD contribution is reduced as well. These changes result in a rapid decrease in the
steering moment produced by the duct as seen at the heading angles of ±60 degrees. Further, at these
heading angles, flow separation on the pod housing develops to such extent that it affects the inflow
on the duct.
Separately, a frequency analysis has been performed on the computed time histories of propulsor
forces and moments, using the Fast Fourier Transform (FFT). This analysis captured, in addition to the
propeller blade frequency of 44 Hz, a lower frequency peak in the range of 3.9 to 4.2 Hz, as shown in
Figure 13 for duct thrust. This low frequency peak is found to be related to the vortex shedding process
that accompanies flow separation on the leeward side of the duct. Because of the interaction, the low
frequency peaks in the same range are also observed for the loads on other propulsor components.
The examples of flow patterns around the propulsor at large heading angles are shown in Figure 14.
This figure shows flow streamlines coloured by the magnitude of dimensionless axial flow velocity
in the horizontal plane located approximately at 0.4 Rp, for the top vertical position of the propeller
blade (Rp being the propeller radius).
Figure 13. Power spectral density of duct thrust, KTD, at J = 0.6, for the positive and negative heading
angles of 35 degrees.
Figure 14. Examples of flow pattern around propulsor at large heading angles, J = 0.6: (a) −35 degrees;
(b) −60 degrees. View from top.J. Mar. Sci. Eng. 2018, 6, 37 13 of 24
4.2. Single Blade Loads
The computed and measured loads on a single blade defined in the local blade coordinate system
with the origin at the blade root are compared in Tables 4 and 5 in terms of the time-averaged values
and their standard deviations, for the advance coefficients J = 0.6 and J = 0.3, respectively. The standard
deviations, σ, are expressed as a percentage of the time-averaged values. Similar to the integral
propulsor loads, the blade loads are given as dimensionless force and moment coefficients, for blade
thrust, KTb, blade torque, KQb, blade spindle moment, KMYb, and blade bending moment, KMZb.
The numerical predictions compare quite well with the experimental data, especially in terms of blade
thrust, KTb, and blade bending moment, KMZb. The values of spindle moment, KMYb, are very
small and, therefore, sensitive to small variations. The computed fluctuations of blade loads are
close to the measured values and, as expected, they increase as the magnitude of the heading angle
increases due to the propeller being subject to increasingly more intensive flow separation from the
pod housing. The examples of computed time histories of blade thrust and bending moment from
5 complete propeller revolutions at J = 0.6 are shown in Figures 15 and 16 for the two heading angles
of +35◦ and −35◦ , respectively. The measured values are also plotted for comparison.
Figure 15. Measured and computed time histories of blade loads at J = 0.6 for the heading angle +35◦ :
(a) blade thrust, KTb; (b) blade bending moment, KMZb.
Figure 16. Measured and computed time histories of blade loads at J = 0.6 for the heading angle −35◦ :
(a) blade thrust, KTb; (b) blade bending moment, KMZb.
The horizontal lines represent the time-averaged values and the vertical lines represent the
12 o’clock positions of the reference blade. A good agreement is observed between the calculations
and measurements, particularly for KTb, in terms of the amplitudes of maximum blade loads and
corresponding angular positions of the blade. Similar observations are made for all the other tested
conditions. The experimental patterns exhibit higher frequency oscillations which are not evident
in the CFD results. These oscillations are presumably related to the inherent measurement “noise”,
and also to the presence in the flow of intermittent vortex structures, which originate from the flow
separation on propulsor components, and whose scale is beyond the resolution capabilities of theJ. Mar. Sci. Eng. 2018, 6, 37 14 of 24
RANS method. Figure 17 illustrates the computed contours of the axial velocity together with the
tangential velocity vectors on a control plane upstream of the propeller for the positive and negative
heading angles of 35◦ .
Figure 17. Computed velocity fields on the control plane upstream of the propeller at J = 0.6 for positive
and negative heading angles: (a) +35 degrees; (b) −35 degrees. View from downstream.
Table 4. Measured and computed single blade loads at J = 0.6 for different heading angles.
−35◦ −15◦ 0◦ 15◦ 35◦
Quantity CFD EXP CFD EXP CFD EXP CFD EXP CFD EXP
KTb 0.055 0.049 0.058 0.056 0.062 0.059 0.061 0.063 0.071 0.071
σ (KTb) % 36.4 38.9 16.8 17.5 5.8 6.3 11.6 13.1 22.1 22.0
10 KQb 0.071 0.086 0.075 0.089 0.079 0.098 0.078 0.095 0.087 0.087
σ (KQb) % 24.8 23.5 12.3 12.1 4.2 4.8 8.0 8.5 15.1 19.0
10 KMYb 0.021 0.016 0.021 0.015 0.019 0.008 0.020 0.011 0.016 0.012
σ (KMYb) % 126.3 194.4 51.2 95.7 20.6 64.9 53.6 100.1 157.6 247.0
10 KMZb −0.130 −0.117 −0.136 −0.152 −0.143 −0.171 −0.140 −0.170 −0.158 −0.180
σ (KMZb) % 26.5 35.4 13.4 15.6 4.6 4.6 8.5 10.0 15.7 17.5
Table 5. Measured and computed single blade loads at J = 0.3 for different heading angles.
−35◦ −15◦ 0◦ 15◦ 35◦
Quantity CFD EXP CFD EXP CFD EXP CFD EXP CFD EXP
KTb 0.071 0.070 0.074 0.075 0.076 0.071 0.077 0.078 0.081 0.079
σ (KTb) % 11.9 12.0 7.1 8.0 4.0 4.7 5.3 5.6 8.1 10.8
10 KQb 0.087 0.099 0.091 0.096 0.092 0.112 0.093 0.108 0.097 0.101
σ (KQb) % 8.3 9.8 5.4 6.9 3.0 3.6 3.7 4.9 5.3 9.3
10 KMYb 0.014 0.008 0.012 0.001 0.012 −0.006 0.011 −0.004 0.010 0.000
σ (KMYb) % 80.8 165.2 52.1 689.6 29.2 48.4 52.4 106.2 105.9 3776.1
10 KMZb −0.167 −0.176 −0.173 −0.198 −0.175 −0.205 −0.177 −0.206 −0.185 −0.222
σ (KMZb) % 8.6 9.5 5.8 6.4 3.4 3.5 4.1 5.3 5.8 8.4
At the positive heading angle, the blade of a right-handed pushing propeller would experience
the heaviest loads at the 6 o’clock position, where it encounters the cross-flow induced by the inflow.
Around the 12 o’clock position, the same cross-flow would result in a decrease in blade loads, but the
separated wake from the strut produces velocities opposite to the cross-flow, which increases the
blade loading. Accordingly, the two peaks are observed in the time histories of blade loads at positive
heading, as seen from Figure 15.
At the negative heading angle, the heaviest blade loads due to cross-flow are observed around
the 12 o’clock position, where they appear reduced by wake induced velocities whose direction is
opposite to the cross-flow. One peak is observed in the time histories of blade loads, around this
location. In addition to the above, there is also the influence of flow retardation in the pod wake, whichJ. Mar. Sci. Eng. 2018, 6, 37 15 of 24
results in the local increase of blade loading when it enters the wake area. However, the effect of flow
retardation is comparable at positive and negative headings. Thus, it can be concluded that the major
contribution to the unsteadiness of blade loads is related to the interaction of the propeller with the
separated wake from the pod housing. The degree of unsteadiness of blade loads increases with the
increase of heading angles, as the separation becomes more intensive. As one can see from Figure 14,
at the heading angle of 60◦ , separation on the pod also affects the inflow on the duct.
5. Propulsor Operation in the Presence of Free Surface
Under certain conditions, such as, for example, those of vessels in ballast, propulsor may operate
close to the free surface. The said conditions pose an increased risk of ventilation and, consequently,
loss of thrust. The main objective of the present study is to determine critical propulsor submergence
under different loading conditions, where ventilation occurs, and to quantify associated thrust losses.
Further analyses are carried out to assess the impact of ventilation on the magnitude of single blade
loads oscillations and to gain additional insight into the ventilation inception mechanisms. Similar to
the studies in oblique flow, the operation conditions corresponding to free sailing (J = 0.6), trawling
(J = 0.2) and bollard (J = 0.0) are selected for investigation. Only the numerical results are presented in
this section. As mentioned above, the numerical simulations are performed without inclusion of the
cavitation model to separate the pure effects of free surface and ventilation.
5.1. Implications of Numerical Simulation in Multiphase Flow
When conducting numerical simulations of the propulsor in the presence of free surface according
to the VOF method, one needs, apart from the obvious considerations regarding the mesh refinement,
to pay attention to the selection of time-step and simulation time. The time step is decided by the
propeller rate of revolution, and it is usually sufficiently small to resolve the required flow features.
However, it has been noticed that, at early runtime instances, the air is sucked from the air-water
interface toward the propulsor even for deep submergences, thus resulting in non-physical ventilation
events. Only after a sufficiently large number of propeller revolutions does the propeller become free
of the air fraction, and a converged solution for free surface is attained. Figure 18 shows the contours
of volume fraction around the propeller at different solution time instances for the submergence of
H/Dp = 1, J = 0.6. Only after about 20 revolutions, no air fraction and no significant changes in the
flow pattern around the free surface and propulsor are observed. Therefore, the first 20 propeller
revolutions should not be included in the analysis of simulation results.
Figure 18. Contours of volume fraction at different solution time instances for propulsor submergence
H/Dp = 1.0, at J = 0.6.J. Mar. Sci. Eng. 2018, 6, 37 16 of 24
5.2. Propulsor Ventilation at Free Sailing Conditions
The variations in propeller thrust, propeller torque and duct thrust with the magnitude of
submergence are illustrated in Figures 19 and 20, respectively. The time-averaged values of these
quantities are related to KTP0 , KQP0 and KTD0 , which refer to the corresponding values obtained from
the solution without the influence of free surface at J = 0.6. Both the propeller thrust and torque remain
almost unchanged until H/Dp = 1.3, and then they decrease gradually as the propulsor gets closer to
the water surface. The reduction in loading becomes appreciable at H/Dp = 0.8, where both the KTP
and KQP are reduced to about 3% of their values in unbounded flow. Under the above conditions,
and until H/Dp = 0.7, the propulsor is still free of ventilation.
Figure 19. Variations in propeller thrust, KTP, and propeller torque, KQP, with propulsor submergence,
H/Dp, at J = 0.6. (KTP0 , KQP0 refer to the corresponding values in unbounded flow).
Figure 20. Variations in duct thrust, KTD, with propulsor submergence, H/Dp, at J = 0.6. (KTD0 refers
to the corresponding value in unbounded flow).
At lower submergences, a more rapid decrease in KTP and KQP is observed, and after H/Dp = 0.6
these quantities drop for 6%, while the duct thrust drops almost instantly by 36%, from the respective
values in unbounded flow. This magnitude of submergence corresponds to a rapid onset of a fully
ventilated condition, in the form of a pocket-like deformation of the free surface above the propulsor.
At the lowest studied submergence (H/Dp = 0.5), the propeller thrust appears reduced by 12%, while
the duct thrust is reduced by 70%. The process of ventilation inception with the decrease in propulsor
submergence at the loading condition of J = 0.6 is illustrated in Figure 21.J. Mar. Sci. Eng. 2018, 6, 37 17 of 24
Figure 21. Ventilation inception with decrease in propulsor submergence, H/Dp, at J = 0.6.
Under the conditions of developed ventilation (H/Dp ≤ 0.6), the upper part of the duct is exposed
to air, which causes a very large loss of duct thrust. However, under light propeller loading, there is no
significant air entrainment by propeller blades on the duct interior side, so that the air fraction remains
limited to the upper part of the propeller disk area. This phenomenon can be seen more clearly from
the images presented in Figure 22. Thus, propeller forces experience more gradual and less significant
decrease than the duct thrust.
Figure 22. Contours of volume fraction under fully ventilated conditions at the submergence values of
H/Dp = 0.6 and 0.5, J = 0.6.
The reduction of KTP, KQP and KTD observed with the decrease of submergence at non-ventilated
conditions is attributed to the changes in propeller inflow and flow over the duct. Flow analyses
indicate that the inflow on the propeller does not change until the submergence of H/Dp = 1.0, where
the changes firstly occur at the inner blade sections, close to the propeller hub. They become more
pronounced as submergence decreases. In addition, the vertical extent of flow retardation domain in
the wake behind the strut is reduced, resulting in higher velocities on the propeller. These changes are
the result of interaction between the propulsor and free surface, which causes redistribution of the
pressure field, primarily on the upper side of the duct and in the area of the strut wake.J. Mar. Sci. Eng. 2018, 6, 37 18 of 24
The influence of propulsor submergence on single blade loads is presented in Table 6. In non-
ventilated conditions, the averaged blade loads and their standard deviations from mean values
do not show considerable variation with submergence. Around the submergence magnitudes
H/Dp = 0.8 ÷ 0.7, where the propulsor is close to free surface, but still free of ventilation, the
load amplitudes are reduced slightly due to the damping effect of free surface. The onset of ventilation
is associated with a rapid increase in load oscillations, which is noticeable in Table 6 by the large values
of standard deviation. The discussed trends are also illustrated by the time histories of single blade
thrust, KTb, presented in Figure 23. The maxima of blade loads occur at the time instances just before
the blade enters the air domain in the upper part of the propeller disk. Once the blade enters the said
domain, the blade load drops instantly, causing a large load gradient.
Table 6. Computed single blade loads at J=0.6 for different magnitudes of propulsor submergence.
Quantity w/o FS H/Dp = 2 H/Dp = 1.5 H/Dp = 1 H/Dp = 0.8 H/Dp = 0.7 H/Dp = 0.6 H/Dp = 0.5
KTb 0.062 0.062 0.062 0.061 0.060 0.059 0.058 0.056
σ (KTb) % 5.8 5.5 5.7 5.4 4.5 3.6 15.0 35.4
10 KQb 0.079 0.078 0.079 0.078 0.077 0.076 0.073 0.067
σ (KQb) % 4.1 4.2 4.6 4.3 3.7 3.1 14.0 34.7
10 KMYb 0.020 0.020 0.020 0.021 0.021 0.022 0.011 0.000
σ (KMYb) % 19.8 20.2 19.9 19.6 17.5 14.5 85.5 3481.4
10 KMZb −0.143 −0.142 −0.143 −0.141 −0.139 −0.137 −0.130 −0.120
σ (KMZb) % 4.5 4.0 4.5 4.0 3.0 2.4 17.0 40.1
Figure 23. Computed time histories of single blade thrust, KTb, for different magnitudes of submergence,
H/Dp, at J = 0.6.
5.3. Propulsor Ventilation at Trawling and Bollard Conditions
Propulsor operation near the free surface at low speed, where propeller loading is heavy, shows
some distinct differences from the case of free sailing. The ventilation event occurs at deeper
submergence, and the ventilation inception mechanism is different from that in free sailing. As one
can see from Figure 24, under the trawling operation condition (J = 0.2), the presence of an air fraction
inside the duct is observed already at the submergence of H/Dp = 0.9, while at H/Dp = 0.8 a fully
ventilated condition is established. At the bollard condition (J = 0.0), ventilation inception is delayed
to slightly lower magnitudes of submergence, around H/Dp = 0.8, where it takes the form very similar
to the one observed for the trawling condition.
The ventilation inception mechanism at heavy loading conditions is associated with the formation
of a vortex, originating on the free surface and extending to the suction side of the propeller blade,
or at early instances, to the inner side of the duct, near the blade tip. Such a vortex, serving as airJ. Mar. Sci. Eng. 2018, 6, 37 19 of 24
transport way, may firstly develop on one side of the propulsor strut, as observed in the case of J = 0.2,
H/Dp = 0.9. In this case, the said vortex shows unstable behaviour, and it does not appear at all
propeller revolutions. At lower magnitudes of submergence, and at heavier loading of the propeller,
such as at bollard, the ventilation vortex develops on both sides of the strut, and it exists all the time
as a stable structure attached to the suction side of the propeller blade. Three-dimensional images of
ventilation vortices derived from the CFD simulations are presented in Figure 25, for the conditions
discussed above.
Figure 24. Ventilation inception with decrease in propulsor submergence, H/Dp, at J = 0.2.
Figure 25. Ventilation inception vortex at the conditions of heavy propulsor loading: (a) H/Dp = 0.9,
at J = 0.2 (trawling); (b) H/Dp = 0.8, at J = 0.0 (bollard).
The described mechanism of ventilation inception in the form of an air-transport vortex has
earlier been discussed in the literature addressing ventilation on heavily loaded propellers as well as
on tunnel thrusters. In particular, reference [18] presents images of ventilation on the same ducted
thruster as studied in the present work, showing a very similar picture of two vortices existing on
both sides of the strut, as shown in Figure 25b, at an instance during a heave cycle at bollard operation
(J = 0.0).
The influence of free surface and ventilation on the propeller thrust and duct thrust is illustrated
in Figures 26 and 27, respectively. As above, the presented thrust values are related to KTP0 and KTD0 ,
which refer to the corresponding values obtained from the solution in unbounded flow.
In non-ventilated conditions and at early stages of ventilation inception, the effect of submergence
on propeller thrust and duct thrust is more pronounced at J = 0.2 than at J = 0.0, which one can see
for example, from a greater reduction of KTP and KTD at H/Dp = 0.8. However, once ventilation has
developed, the loss of thrust takes place more rapidly at the bollard condition, J = 0.0. More precisely,
at J = 0.2, H/Dp = 0.8, KTP drops by about 4%, while KTD drops by about 34% of the respectiveJ. Mar. Sci. Eng. 2018, 6, 37 20 of 24
values in unbounded flow. At J = 0.0, and the same submergence, KTP drops by about 2%, while KTD
drops by about 3% of the respective values in unbounded flow. At the submergence H/Dp = 0.7 (fully
ventilated condition at both loadings), KTP is reduced by17% at J = 0.2, and by20% at J = 0.0, and KTD
is reduced by 55% at both advance coefficients. The trends in propeller torque are similar to those of
propeller thrust.
Figure 26. Variations in propeller thrust, KTP, with propulsor submergence, H/Dp, at J = 0.2 and J = 0.0.
(KTP0 refers to the corresponding value in unbounded flow).
Figure 27. Variations in propeller thrust, KTD, with propulsor submergence, H/Dp, at J = 0.2 and
J = 0.0. (KTD0 refers to the corresponding value in unbounded flow).
Unlike the case of free sailing, at low speed operation during the ventilation event there observed
a significant air entrainment by propeller blades along the inner side of the duct, toward the bottom
part of propeller disk, as illustrated in Figure 28. A greater percentage reduction of propeller forces
registered at low speed operation condition is, to a large degree, related to the aforementioned air
entrainment phenomenon.
The influence of propulsor submergence on single blade loads is presented in Table 7, for the
trawling condition, J = 0.2. Similar to the observations made in the case of free sailing, in non-ventilated
conditions the influence of free surface on blade loads is very small. From H/Dp = 0.8, where
ventilation inception begins in the form of a vortex, one can notice an increase in load amplitudes
(higher values of standard deviation), and a reduction in the averaged values. In fully ventilated
conditions (H/Dp = 0.7), the load amplitudes increase further, while the averaged loads continue
decreasing, except for the blade spindle moment, KMYb. The noticed trend in KMYb, which is differentJ. Mar. Sci. Eng. 2018, 6, 37 21 of 24
from the trends of other blade loads, and also from the trends in KMYb in free sailing, is explained
by the effect of air entrainment by propeller blades, which results in redistribution of pressure on
the blade. Spindle moment is the quantity that is very sensitive to changes in pressure distribution,
especially in the vicinity of blade edges.
Figure 28. Contours of volume fraction under fully ventilated conditions at low speed operation
conditions: (a) J = 0.2, H/Dp = 0.8; (b) J = 0.0, H/Dp = 0.7.
Table 7. Computed single blade loads at J = 0.2 for different magnitudes of propulsor submergence.
Quantity w/o FS H/Dp = 1.5 H/Dp = 1 H/Dp = 0.9 H/Dp = 0.8 H/Dp = 0.7
KTb 0.079 0.077 0.078 0.078 0.077 0.069
σ (KTb) % 3.6 3.3 3.6 3.7 11.3 26.7
10KQb 0.096 0.093 0.095 0.094 0.090 0.077
σ (KQb) % 2.8 2.7 3.0 3.1 11.2 28.3
10KMYb 0.011 0.012 0.012 0.012 -0.005 0.025
σ (KMYb) % 25.7 24.9 26.8 30.2 203.2 52.2
10KMZb −0.183 −0.179 −0.181 −0.181 −0.170 −0.143
σ (KMZb) % 3.3 2.6 3.0 3.0 13.9 33.9
The computed time histories of single blade thrust, KTb, are presented for different magnitudes
of submergence at the trawling condition (J = 0.2) in Figure 29. The occurrence of high-frequency
oscillations of KTb observed at H/Dp = 0.8 is associated with ventilation inception in the form of an
unstable free surface vortex. At H/Dp = 0.7, where ventilation is fully developed, the oscillations of
KTb increase significantly, and the periodic pattern of time history is destroyed.
Figure 29. Computed time histories of single blade thrust, KTb, for different magnitudes of submergence,
H/Dp, at J = 0.2.J. Mar. Sci. Eng. 2018, 6, 37 22 of 24
6. Conclusions
A detailed verification and validation study is prerequisite for numerical simulation of complex
flow phenomena associated with dynamic loads on azimuth propulsors. The results of the present
work show that a good agreement can be achieved between the CFD calculations by an unsteady
RANS method and experimental data for a ducted pushing thruster operating in straight flow and
oblique flow, in the range of relevant loading conditions in the first quadrant. The above conclusion
stands for both the integral forces and moments on the unit and individual blade loads, including their
amplitudes and time histories, with the exception of steering moment, where larger differences are
found. The steering moment, as a quantity of smaller order of magnitude compared to other loads on
the thruster, is very sensitive to small differences in flow pattern, resulting in changes in the locations
of the force centers, and hence force arms.
The forces and moments on the ducted azimuth thruster reveal asymmetry with respect to positive
and negative heading angles, which is typical for pushing pod units. The said asymmetry is associated
with the interaction between the rotating propeller and cross-flow in separated wake behind the strut.
Due to the flow straightening effect of the duct, the said asymmetry of loads acting on the ducted unit
is found to be smaller compared to the case of an open pushing thruster. For a unit with a right-handed
propeller, the loads are smaller at negative heading angles, where the oblique flow on the propulsor is
from starboard. At the same time, both the calculation results and experimental measurements show
that, at negative headings, the amplitudes of single blade loads are larger than at positive headings,
except the blade spindle moment, which shows an opposite trend.
The mentioned flow straightening effect of the duct results in relatively small side forces produced
by the propeller, especially at small heading angles, where the main contributions to the side force and
steering moment are given by the duct.
At zero heading angle, the propeller develops a small side force acting in the direction of portside
(for a right-handed propeller) due to its interaction with the wake of the pod housing. This small
side force causes a deviation in the total reaction force and results in a non-zero steering moment
acting on the unit. The steering moment is larger at lower J values, where propeller loading is heavier.
This phenomenon has a direct impact on the course-keeping characteristics of vessels equipped with
pushing pod propulsors.
The frequency analysis of forces and moments acting on the propulsor at large heading angles
reveals, in addition to the blade frequency, the presence of a lower frequency peak, which is related to
the vortex shedding process that accompanies flow separation on the leeward side of the duct.
The presence of free surface causes important changes in the performance characteristics of the
ducted azimuth thruster. In free sailing, the influence of free surface becomes appreciable at the relative
submergence, H/Dp, around 0.8, where both the propeller thrust and duct thrust appear reduced
by about 3% from their respective values in unbounded flow, without the occurrence of ventilation.
The onset of fully ventilated conditions at H/Dp = 0.7 is associated with a 6% loss of propeller thrust
and 36% loss of duct thrust. Thrust losses continue increasing as submergence decreases. Under
the conditions of light propeller loading in free sailing, propulsor ventilation develops as a sudden
pocket-like deformation of the free surface above the propulsor. There is no air entrainment by
propeller blades, so that the air fraction remains limited to the upper part of the propeller disk.
The ventilation event begins at deeper submergence under the conditions of heavy loadings, such
as those of trawling and bollard operation. In the present study, ventilation inception is registered at
H/Dp = 0.9 for the trawling condition, and at H/Dp = 0.8 for the bollard condition. In fully ventilated
conditions, the propeller thrust loss amounts to 20%, and the duct thrust loss amounts to 55% from
their respective values in unbounded flow. In the case of heavy propulsor loading, the mechanism of
ventilation inception is associated with the formation of a vortex extending from the free surface to the
suction side of the propeller blade, or to the inner side of the duct near the blade tip. The occurrence of
the ventilation event is accompanied by air entrainment by the propeller blades on the duct interior
surface and a very large increase in unsteady blade loads.You can also read