Twitter Sentiment Analysis: A Case Study of Comparative Advertising in the Airline Industry - SAS
←
→
Page content transcription
If your browser does not render page correctly, please read the page content below
Paper 2897-2018
                       Twitter Sentiment Analysis: A Case Study of
                    Comparative Advertising in the Airline Industry
        Vinoth Kumar Raja, West Corporation; Padmashri Janarthanam, Mutual of Omaha

ABSTRACT
The aviation industry today is in oligopolistic conditions where major airlines control the market and create
entry barriers to low-cost domestic airlines and fast-growing rivals from other markets. This has led to
stifling competition between the two groups, and when controversies such as service failures surround
the oligopolies, competitors strike back by sharing comparative advertisements on social media platforms.
The posters act as a catalyst for already dissatisfied customers resulting in a more negative attitude
towards the mocked brand and indirectly building a substantial brand equity and loyalty for the
competitors. This paper focuses on overall sentiment surrounding three major controversial passenger
incidents in the airline industry from the year 2017 and how subsequent parody advertisements from
competitors helped the latter gain an advantage over the market leaders and boost their brand value. For
this case study, we extracted ~116,000 customer tweets from Twitter for thirteen airline brands during the
time of the controversies. Base SAS® procedures were used to prepare the extracted data, and SAS®
Enterprise Miner’s Text Miner nodes were used to discover customer sentiments, topics and term
relationships for different airlines during such unfortunate incidents.

INTRODUCTION
The Airline Deregulation Act signed in 1978 changed the aviation industry. The act dissolved the Civil
Aeronautics Board (CAB) that regulates airlines fares and resulted in carriers to innovate new business
models with low fares. Because of low fare models, tough competition prevailed between airliners which
led to losses and failures [1]. Consequently, airlines were consolidated into three to four large carriers
through mergers or acquisitions. With only a few major airlines dominating the industry, oligopolistic
conditions began to exist characterized by collusion, restrained competition and high entry barriers [2]
making it difficult for rivals to penetrate the already concentrated market and that drove the rivals to take
the route of comparative advertising.
Comparative advertising is a technique where an advertising message directly or indirectly names the
advertising company’s competitors (in this case, the few major airlines) and compares one or more of its
characteristics by showing why their competitor’s service is inferior [3]. The primary objective for the
airline brands here is to make their potential customers look upon its service as rather different from the
market leaders. The idea is to use advertising as a tool in lowering the elasticity of demand for the large
carriers. When this happens, consumers will regard the brand as being more desirable than the substitute
[4]. In order to make the advertising highly efficient, choosing the right platform to share the poster and
seizing the perfect opportunity to publish it is of paramount importance.
Social media sites such as Twitter have evolved to become a prominent platform for advertising and
marketing. It has also become one of the essential channels through which customers request and
receive customer service. According to a recent survey, 90% of the customers have used social media in
some way to communicate with a brand, and more than 1/3rd said they preferred social media to
traditional channels like phone and email [5]. Therefore airline brands share their parody advertisements
on Twitter to subvert their competitors’ value and gain customer sentiments.
Airline brands build and maintain a bond with customers by offering dependable service. A single misstep
such as service failure can be enough to keep their public relations departments scrambling as customers
strongly voice their negative sentiments in social media platforms. Competitors target the other airlines
with their adverts during such service failures and controversies to gain attention.
Figure 1 shows a simplified version of how competitors target the market leaders with their comparative
advertising.

                                                      1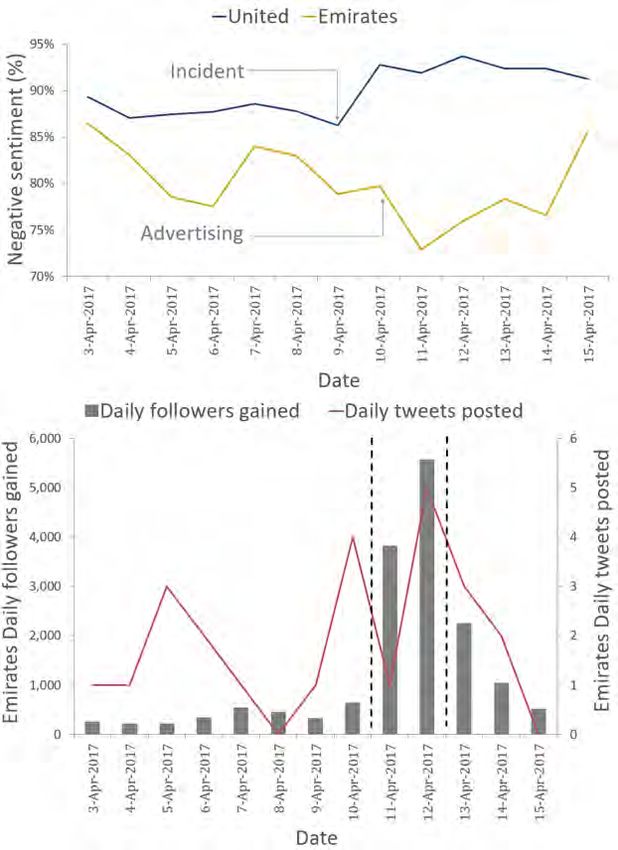
Figure 1. Comparative Advertising in Airline Industry
In the United States today, the four major airlines influencing the market are United Airlines, American
Airlines, Delta Air Lines and Southwest Airlines who fly about 80% of all domestic passengers [7]. Low-
cost domestic competitors such as Spirit Airlines and Frontier Airlines and fast-growing rivals from Middle
East markets such as Emirates Airlines, Qatar Airways, and Etihad Airlines are trying to gain market
share concentrated by these major four [8]. Similarly, the Indian market is dominated by IndiGo Airlines,
Air India and Jet Airways and new entrants like Spice Jet and Go Air are finding it difficult to enter the
domestic market [9].
In this paper, we discuss three major controversial passenger incidents of the year 2017 and how
successive advertisements from competitors helped them gain an advantage over the market leaders to
boost their brand value. The controversial cases analyzed in this study are as follows.
CASE 1: UNITED AIRLINES LEGGINGS INCIDENT
On March 26th, 2017, a gate agent for United Airlines denied entry to two girls onto a flight who were
wearing leggings (a close-fitting garment worn over the legs typically by women). The incident set off a
wave of online criticism with public calling the airline dress code policies as old-fashioned. Though United
Airlines issued a statement [10] stating the passengers were ‘pass-riders’ who had to follow specific dress
codes, women activists voiced that the leggings ban disproportionately affected women and girls.
CASE 2: UNITED AIRLINES PASSENGER REMOVAL INCIDENT
On April 9th, 2017, United Airlines Express flight 3411 from Chicago to Louisville was overbooked (more
tickets sold than actual available seats) and with no volunteers to deplane to accommodate four crew
members, the flight agent selected a passenger through an automated selection process. The chosen
passenger refused to disembark the flight and was forcibly removed [11] by law enforcement officers and
suffered injuries. The video footage of the forcible removal captured by other passengers was widely
shared on social media causing public outrage. Many including the US government criticized the way this
situation was handled by United Airlines.
CASE 3: INDIGO AIRLINES PASSENGER MANHANDLE INCIDENT
On October 15th, 2017, a ground crew associate of IndiGo Airlines (the largest airline in India) physically
assaulted a passenger at Delhi airport following an altercation. The video captured by another IndiGo
associate surfaced in social media on November 7th, 2017 and went viral. The incident received strong
condemnation from public, and the Directorate General of Civil Aviation of India issued a show-cause
notice to IndiGo airlines seeking explanation [12] on the episode.
Figure 2 shows a timeline of the three controversial incidents along with competitors’ advertisements.

                                                     2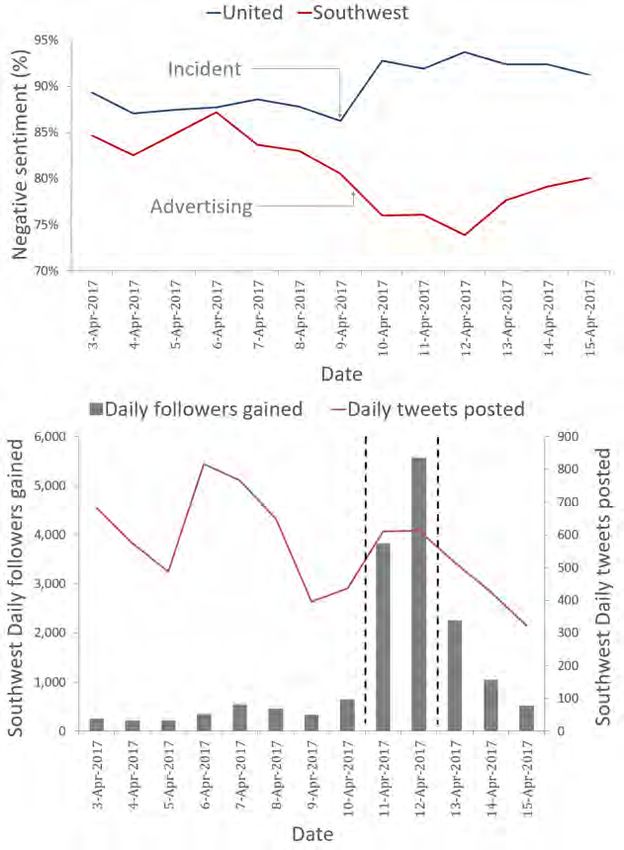
Mar 26: United Airlines Leggings Incident

                                                                                                                      Mar 27: Delta Air Lines ad
       Jan                                                                             Mar 28: Spirit Airlines ad

       Feb

       Mar
                                                                                          Apr 9: United Airlines Passenger Removal Incident

                                                                                                                    Apr 10: Royal Jordanian ad
       Apr

                                                                                 Apr 10: Southwest ad (fake)

       May                                      Apr 11: Emirates Airlines ad
                Apr 12: Qatar Airways ad

       Jun
2017

       Jul

       Aug

                                                                                       Nov 7: Indigo Airlines Passenger Manhandle Incident

                                                                                                                         Nov 7: JetAir ad (fake)
       Sep
                                                                                       Nov 8: JetAir stmt on fake ad
                                                               Nov 8: Air India ad 1

                                     Nov 8: Air India ad 2
       Oct

       Nov

       Dec

       Figure 2. Controversial Incidents and subsequent ads in the Airline Industry - 2017 Timeline

                                                                        3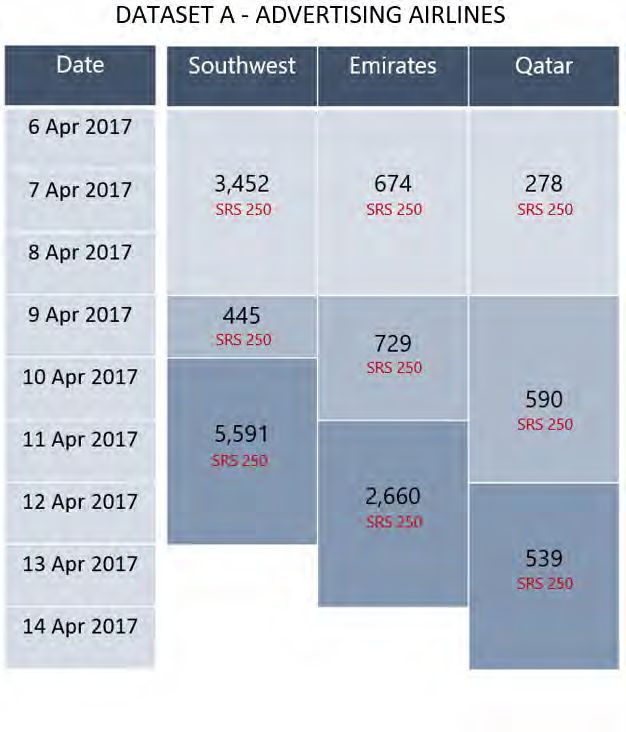
METHODOLOGY
For this study, we extracted customer tweets of thirteen airline brands over different time periods
surrounding the three controversial incidents from Twitter using Python. The first step was to import the
extracted csv files into SAS. With 151 csv files, it was impossible to import each file as a SAS dataset
manually, so SAS macro code was created to import all csv files from a specified directory. Once the files
were available in SAS format, three datasets (each specific to an airline incident) were merged and pre-
processed using SAS procedures. The pre-processed data was then analyzed using SAS Enterprise
Miner.

Figure 3. Framework for Sentiment Analysis
The metadata of the final SAS dataset imported from csv files is as shown below.

Table 1. Metadata of final SAS dataset used in the case study

                                                    4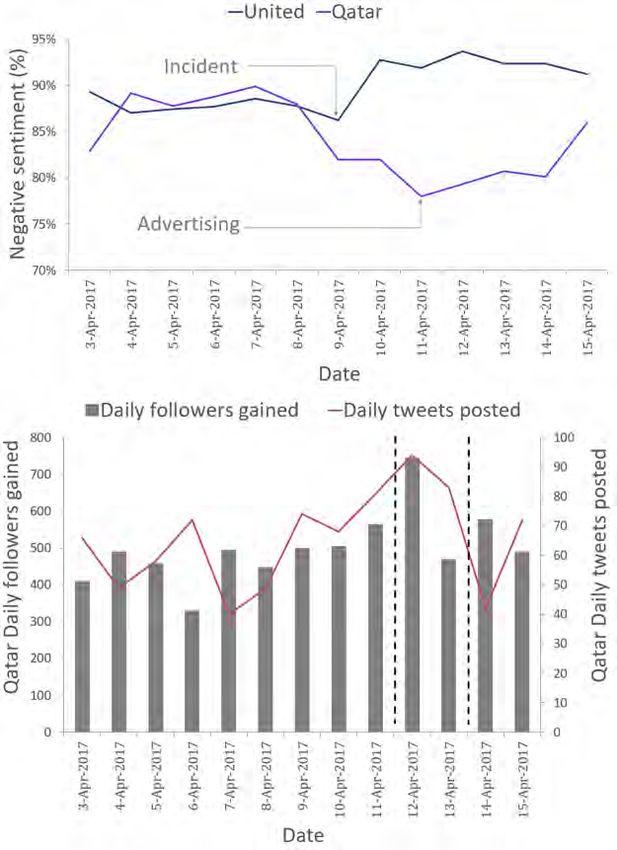
DATA PRE-PROCESSING USING SAS® PROCEDURES
The first step in working with text data is to pre-process it. Social media data is highly unstructured with
typos, bad grammar, usage of slang, the presence of special characters and unwanted content like URLs,
etc. Analyzing such data can produce misleading results. In the data pre-processing stage, we removed
reoccurring noisy data elements such as airline replies, URLs, special characters and flight numbers.
The customer tweets extracted had airline brand responses along with consumer messages. Such
responses can skew the results of sentiment analysis. An example of how airline response can alter the
result is shown in Figure 4 where a user tweet is in negative tone and response from the airline is in a
positive tone. We removed all airline brand responses and subset the tweet corpus only for user tweets.

Figure 4. Sample customer tweet with airline response highlighted in red
From the tweet corpus, we saw that customers share web links and attach pictures to their tweet
message. The web links and images appeared as embedded URLs in the tweet corpus. Removing all
such URLs was achieved through Perl regular expressions (the PRX functions) in SAS. An example of
customer tweet with embedded URL is shown in Figure 5.

Figure 5. Sample customer tweet with embedded URL highlighted in red
Tweet corpus also contained special characters and complex symbols. Therefore, for better analysis, it is
necessary to have clean data without symbols and characters like @ and #. PRX functions were used to
achieve this. A sample customer tweet with special characters is shown in Figure 6.

                                                     5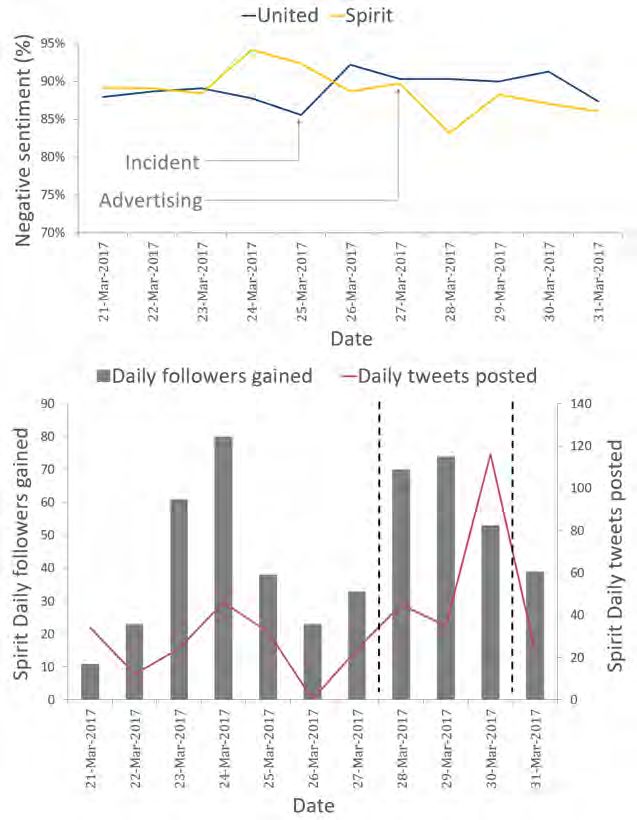
Figure 6. Sample customer tweet with special characters highlighted in red
Most of the customer tweets had flight numbers mentioned in the message. Replacing flight number
patterns with custom term ‘flight’ was accomplished through PRXCHANGE function. Flight number
patterns vary with different airline companies, so tweets were cleaned at airline level dataset and
consolidated post cleaning. An example of customer tweet with flight number is shown in Figure 7.

Figure 7. Sample customer tweet with flight numbers highlighted in red
DATA PROCESSING USING SAS® ENTERPRISE MINER
After cleaning data using SAS procedures, the prepared data was then processed using SAS Enterprise
Miner. For this, we followed the text analytic approach suggested by Chakraborty, Pagolu, and Garla
(2013). The procedure involved using appropriate NLP techniques, lemmatization, tokenization, concept
linking, entity recognition, etc. In addition to that, we also defined custom entities to discover items
specific to the airline industry.
Airline customers use airport codes as a short form to refer locations. A sample tweet of user mentioning
locations Houston, San Antonio and Denver as IAH, SAT and DEN respectively is shown in Figure 8. All
such airport codes should be treated as synonyms. The pattern is three uppercase letters but using PRX
functions to replace such instances with a common term might generalize too much and pick up random
instances of uppercase words such as ‘AND’, ‘NOT’ etc.

Figure 8. Sample customer tweet with airport codes highlighted in red

                                                    6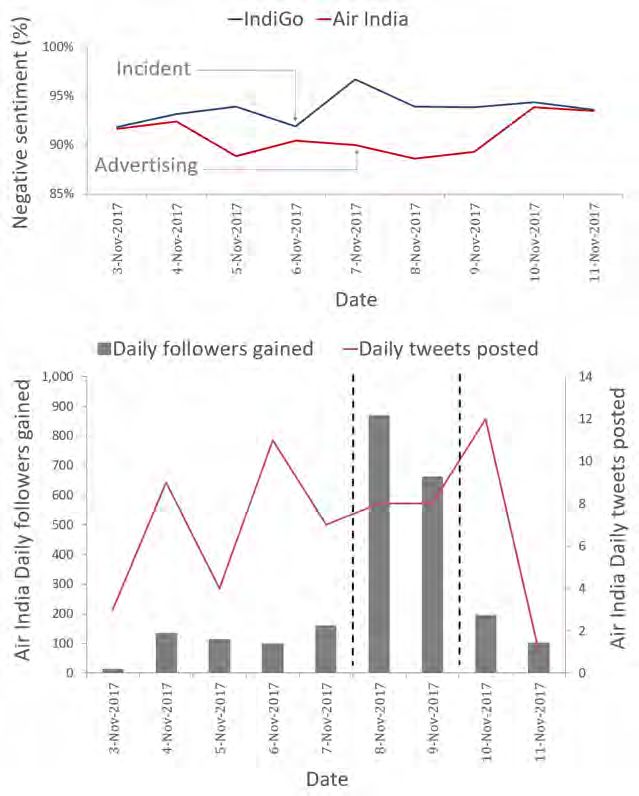
To solve this, we compiled an exhaustive list of 8,900 IATA airport codes [13] as a SAS dataset as shown
in Figure 10 and added it to the terms table of multi-word terms property option in text parsing node. This
is a possible workaround for creating custom entities as synonyms without using SAS Enterprise Content
Categorization.

Figure 10. Airport codes treated as synonyms
Similar to airport codes, customers also tweeted aircraft codes in their messages. A sample user tweet
with aircraft code mentioned is shown in Figure 11. Instances of aircraft codes should also be treated as
synonyms, so we compiled a complete list of aircrafts codes for flights every airline company [14]
considered in this study owns.

Figure 11. Sample customer tweet with aircraft code highlighted in red
Complied list of aircraft codes is then converted into a SAS dataset compatible and used in text parsing
node to be treated as synonyms. A sample of the prepared aircraft synonym list is shown in Figure 12.

Figure 12. Aircraft codes treated as synonyms
Twitter being a microblogging platform limits a user to fit only 280 characters per tweet. Hence customers
tend to use abbreviations instead of complete words. An example of a customer using abbreviation CS for
customer service and abbreviation S/o for shout out is shown in Figure 13.

xz

Figure 13. Sample customer tweet with abbreviations highlighted in red

                                                     7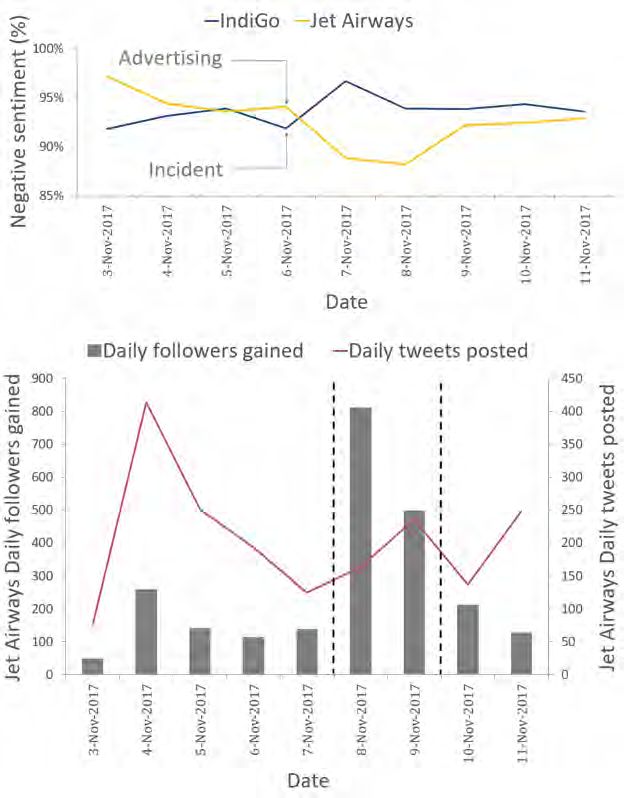
A thorough synonyms-list of 150 slang terms and abbreviations used in Twitter was prepared as a SAS
dataset and used in the text parsing process. A sample of the prepared abbreviation synonym list is
shown in Figure 14.

Figure 14. Custom Synonyms list
CONCEPT LINKS
Once the data were cleaned and filtered, concept links were examined to understand how sentiments
changed over time during the controversial incidents. Concept links help us view the terms that are highly
associated with the word of interest. The selected term (in this case, the airline) from customer comments
are surrounded by its strongest correlated terms in the form of a hyperbolic tree graph. Thick lines
indicate a strong association between the terms. For each case, we analyzed concept links from one
day’s worth of customer tweets before and after a controversial incident had occurred. This helped us to
comprehend how a controversial incident affects change in moods of the public.
CASE 1: UNITED AIRLINES LEGGINGS INCIDENT
In the case of United Airlines leggings incident, we considered the airline’s tweets from 25th March 2017
and 26th March 2017 for pre vs. post analysis. Figure 15 (left) shows that before the incident had
occurred, people complained about customer service, flight delays, and other airline failures. However,
Figure 15 (right) shows how customer mood changed overnight. People started to talk about the
controversy of a girl being stopped at the gate for wearing leggings. Customers voiced their
dissatisfaction with airline’s service post-incident which is highlighted by the terms +service +spend and
+flight.

Figure 15. Concepts links for United Airlines before (left) and after (right) the Leggings Incident
CASE 2: UNITED AIRLINES PASSENGER REMOVAL INCIDENT
For United Airlines passenger removal incident, we considered the airline’s tweets from 9th April 2017 and
10th April 2017 for pre vs. post analysis. Figure 16 (left) shows how customers were still unhappy with the
leggings incident and complained that the airline’s service as terrible and perhaps the worst. Clearly, the
airline’s brand image had suffered quite a damage. Figure 16 (right) shows how the passenger removal
incident compounded public’s negative sentiments. People let the video talk (embedded in the tweet) and

                                                     8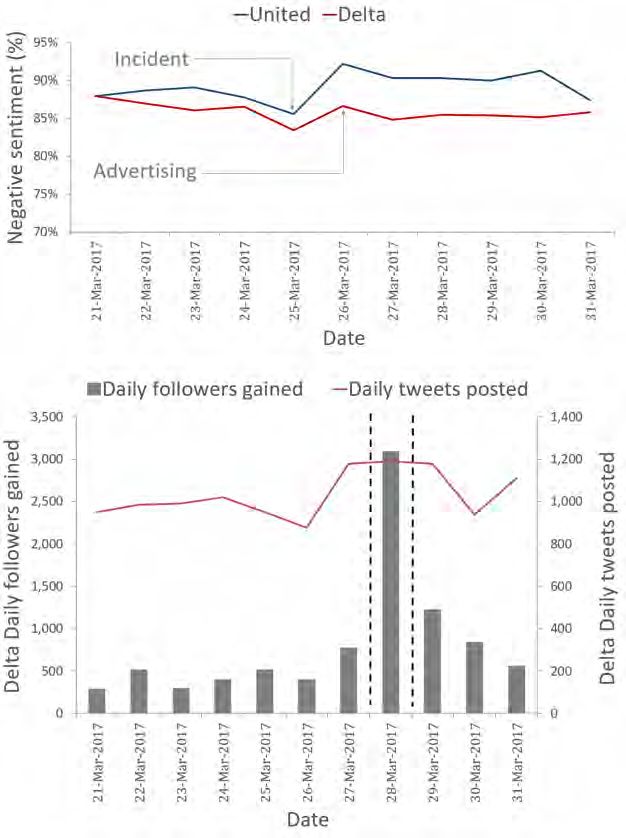
tweeted briefly on how the airline decided to randomly pick a passenger from an overbooked flight and
stopped him from flying back home.

Figure 16. Concepts links for United Airlines before (left) and after (right) the Passenger Removal
Incident
CASE 3: INDIGO AIRLINES PASSENGER MANHANDLE INCIDENT
Although IndiGo Airlines’ passenger manhandle incident occurred on 15th October 2017, video of the
episode surfaced in social media only on 7th November 2017. For this reason, we considered IndiGo
Airlines tweets from 6th November and 7th November for pre vs. post analysis.

Figure 17. Concepts links for Indigo Airlines before (left) and after (right) the Passenger
Manhandle Incident
Concept links in Figure 17 (left) shows that before the video had surfaced people felt happy about
excellent customer service provided by the airline’s flight and airport staff. However, Figure 17 (right)
shows how public emotion changed after the release of the video of passenger manhandled by the airline
staff. People felt that the airline’s real attitude towards customers had been exposed and called the
passenger assault incident as unacceptable. Customers considered the episode a shameful act and

                                                    9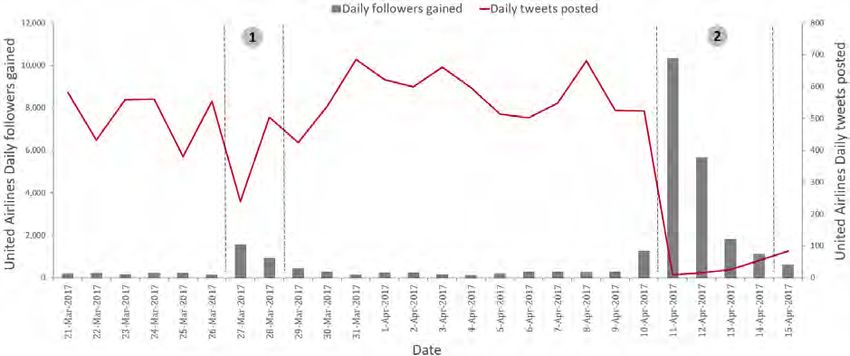
called others to boycott the airline. Furthermore, some people emphasized to cancel the airline’s license
immediately.
BUILDING A RULE BASED MODEL USING SAS® ENTERPRISE MINER
Concept links helped us understand how controversial incidents can swiftly make a reputed airline brand
infamous among customers. To examine how competitors influenced the already unhappy customers with
their advertisements, customer sentiment trend was analyzed. This was accomplished by building a rule-
based model using the ‘Text Rule Builder’ node in the SAS Enterprise Miner that automatically generates
an ordered set of rules for predicting customer sentiment as either positive or negative.
Rules generated by the Text Rule Builder node are defined for each category (positive/negative). The
rules contain conjunction that indicates the presence or absence of one or subset of terms (for example,
“term1” AND “term2” AND (NOT “term3”)). A particular customer comment will match this rule to be
categorized as either positive or negative if and only if it contains at least one occurrence of term1 and
term2 and no occurrences of term3.
From concept links, it is possible to note that affected airline brand can skew the prediction of customer
comment as positive/negative. So it is crucial to replace airline names and airline handles with custom
term ‘airline’ before feeding the data (training, validation, and scoring) to the rule-based model. It was a
project within itself, and we used a SAS macro [15] that finds airline handles from a list and replaces it
with the custom term ‘airline’ [16]. To achieve this, we compiled an exhaustive list of 170 airline handles
identified from the customer tweets to be used as a lookup table from which each handle is searched and
replaced in the tweet corpus. A sample of how actual tweet is fed as a masked tweet to the model is as
shown in Figure 18.

Figure 18. Sample data with Airline handles masked
To train the model we took a random sample of around 3,000 tweets and two different reviewers read
through each of the tweet diligently to code it as positive or negative. After comparison, we considered
only those tweets for modeling that were unanimously coded as either positive or negative. Overall, we
used 1,005 positive tweets and 1,008 negative tweets as the training dataset for the rule based model.
We used a data partition node to split the data 70:30 for training and validation.
The set of rules created by the model can be used for both descriptive and predictive purposes. When
scoring new tweets as positive or negative, the model scans thorough the ordered set of rules and
chooses the target when the first scanned rule is found in the tweet and if not proceeds to the following
rules.
The top ten rules describing positive and negative comments are as shown in the Figures 19 and 20
respectively.

                                                     10
Figure 19. Top 10 positive rules derived by Text Rule Builder
Figure 20. Top 10 negative rules derived by Text Rule Builder
The fit statistics of the text rule-based model showed that the validation misclassification rate is 21%. This
is as desired and the model used to score the entire dataset. The fit statistics of text the rule-based model
is shown in Figure 21.
Figure 21. Fit statistics of the text rule based model
As Twitter is used as a complaining platform by the airline customers, it would not be appropriate to use
the default cut off value of 0.50 as predicted probability for decision making. So considering customer
behavior and taking into account the trade-off between sensitivity, specificity, and false positivity values
we used the Cutoff node to change the threshold probability to 0.41 to predict the negative tweets.
Once the cutoff was changed we used the score node to score the entire dataset for classifying customer
tweets as positive or negative. We then used as SAS code node to export the scored dataset.
11RESULTS
From the scored dataset we studied the affected airline’s sentiment pattern over time for each one of the
three cases.
CASE 1 AND 2: UNITED AIRLINE INCIDENTS
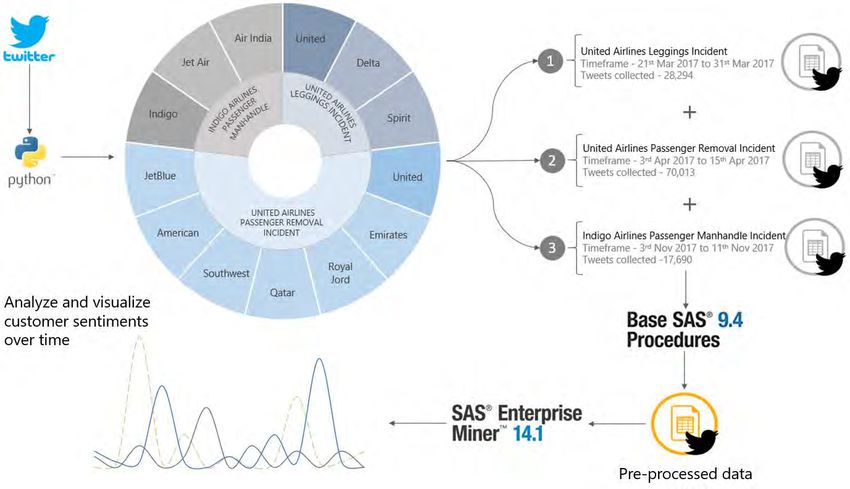
The graph below (Figure 22) shows the percentage of negative tweets for United Airlines from 21st March
2017 to 15th April 2017. It is clear from the display that United Airlines initially had negative sentiment
around 87%, but from 26th March 2017 to 30th March 2017 the percentage of negative tweets soared to
92%. This is highlighted in the graph with a strong hue of red. Evidently, customers were disappointed
with the airline brand after the leggings incident that occurred on 26th March 2017. Percentage of negative
tweets then declined after 30th March 2017 and remained around 87% for next few days.
Figure 22. United Airlines negative sentiment trend
However, the airline’s negative tweets escalated to 93% on 10th April 2017 because of the controversial
passenger removal incident that had occurred on 9th April 2017. The airline’s negative sentiments stayed
at around 93% for next several days.
To investigate how these incidents affected the airline’s Twitter following and to examine the brand’s
tweet pattern during the time of controversies, we gathered supporting evidence from online resources
[17].
Figure 23. United Airlines Daily followers gain and Daily tweets posted trend
12The dual axis graph as shown in Figure 23 with daily followers gained by the brand on primary axis and
tweets posted by the brand on secondary axis over time tells an interesting story. Contrary to common
opinion that a brand loses followers during negative incidents, United Airlines, as a matter of fact, gained
an additional 1,600 followers on 27th March 2017 and 10,340 followers on 11th April 2017 following the
leggings incident and the passenger removal incident. This is about 9 and 61 times greater than its
average gain of 168 followers per day. Also from the graph, we clearly note that the brand continued to
add new followers post-incident for next few days and this sudden follower gain subsided only after some
time.
Both these incidents truly affected the airline’s reputation and the gain in followers was a direct result of
negative publicity. People started to follow the brand out of curiosity to know the airline’s response to
such controversies. Ironically the airline brand decided to do exactly the opposite. Realizing the followers
gained are due to the negative publicity the brand remained hesitant to tweet during controversial
incidents. United Airlines on average posts about 271 tweets per day and following the passenger
removal incident the airline brand posted just 9 tweets on 11th April 2017 and continued to post limited
tweets until the followers gain declined.
CASE 3: INDIGO AIRLINES PASSENGER MANHANDLE INCIDENT
IndiGo Airlines controversial incident also shows similar results. Immediately after the unfortunate incident
the airline’s percentage of negative sentiment increased and continued to remain highly negative for the
following days.
Figure 24. IndiGo Airlines negative sentiment trend (left), Daily followers gain and Daily tweets
posted trend (right)
IndiGo Airlines on an average gains 94 new followers each day. However, the airline added 2,110
followers to its account on 8th November 2017 following the passenger manhandle incident. Similar to
United Airlines, IndiGo reduced its tweet posts on Twitter for few days after the controversy.
1. From the above cases we see that after controversial incidents, an airline’s negative sentiment
immediately soars and continuous to remain highly negative for next few days.
2. We see a strong inverse relationship behavior between the followers gained and tweets posted
for an airline brand.
THE EFFECTS OF COMPARATIVE ADVERTISING
This section discusses how comparative advertising from the competitors affects the already tarnished
brand, induces a more negative attitude towards the mocked airline and indirectly builds a substantial
brand equity and loyalty for the competitors through comparative advertising.
13CASE 1: UNITED AIRLINES LEGGINGS INCIDENT
To study the effects of comparative adverting we graph the negative sentiments of affected airline and a
competitor as a comparison chart during the same date range. Figure 25 shows negative sentiment
trends for United Airlines in comparison with Delta Air Lines (left-top) and Spirit Airlines (right-top) who
released creative advertisements on Twitter mocking United Airlines. From the graph, we clearly see that
for both Delta and Spirit there is a drop in negative sentiments subsequent to posting advertisements that
parodied United on the leggings incident.
Figure 25. United vs. Delta Comparison (left) and United vs. Spirit Comparison (right)
The graph (left-bottom) tells us that Delta Air Lines gained 3,100 new followers on 28th March 2017 after
sharing a creative poster on Twitter on 27th March 2017. This is 8 times more than its average daily
follower growth of 330. The Twitter advertisement which said “Flying Delta means comfort. (That means
you can wear your leggings)” burlesqued United Airlines and at the same time emphasized how it treats
customers better. The tweet received 117,437 likes and was shared 30,957 times on Twitter.
Likewise, Spirit Airlines too saw a drop in negative sentiments from 90% to 83% (right-top) after releasing
its advertisement on Twitter that said customers would receive 70% discount on their airfare for wearing
leggings when boarding Spirit Airlines flights. The airlines also saw an increase in followers (right-bottom)
days after the advertising but not as well as Delta. This is understandable given the fact that Spirit is a
low-cost domestic airline with a small market share on Twitter and in the airline industry.
One other interesting finding from the graph (right-bottom) is that Spirit Airlines posted 116 tweets on 30th
March 2017, two days after sharing their comparative ad. This is almost twice its daily average posts of
60 tweets. Analyzing tweets from 30th March 2017, we see that Spirit Airlines used this popularity gain to
increase its brand equity by posting offers and loyalty by addressing customer grievances.
14CASE 2: UNITED AIRLINES PASSENGER REMOVAL INCIDENT
The comparative advertisings from Emirates Airlines, Qatar Airways and fabricated tweet showing
Southwest Airlines parodying United Airlines on the passenger removal incident had a longer positive
effect for the mentioned brands. From Figure 26 (left-top) we see that Emirates Airlines negative
sentiment dropped and stayed low even few days after sharing their poster on Twitter. Emirates
comparative ad focused on why their brand is considered better than United and received 15,285 likes
with 10,253 retweets.
Southwest Airlines did not create any comparative advertisings targeting United Airlines. However, a
fabricated ad mocking United with Southwest’s brand name was shared widely on Twitter and received
21,666 likes, retweeted 12,268 times ultimately creating a positive impact for the brand. The airline’s
negative sentiments dropped from 81% to 76% and continued to stay around 77% for next few days.
In both cases, we see an increase in negative sentiment for the affected airline and a decrease in
negative sentiment for the competitor airlines.
Figure 26. United vs. Emirates Comparison (left) and United vs. Southwest Comparison (right)
Both these airlines also saw a very steep increase in the follower gain after advertisements were shared
on Twitter. Emirates follower gain increased about seven times than its usual growth rate of 477 followers
and Southwest received a maximum follower gain of 5,570 on 12th April 2017 which was 16 times greater
than its follower gain of 332 on 9th April 2017.
Similar trend was seen for Qatar Airways as well. However, the airline did not receive a significant
number of likes and retweets alike Emirates and Southwest nor gained many followers in spite of being
active on social media platforms and having a considerable market share. The possible reason could be
because of sharing its advertisement a little later than occurrence of the incident (about three days after
the incident).
15Figure 27. United vs. Qatar Airways Comparison
From the graph, we see that Qatar Airways posted 90 tweets on 12th April 2017 which is five times greater
than its daily average tweets of 17. Most of these tweets were either offers or the airline addressing
customer grievances.
CASE 3: INDIGO AIRLINES PASSENGER MANHANDLE INCIDENT
In the case of IndiGo Airlines passenger manhandle incident, Jet Airways saw a sharp decline in negative
sentiments. Though Jet Airways did not create an advertisement, a fabricated tweet with the airline name
was shared on Twitter, and the airline reaped the benefits out of the unexpected marketing campaign.
A few hours later Jet Airways officially tweeted saying the airlines did not create any advertisement
parodying IndiGo and also mentioned that mocking a brand at the time of crisis was not part of its
philosophy and ethos. However, the fabricated tweet continued to be shared on Twitter and Jet Airways
gained 812 followers on 8th November 2017 which is about eight times greater than its usual daily
average follower gain of 98.
On the other hand, Air India shared two tweets successively mocking IndiGo Airlines manhandle incident.
The first tweet claimed Air India’s provides an ‘unbeatable service’ and the second tweet said ‘we raise
our hands only to say namaste’ which assured people that the airline will treat its customers kindly. The
tweet helped Air India gain a follower count of 871 and 664 on 8th and 9th November 2017 which was
eleven and nine times greater than its daily average follower gain of 76.
16Figure 28. IndiGo vs. Jet Airways Comparison (left) and IndiGo vs. Air India Comparison (right)
STUDY TO ANALYZE THE IMPACT OF COMPARATIVE ADVERTISING
The above section discussed how comparative advertising in three different cases helped each one of the
competitor airlines gain a competitive advantage over the mocked brand and boost their brand equity
which ultimately resulted in a decline in negative sentiments. In order to further prove that decrease in
negative sentiments is a direct result of comparative advertising, there is a need to study other airlines
behavior during the same time period that did not share any comparative tweets targeting the affected
brand.
For this study, we consider the case of United Airlines passenger removal incident and choose two
airlines that 1) have an almost equal market share as other competitors, 2) active in social media
platforms and 3) did not share any comparative advertising after the controversial incident. American
Airlines and JetBlue Airlines falls into this category and are selected for this comparative study. We follow
the same methodology as discussed in the earlier sections of the paper to prepare both these airlines’
data and predict sentiments for the same date range.
Figure 29 shows a multi-line graph with negative sentiments trend over time. The airlines examined are
United Airlines (brand involved in the controversy), Emirates Airlines, Southwest Airlines, Qatar Airways
(brand with comparative advertisements that targeted United Airlines), American Airlines and JetBlue
Airlines (brand that did not share any competitive advertisement on United Airlines during the
controversy).
The comparison involves multiple trend lines in a single graph, so for easy visualization, we have used
smoothed curves instead of straight lines (not to be confused as polynomial curves). Airlines that shared
comparative advertising are color coded in the hues of red and airlines that did not share any advertising
are color coded in the hues of blue. The vertical line on 9th April 2017 indicates the day of the
controversial incident.
17Figure 29. Effect of Comparative Advertising on passenger removal incident
From the above graph, we see that there is forking out of negative sentiments between the affected
airline and rest of the airlines post controversial incident. After 9th April 2017 negative sentiments of
United Airlines increases sharply whereas for all other airlines negative emotions take a dip. The graph
also indicates deviance in negative sentiment drop between the airlines color-coded in shades blue vs.
airlines color-coded in shades of red. Though sentiments of airlines from both groups, advertising and
non-advertising, take a dip, there is a definite difference in slope of the sentiments - a steep downward
dip for the advertising airlines and a gradual descent for the non-advertising airlines. The extra downward
slope for the advertising airlines is a direct result of the comparative marketing. However, to prove that
the extra fanning out for advertising airlines is because of comparative advertising it is vital to examine
the reasons behind it. So we decided to analyze the customer tweets in depth.
COMPARISON OF ADVERTISING VS NON ADVERTISING AIRLINES
To understand what causes the extra drop in negative sentiments for the advertising airlines over non-
advertising airlines, we utilized the text topic node of SAS Enterprise Miner. Text Topics discover themes
and assign each customer tweet to zero or more of the themes. This is different from Text Clustering
which assigns each comment to only one of the themes. So Text Topics ensures customer tweets go into
multiple themes, unlike Text Clustering that forces tweets to pick the most appropriate theme. As Twitter
is a microblogging platform where people talk about multiple concepts in a single tweet, it is preferred to
use Text Topics over Text Clustering.
In this study, we analyze how sentiment change over a period for both advertising and non-advertising
airlines. So we create two datasets A and B for advertising and non-advertising airlines respectively. Both
these datasets contain an equal number of tweets for three different time frames - 1) before the
passenger removal incident occurred, 2) after the occurrence of passenger removal incident but before
the airline released comparative advertisement and 3) after the release of comparative advertising. Also
as there are multiple airlines within each of the category and each airline has a different number of
tweets, we random sample an equal number of tweets for every airline and for every timeframe so that
the total tweets in both datasets match. This removes any bias from the analysis. The framework is as
shown in Figure 30.
18Figure 30. Text Topics - Framework for data preparation
Once the datasets are prepared, we use custom topics option of the Text Topic node and use the terms
shown in the table below. The terms used in the custom topics were decided after a clear understanding
of terms generated by default Text Topic node for each of the participating airline.
Table 2. Table depicting the categorization of terms into five topics
19When we examine the distribution of tweets in five different topics for each category – advertising airlines
and non-advertising airlines, we can clearly see how the sentiment and opinions change over the three
different time frames.
Figure 31. Percentage of tweets by topic using clustering for advertising airlines
Figure 31 shows the customer sentiments trend for the advertising airlines. Before the incident occurred,
people were talking about flight delays. After the comparative advertising was released on Twitter people
regarded the airline as more desirable rather than the mocked airline. This is evident from the increase in
brand love over the period. Though positive reviews on the advertisement remained almost same, the
negative reviews considerably decreased after promotion. Also, marketing created a negative attitude for
the people towards the mocked brand as they spoke more about passenger removal incident after such
advertisement than before.
Figure 32. Percentage of tweets by topic using clustering for non-advertising airlines
Figure 32 focuses on non-advertising airlines. Tweets on flight delays decreased during the controversial
incidents but slowly picked up when other airlines shared a comparative advertisement. People talked
20about their brand love for non-advertising airlines prior burlesque advertisings, and this decreased after
other airlines’ marketing. Positive reviews for the non-advertising airlines almost remained the same
(similar to advertising airlines) nevertheless negative reviews decrease was not as significant as
compared to advertising airlines. Also a number of people tweeting about passenger removal incident
reduced after other airline’s advertisements.
CONCLUSION
Comparative advertising is essential in the airline industry dominated by few market leaders. To make a
point of differentiation new entrants, low-cost airlines and rivals from other markets adopt this advertising
technique to captivate customer attention and to strengthen their brand equity. Good advertising is about
competing smart and smart competitiveness requires choosing the right place and the right time.
Prominent customer engagement platform such as Twitter proves to be the perfect stage for such
advertisings, and there is no better time than moments surrounding controversial incidents.
This paper presents how comparative advertising is used as a competitive marketing tool in the airline
industry to target the market leaders. Concept links helped us understand how a brand perception of the
airline involved in controversy can change quickly. Text mining and sentiment analysis of customer tweets
helped us realize the effects of comparative advertisings on lowering the brand value of the large airline
carriers. Finally, Text Topics helped us understand how comparative advertisings assure customers that
the advertiser’s brand is different from other airlines and influence customers in making decisions.
REFERENCES
[1] Smith, Fred and Cox, Braden. “Airline Deregulation”. The concise Encyclopedia of Economics. 2008.
Available at http://www.econlib.org/library/Enc/AirlineDeregulation.html
[2] Ciliberto, Federico, Murry, Charles and Tamer Elie. “Market Structure and Competition in Airline
Markets”. Social Science Research Network. 2016. Available at
https://papers.ssrn.com/sol3/papers.cfm?abstract_id=2777820
[3] Shao, A.T., Bao, Y. and Gray, E. “Comparative Advertising Effectiveness: A Cross-Cultural Study”,
Journal of Current Issues and Research in Advertising. 2004. 26(2), pp. 67-80.
[4] Metwally, M.M. “Role of advertising in oligopolistic markets: theory and evidence”. University of
Wollongong Research Online. 1991. Available at
http://ro.uow.edu.au/cgi/viewcontent.cgi?article=1310&context=commwkpapers
[5] Zendesk. “Providing great social media customer service”. Accessed January 6, 2018.
https://www.zendesk.com/resources/customer-service-through-social-media/
[6] Weber, Karin and Sparks, Beverley. “Service Failure and Recovery in a Strategic Airline Alliance
Context: Interplay of Locus of Service Failure and Social Identity”. Griffith University Research Online.
2010. Available at https://experts.griffith.edu.au/publication/n5ef703d4af3c7d3d36c9158bb791c3cf
[7] Investopedia. “Is the airline industry in an oligopoly state?”. Accessed January 14, 2018.
https://www.investopedia.com/ask/answers/011215/airline-industry-oligopoly-state.asp
[8] Forbes. “The Big Three: U.S. Airlines Versus Persian Gulf Carriers”. Accessed February 11, 2018.
https://www.forbes.com/sites/realspin/2015/05/12/the-big-three-u-s-airlines-versus-persian-gulf-
carriers/#25a8d6c035aa
[9] Statista. “Air carrier market in India - Statistics & Facts”. Accessed February 18, 2018.
https://www.statista.com/topics/3016/air-carrier-market-in-india/
[10] United Hub. “To our customers…your leggings are welcome!”. Accessed February 25, 2018.
https://hub.united.com/our-customers-leggings-are-welcome-2331263786.html
[11] United Newsroom. “Statement from United Airlines CEO Oscar Munoz on United Express Flight
3411”. Accessed February 25, 2018. http://newsroom.united.com/news-releases?item=124755
21[12] The Hindu BusinessLine. “IndiGo Airlines report to Civil Aviation Minister”. Accessed March 4, 2018.
https://www.thehindubusinessline.com/multimedia/archive/03209/IndiGo_writes_to_A_3209114a.pdf
[13] Ourairports. “airports.csv”. Accessed March 4, 2018. http://ourairports.com/data/
[14] Planefinder. “Plane Finder Aviation Database”. Accessed March 4, 2018.
https://planefinder.net/data/airlines
[15] Lin, Jennifer. A Macro tool to search and replace portions of text. 1999. Proceedings of the SAS
Users Group International Conference, Miami Beach, FL, SAS. Available at
http://www2.sas.com/proceedings/sugi24/Coders/p086-24.pdf
[16] Campbell, Joel. A One Line Method to Extract a Substring from a String using PRX. Proceedings of
PharmaSUG, Chicago, IL, PharmaSUG. Available at
https://www.pharmasug.org/proceedings/2013/CC/PharmaSUG-2013-CC35.pdf
[17] Socialblade. “Twitter Detailed Statistics”. Accessed March 4, 2018. https://socialblade.com/twitter/
[18] Chakraborty, Goutam, Murali Pagolu and Satish Garla. 2013. Text Mining and Analysis: Practical
Methods, Examples, and Case Studies Using SAS® SAS Institute.
[19] Getting Started with SAS(R) Text Miner 14.1- Documentation on Using Text-Filters and Text Rule
Builder Nodes. https://support.sas.com/documentation/cdl/en/emgsj/67981/PDF/default/emgsj.pdf
[20] Dwibhasi, Sharat, Jami, Dheeraj, Lanka, Shivkanth and Chakraborty, Goutam. 2015. Analyzing and
visualizing the sentiment of the Ebola outbreak via tweets. Proceedings of the SAS Global Forum 2015,
Dallas, TX, SAS. Available at https://support.sas.com/resources/papers/proceedings15/3330-2015.pdf
[21] Pagolu, Murali, Engelhardt, Christina and Cheyanne Baird. 2017. Exploring the Art and Science of
SAS® Text Analytics: Best practices in developing rule-based models. Proceedings of the SAS Global
Forum 2017, Orlando, FL, SAS. Available at
http://support.sas.com/resources/papers/proceedings17/SAS0587-2017.pdf
ACKNOWLEDGMENTS
The authors would like to thank Topher Wren, Dr. Dmitriy Khots and Shruti Palasamudram of West
Corporation for their support and guidance throughout the process. We would like to thank Alagappan
Ramu who provided technical expertise that assisted the research. The authors would also like to thank
Priyanka Raja for valuable insights and Aishwarya Ramamurthy for constructive criticism of the
manuscript. We would also like to thank Dr. Goutam Chakraborty for the invitation to present this topic at
SAS Global Forum 2018.
CONTACT INFORMATION
Your comments and questions are valued and encouraged. Contact the authors at
Vinoth Kumar Raja
West Corporation
vraja@west.com
Padmashri Janarthanam
Mutual of Omaha
padma.janarthanam@mutualofomaha.com
22You can also read