Forest sustainability in Belarus - Laborelec
←
→
Page content transcription
If your browser does not render page correctly, please read the page content below
GDF Suez- Electrabel Forest sustainability in Belarus
Forest sustainability in Belarus
Client:
Engie - Electrabel
boulevard Simon Bolívar
B-1000 Bruxelles
Project No.: 130373
June 2017
SGS BELGIUM S.A. June 2017 1
Project No.: 130373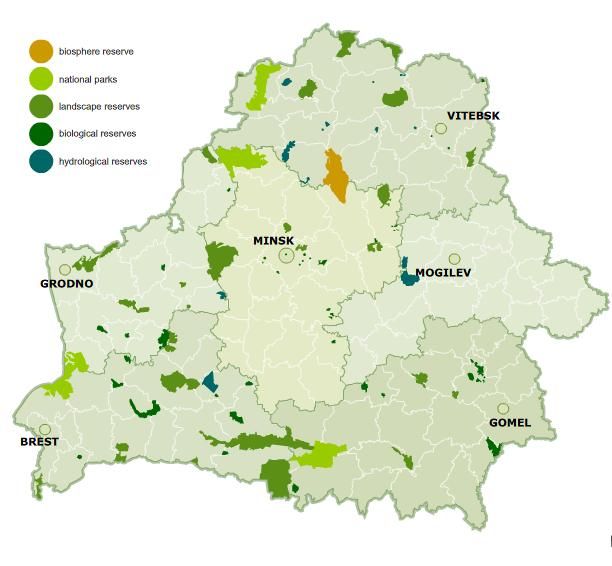
GDF Suez- Electrabel Forest sustainability in Belarus
CONTENTS
1. Introduction ......................................................................................................................................4
2. Belarus forests overview .................................................................................................................4
2.1. Location and distribution ..........................................................................................................4
2.2. Ecological zones ......................................................................................................................8
2.3. Forest ownership ................................................................................................................... 11
2.4. Competent authorities ........................................................................................................... 11
2.5. Overview of wood-related industry ........................................................................................ 15
3. Sustainability of Belarus forest ..................................................................................................... 19
3.1. Evolution of forest area and risk of conversion ..................................................................... 19
3.2. Living wood volumes and removals ...................................................................................... 21
3.3. Protection of ecosystems and biodiversity ............................................................................ 23
3.4. Protection of water ................................................................................................................ 26
3.5. Protection of soils .................................................................................................................. 27
3.6. Protection of carbon stocks ................................................................................................... 27
3.7. Protection of air quality .......................................................................................................... 28
3.8. Illegal logging ........................................................................................................................ 29
3.9. Civil rights and traditional rights ............................................................................................ 30
3.10. Forest certification ............................................................................................................. 30
4. Conclusions .................................................................................................................................. 31
FIGURES
Figure 1 : General map of Belarus .........................................................................................................5
Figure 2 : Population repartition by region map .....................................................................................6
Figure 3 : Structure of Land area by land category ................................................................................6
Figure 4 : Percent forest cover of the territory ........................................................................................7
Figure 5 : Forest division subject to their functions (2015) .....................................................................7
Figure 6 : Location of forests affected by radiation fallout at forestry enterprises belonging to the
Ministry of Forestry ..........................................................................................................................8
Figure 7 : Ecological zone of Belarus .....................................................................................................9
Figure 8 : Distribution of forest cover ......................................................................................................9
Figure 9 : Species composition of forests............................................................................................ 10
Figure 10 : Forestry management organization structure ................................................................... 12
Figure 11 : Forest industry production categories ............................................................................... 15
Figure 12 : Production trends, imports, and exports ........................................................................... 17
Figure 13 : Production export according to country in 2009 ................................................................ 18
Figure 14 : Development of forest cover in Belarus since 1887 .......................................................... 19
Figure 15 : Development of forest use in Belarus ............................................................................... 20
Figure 16 : Reforestation and afforestation in Belarus ........................................................................ 20
Figure 17 : Growing stock per tree specie ........................................................................................... 22
Figure 18 : Specially Protected Areas ................................................................................................. 24
Figure 19 : Number of forest fires and forest area affected by fires .................................................... 29
SGS BELGIUM S.A. June 2017 2
Project No.: 130373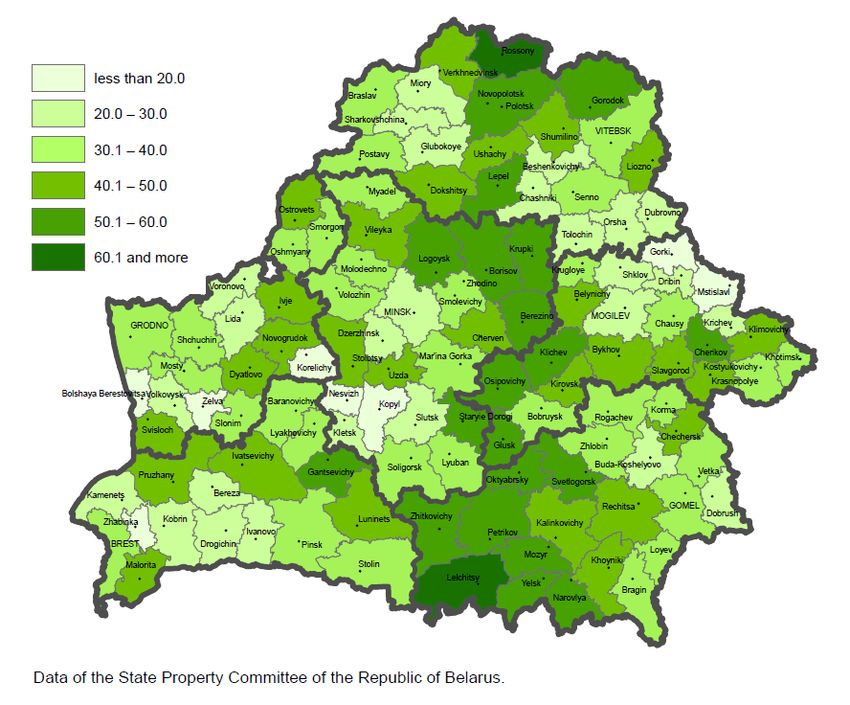
GDF Suez- Electrabel Forest sustainability in Belarus
TABLES
Table 1 : Composition of forests (2013) .............................................................................................. 10
Table 2 : Repartition of forest area among ministries and institutions ................................................ 11
Table 3 : Forest and other wooded land cover between 1990 and 2015 ............................................ 19
Table 4 : Reforestation and afforestation between 2010 and 2016 .................................................... 21
Table 5 : Growing stock between 1990 and 2015 ............................................................................... 21
Table 6 : Forest felling area between 2010 and 2015 ......................................................................... 22
Table 7 : Forest loss area between 2010 and 2015 ............................................................................ 23
Table 8 : Comparison of MCPFE classes of protected and protective forest and other wooded land in
Europe, forest management approaches (FMAs), and separated forest areas according to the
Triad zonation approach ............................................................................................................... 25
Table 9 : Area of forest protected, according to MCPFE Assessment Guidelines .............................. 26
Table 10 : Area of forest dedicated to soil, water and other ecosystem functions (MCPFE class 3) . 26
Table 11 : Carbon stock in forests (million metric tonne) .................................................................... 27
Table 12 : Carbon emission and removal (kt CO2 eq) ........................................................................ 27
Table 13 : Forest fires .......................................................................................................................... 28
SGS BELGIUM S.A. June 2017 3
Project No.: 130373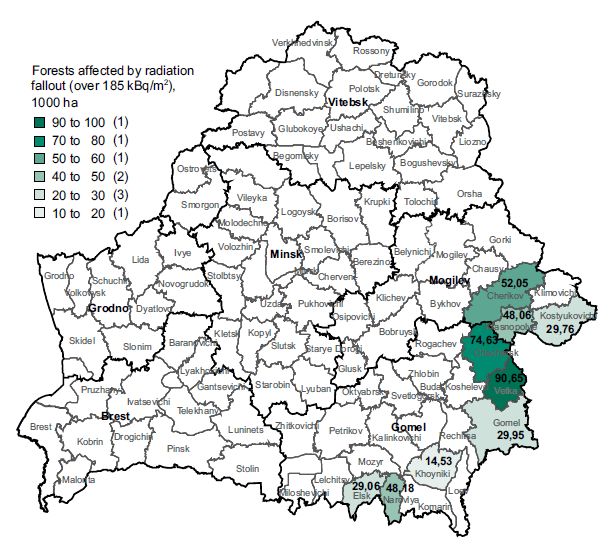
GDF Suez- Electrabel Forest sustainability in Belarus
1. Introduction
The combustion of wood for energy purpose is not considered to contribute to the augmentation of
greenhouse gases concentration in the atmosphere, as long as the CO2 emissions released during
the combustion of wood are balanced by the growth of new trees. It is therefore essential to
investigate if the forests in the region where the wood used for energy purpose are managed in a
sustainable way, avoiding resources associated with overexploitation of forests, land use change,
depletion of carbon stocks, etc...
In this framework, literature research was carried out to produce a summary of forest management in
Belarus, including general condition, management and sustainability assessment.
2. Belarus forests overview
2.1. Location and distribution
Belarus is a country of the eastern part of Europe that borders Lithuania on the north-west, Latvia on
the north, the Russian Federation on the north and the east, Ukraine on the south and Poland on the
west. The country has no connection to the sea. The country is relatively flat having its lowest place
80-90 meters above sea level and its highest point 345 meters above sea level, the hills are mainly
located in the centre and the east. It has an area of 207,595 km². It has an average annual population
1
of 9,489,600 habitants in 2016 .
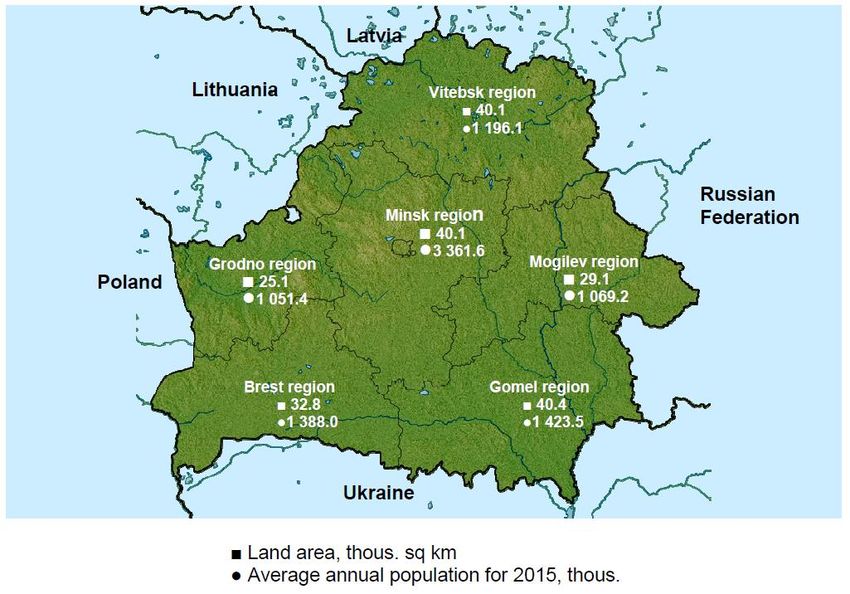
The country is divided in six regions and the city of Minsk. There is a second level subdivision called
raions (“district”). The regions are represented on Figure 1. The repartition of the population among
the different regions can be seen on Figure 2.
Land use in Belarus is distributed in four categories: agricultural land, forest land, land under swamps
and water bodies, and other land. In 2016, forest land occupies most of the territory with 8,742,000
ha (42.1% of the total country area), agricultural land takes up to 8,582,000 ha (41.3%), land under
swamps and water bodies represents 1,286,000 ha (6.2%) and other land occupies the rest with
2
2,150,000 ha (10.4%) (Figure 3) .
3
As said above, forested lands cover approximately 8,742,000 ha in 2016 . There is an entity in
Belarus called the Forest Fund. The Forest Fund comprises all forests, and also lands, which are not
4
covered by forests (forest lands and non-forest lands). It accounts for approximately 9,429,000 ha .
1
Environmental protection in the Republic of Belarus, 2016. p.18.
2
Environmental protection in the Republic of Belarus, 2016. p.163.
3
FAO, 2015. Global Forest Resources Assessment 2015
4
Statistical yearbook of the Republic of Belarus 2016
SGS BELGIUM S.A. June 2017 4
Project No.: 130373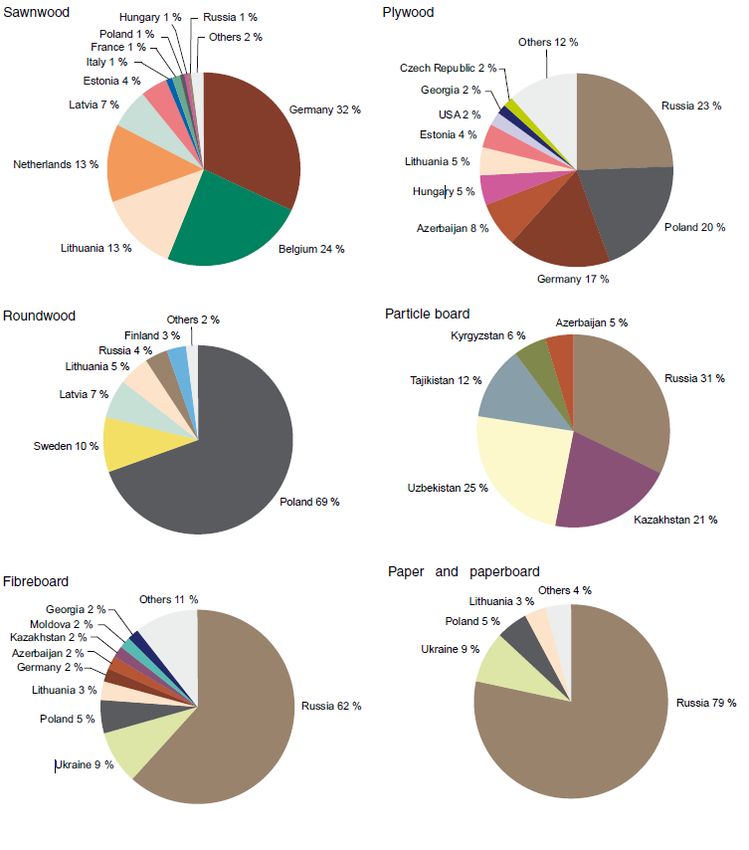
GDF Suez- Electrabel Forest sustainability in Belarus
Figure 1 : General map of Belarus
Source: Ezilon.com
SGS BELGIUM S.A. June 2017 5
Project No.: 130373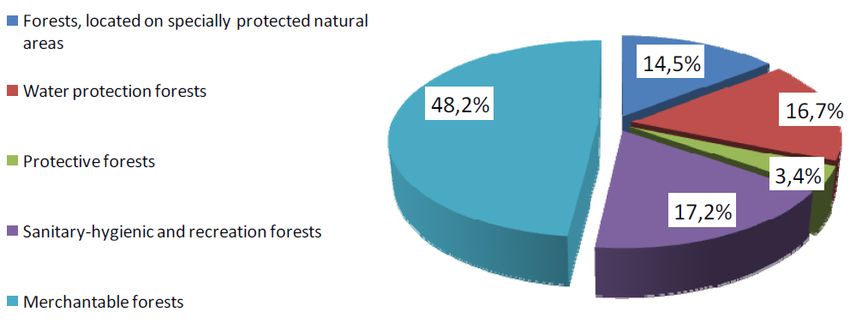
GDF Suez- Electrabel Forest sustainability in Belarus
Figure 2 : Population repartition by region map
Source: Environmental protection in the Republic of Belarus, 2016
Figure 3 : Structure of Land area by land category
Source : Environmental protection in the Republic of Belarus, 2016
The distribution of forest land by administrative districts is presented on Figure 4. The highest density
of forests follows a north to south axis in the centre of the country. The rest is unevenly distributed
among the districts.
SGS BELGIUM S.A. June 2017 6
Project No.: 130373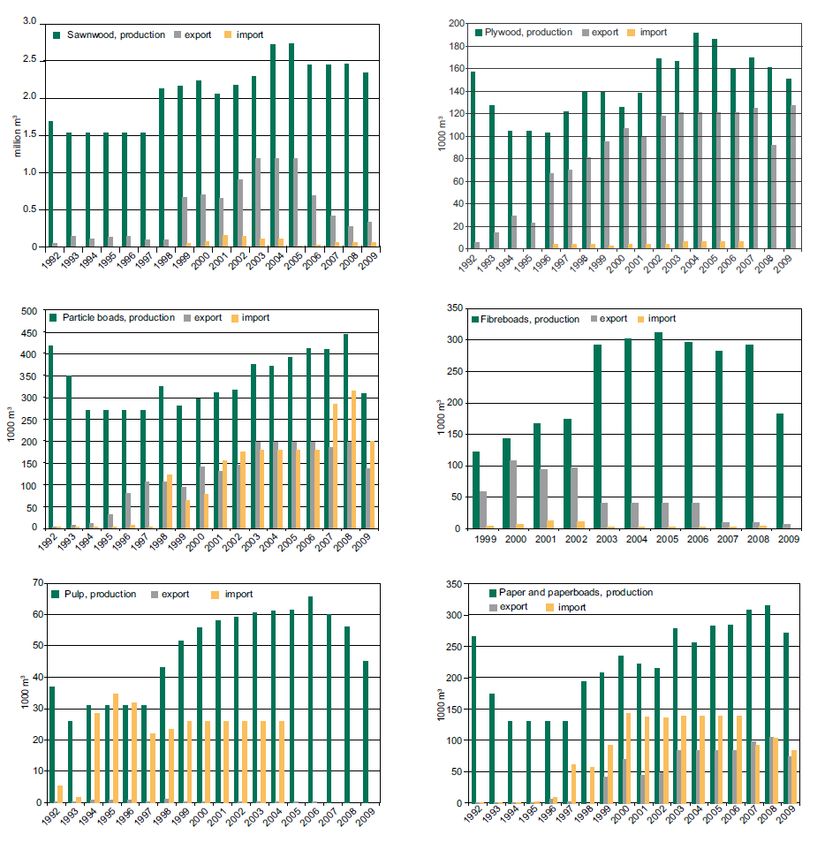
GDF Suez- Electrabel Forest sustainability in Belarus
Figure 4 : Percent forest cover of the territory
Source : Environmental protection in the Republic of Belarus, 2016
The distribution of forest standard in the Republic of Belarus is shown on Figure 5. As 48.2% of forest
are merchantable forests, 14.2% are part of the specially protected natural territories, 16.7% are for
water protection, 3.4% are protective forests, 17.2% are dedicated to sanitary-hygienic and
5
recreation .
Figure 5 : Forest division subject to their functions (2015)
Source : Krasovsky, D., 2015. Presentation: Republic of Belarus. Implementing criteria and indicators for sustainable forest
management
5
Krasovsky, D., 2015. Presentation: Republic of Belarus. Implementing criteria and indicators for sustainable forest
management
SGS BELGIUM S.A. June 2017 7
Project No.: 130373GDF Suez- Electrabel Forest sustainability in Belarus
Due to the Chernobyl accident in 1986, parts of the forested areas of Belarus have been affected by
radiation fallout. 22% of the Forest Fund area presents a radioactive contamination over 185 kBq/m²
(Figure 6).
Figure 6 : Location of forests affected by radiation fallout at forestry enterprises belonging to
the Ministry of Forestry
Source : Woodfuels Programme 2009
2.2. Ecological zones
Belarus is in the transitional zone between the maritime climates and the continental climates. The
climate varies from mild or cold winters to cool and moist summers. The average minimum
temperatures in January range from -4°C in southwest (Brest Region) to -8°C in northeast (Vitebsk
Region). The average temperature in summer approximates +18°C. The average annual rainfall
ranges between 550 and 700 mm with its maximum in June and July.
According to FAO, the entire territory of Belarus is characterized by a unique type of ecological zone:
temperate continental forest zone (Figure 7). The ecological zone “temperate continental forest” has
nutrient-rich bedrock that allows vegetation to grow spontaneously. The land is then well suited for
forests and agriculture.
SGS BELGIUM S.A. June 2017 8
Project No.: 130373GDF Suez- Electrabel Forest sustainability in Belarus
Figure 7 : Ecological zone of Belarus
Source : http://www.fao.org/forestry/country/19971/en/
Figure 8 presents the distribution of the forest cover on the territory. The forested areas are well
distributed on the territory. Closed forests are mainly located along a North-South axis in the center of
the country.
Figure 8 : Distribution of forest cover
Source : http://www.fao.org/forestry/country/19971/en/
SGS BELGIUM S.A. June 2017 9
Project No.: 130373GDF Suez- Electrabel Forest sustainability in Belarus
Concerning the distribution of forest tree species, coniferous dominates the Belarusian forests with
5,192,748 ha (59.4% of the forests area). Hard deciduous takes up to 3,068,442 ha (35.1%) and soft
deciduous occupies 480,810 ha (5.5%).
The repartition of the main tree species throughout the country is represented on Figure 9. Three
species dominate the repartition: pines, birch and spruce with respectively 4,388,484 ha, 2,028,144
6
ha and 804,264 ha that correspond to 50.2%, 23.2% and 9.2% of the total forested area .
Figure 9 : Species composition of forests
2,1% 3,4%
Pine
8,5% spruce
oak
23,2% birch
50,2%
alder
aspen
9,2%
3,4% other species
Source : Republic of Belarus. Implementing criteria and indicators for sustainable forest management
The age distribution of forests is not good from a sustainable economical development point of view.
The average age of forests is about 51 years. The distribution in age is unbalanced, the young and
middle age dominates all categories of forest resources. This is due to intensive harvesting after the
7
Second World War until 1960 .
According to the FAO in 2013, the forests are mainly composed by naturally regenerated forest
(73.23% of the forest land), planted forests (22.12% of the forest land) and in a minor way, primary
forests (4.63% of the forest land) (Table 1).
Table 1 : Composition of forests (2013)
Categories Forest area (000 ha) % of forest land
Primary forest 400 4,63%
Other naturally regenerated forest 6323,3 73,23%
Planted forest 1910,2 22,12%
… of which of introduced species 1 0,01%
Total forest land 8634,5 100
Source : FAO, Global Forest Resources Assessment 2015
6
Krasovsky, D., 2015. Presentation: Republic of Belarus. Implementing criteria and indicators for sustainable forest
management
7
Gerasimov, Y. & Karjalainen, T., 2010. Atlas of the forest sector in Belarus. Working Papers of the Finnish Forest Research
Institute 170
SGS BELGIUM S.A. June 2017 10
Project No.: 130373GDF Suez- Electrabel Forest sustainability in Belarus
2.3. Forest ownership
Forests in Belarus are 100% owned by the State. The Forest Fund is distributed among different
ministries and institutions. The vast majority of it is managed by the Ministry of Forestry (85.5%), the
President Administrative Department manages 8% while the rest is split among the other ministries
8
and institutions (Table 2) .
Table 2 : Repartition of forest area among ministries and institutions
Name of the ministries, Forest area (000 Number of legal entities engaged in
% of total area
organizations ha) forestry management
Ministry of forestry 8103,1 85,6% 95
Minitry of Defense 89,6 0,9% 2
Ministry for Emergency Situation 216,1 2,3% 1
Ministry of Education 27,6 0,3% 2
President Administrative 753,7 8,0% 8
Department
Academy of Sciences 41,4 0,4% 3
Local Authorities 38,2 0,4% 4
Joint Stock company "Vitebskdrev" 198,9 2,1% 1
Total forest land 9468,6 100,0% 116
Source : Republic of Belarus. Implementing criteria and indicators for sustainable forest management
Companies and private individuals can obtain forest rights for a certain period of time. The period of
time depends on the activity. Forests can be leased from one year to 15 years for wood harvesting, it
happens for some cases that the rights do not exceed one year. Usage rights can also be obtained
for other activities, such as collecting non-wood forest products or hunting. These rights are obtained
9
through auctions or by decision of the executive agency .
2.4. Competent authorities
The Ministry of Forestry is the republican authority responsible for forestry matters in Belarus. It
works in accordance with Forest Code adopted in 2000, and Regulations on the Ministry of Forestry
approved by Decree of the Council of Ministers of the Republic of Belarus dated march 16, 2004
#298. The Ministry realizes the common state economic, scientific and technical policy in the
utilization, protection, conservation of the Forest Fund and reproduction of forests in Belarus, co-
ordinates activities of other state authorities concerning this field, creates normative legislative basis
on forestry management, develops and realizes state programs on rational utilization, improvement of
productivity and sustainability of forest, protection of their biological and landscape diversity, increase
of environment making , conservation, recreational and other functions of forest.
There are 11 special organizations, these are responsible for organizational, methodological and
information work, practical implementation of activities on reproduction, protection, conservation of
forest and rational utilization of forest resources: “Belgoles”, “Belgiproles”, “Bellesexport”,
8
Krasovsky, D., 2015. Presentation: Republic of Belarus. Implementing criteria and indicators for sustainable forest
management
9
Forest Code 2000
SGS BELGIUM S.A. June 2017 11
Project No.: 130373GDF Suez- Electrabel Forest sustainability in Belarus
“Bellesozashchita”, “Bellesrad”, “Belgosohota”, “Ruz-Les”, Republican Forest Selection and Seed
10
Centre, Belarus Forest newspaper, magazine “Forest and Hunting Management” .
The State is represented at the regional level by six State Forestry Production Associations which
include 95 State forestry enterprises (average area of 70 thousand ha) and 822 management units
(average area is 8 thousand ha) (Figure 10).
Figure 10 : Forestry management organization structure
Source : Presentation: Forest and forestry of the Republic of Belarus
The main objectives and task of sustainable management and forest utilization in the Republic of
Belarus stated in the Materials of the National Forest Certification System of the Republic of Belarus
are:
Sustainable forest management and forest utilization is carried out in order:
- to preserve forest and other resources related to the forest, their biological and landscape
diversity;
- to strengthen ecological functions of forest;
- to increase economic efficiency of forestry and to meet requirements of users in forest
products in Belarus and out of Belarus;
- to ensure social justice for workers of forestry complex and population related with forest.
Tasks of sustainable forest management and forest utilization in the field of ecology are as follows:
- conservation and restoration of biological and landscape diversity on the territory of forest
fund;
- facilitation of dissemination of useful components o animal and plants world on the territory
contiguous to the forest fund through introduction of appropriate systems of forest
management, technological processes and methods of forestry operations and forest
utilization;
- maintenance and strengthening of water protection role of the forest through conservation of
unity and sustainability of forest cover near water basins, river sources and other water
sauces, at columbines, in valleys, in flood-lands, near water supply points and other
10
Material of the National Forest Certification System of the Republic of Belarus
SGS BELGIUM S.A. June 2017 12
Project No.: 130373GDF Suez- Electrabel Forest sustainability in Belarus
territories which are important for optimization of hydrological regime, protection against
silting, guaranty of clean surface of waters;
- maintenance and strengthening of soil protection functions of forest through conservation of
existing and creation of new plants on the lands with wind and soil erosion;
- maintenance and strengthening of climate regulating role of forest through increase of their
ability to binding of atmospheric carbon;
- strengthening of stable impact of forest on temperature regime and regime f precipitation
through conservation and increase of forest coverage, optimization of forest utilization and
reduction of rejection of green-house gases into atmosphere in technological processes of
forestry operations and harvesting;
- support and strengthening of absorption and barrier roe of forest in view of man-caused
contaminations including radioactive materials;
- support and strengthening of sustainability of forest ecosystems to the unfavorable impact of
natural and anthropogenic origin;
- compliance with ecological aspects of sustainable forest management and forest utilization in
the form of effective and flexible inventory system of forest ad forestry projection including
forest management and operative planning of operations;
- availability of effective and independent control system over compliance with ecological
requirements to the forestry operations and forest utilization defined by international and
national legislations, and standards of sustainable forest management and forest utilization.
- maintenance of necessary level of knowledge of specialists of forestry sector in the field of
ecology through system of training and re-training;
- maintenance of implementation of obligations in the sphere of responsibility of forestry
pursuant to global nature protection conventions [4]-[10].
Tasks of sustainable forest management and forest utilization in the field of economy are as follows:
- permanent forest utilization and reproduction of forest resources;
- prevention of reduction and exhaustion of forest resources and other useful features of forest
related to this;
- optimization of relation of the area of production forest, forest on the specially protected
nature territories and forest of other protection categories;
- increase of quality, customer features and competitiveness of forest products and services of
forestry sector;
- expansion of assortment of forest products and services proposed at the internal and foreign
markets by organizations of forest complex;
- sustainability and stable growth of economic indicators of organizations working in forestry
sector;
- effective and independent control system over compliance with economic requirements to the
forestry operations and forest utilization defined by international b national legislation, state
standards of sustainable forest management and forest utilization;
- development of international cooperation of the Republic of Belarus in the field of forestry,
utilization of forest resources, forest protection and sustainable forest management, more
active participation in international economic and scientific and technical cooperation.
Tasks of sustainable forest management and forest utilization in social sphere are as follows:
- improvement of customer features of forest products;
SGS BELGIUM S.A. June 2017 13
Project No.: 130373GDF Suez- Electrabel Forest sustainability in Belarus
- exclusion of unacceptable risk to life, health, inheritance of people, property and environment
in the process f production, exploitation (utilization), storage, transportation, realization and
utilization of forest products;
- guaranty to the forest workers that their labor rights and defined social privileges will be met;
guaranty of safe conditions and appropriate salary, possibility of professional growth through
system of training and re-training;
- immediate satisfaction of needs of workers of forest complex including retired pensioners,
invalids, family members of the workers, if possible on advantage basis, in gods and services
provided by organizations working in forestry sector and with forest utilization;
- satisfaction of needs of local population, training institutions, institutions of health sector and
social enterprises in forest products within the frames defined by legislation of the Republic of
Belarus and decisions of local authorities;
- maximum satisfaction of needs of branches of economy of the Republic of Belarus in forest
products, including industrial enterprises, agricultural enterprises and other situated in the
zone of activity of forest organizations;
- conservation and increase of employment level of local population in forest complex in order
to improve livelihood of population and to support social stability;
- increase of efficiency of organizations of forest complex and their role on economy of
administrative districts, on the territories of which they are situated;
- strengthening of economic independence and social stability of forest complex;
- maintenance of effective and stable control system over compliance with social requirements
to the forestry operations defined by international and national legislations, this standard, and
standards on sustainable forest management and forest utilization.
- Implementation of international obligations of the Republic of Belarus in the field of workers
rights.
100% of the forest area is under a management plan. All Forest Fund territories are covered by the
basic forest inventory with the 10-year rotation, and they are the subject for the elaboration of the
forest management plan for the 10-year period. The National Correspondent opinion certifies that
there should not be any significant changes in the structure of the main designated functions of
forests in Belarus in the nearest years. This structure corresponds to the objectives and targets of the
11
forest management .
11
FAO, 2015. Global Forest Resources Assessment 2015.
SGS BELGIUM S.A. June 2017 14
Project No.: 130373GDF Suez- Electrabel Forest sustainability in Belarus
2.5. Overview of wood-related industry
About 80% of the Belarusian forest industry remains state-controlled, the other 19% consists in non-
governmental companies allowed by the State; organized in a group called Bellesbumprom, which
produces 4 million m³ of forest products in Belarus. According to the forecasts, the volume of timber
12
consumption will exceed 7.8 million m³ by 2017 .
According to the Ministerial Conference on the Protection of Forests in Europe (MCPFE), the sector
of the wood-related industry contributes to 2.7% of the Gross Domestic Product in 2010. With a total
13
GDP of around 39 billion euro, the forest industry accounts for approximately 1 billion euro .
14
For the year 2010, the allowable harvesting volume in Belarus was about 16.3 million m³ per year .
About 81 to 96% of it is utilized. The annual harvesting volume was approximately 14 million m³. This
15
number has been stable over the last years .
In its structure, the mechanical woodworking dominates the forest industry production (69.5%),
followed by the pulp and paper industry (18.6%), the logging industry contributes 10.5%. Mechanical
woodworking is sub-divided in the production of furniture (62.3%), wood-based boards (24%),
16
sawnwood (6.6%) and matches (2.2%) (Figure 11).
Figure 11 : Forest industry production categories
Furniture production
11%
Wood-based boards
19% 44% Sawnwood
Matches
3% other
1% Paper industry
5% 17% Logging industry
Source : Gerasimov, Y. & Karjalainen, T., 2010. Atlas of the forest sector in Belarus.
The industrial roundwood production for the whole country approximates 7.4 million m³ for the year
2007 while its domestic consumption was around 5.6 million m³. Part of the 1.8 million m³ left is for
exportation and the rest is left unused. According to the MCPFE, the volume of exported wood
12
Presentation: Belarusian Production and Trade Concern of timber, woodworking and pulp and paper industry
"BELLESBUMPROM"
13
FOREST EUROPE, UNECE and FAO 2011, State of Europe’s Forests 2011. Status and Trends in Sustainable Forest
Management in Europe.
14
Forestry programme 2006, Forestry programme 2009, Baginsky 2004
15
Gerasimov, Y. & Karjalainen, T., 2010. Atlas of the forest sector in Belarus. Working Papers of the Finnish Forest Research
Institute 170, p.14.
16
Gerasimov, Y. & Karjalainen, T., 2010. Atlas of the forest sector in Belarus. Working Papers of the Finnish Forest Research
Institute 170, p.18.
SGS BELGIUM S.A. June 2017 15
Project No.: 130373GDF Suez- Electrabel Forest sustainability in Belarus
stagnated between 2005 and 2010 around 1.3 million m³. Bellesbumprom and the Ministry of
Forestry are the biggest consumers of their wood industry with respectively 44.5% and 11.1% of the
total consumption. The official number from the Ministry of Forestry for 2015 indicates a total of 13.5
million m³ of cuttings of all kinds, which is a significant increase compared to the 2007 number.
Figure 12 shows the production, export and import volume trends per type of production (sawnwood,
plywood, particle boards, fibreboards, pulp, paper and paperboards). The trends of the different
productions show a decline until 1998 followed by an increase. The last few years before 2009 show
different trends depending on the production, some decline from 2005-2006 (sawnwood, plywood,
fiberboards, pulp), Particle boards and paper production continue to increase until 2008 and see their
trend changing for the last year. The recent year decrease is explained by the economic crisis.
However, the first half of 2010 sees the production increasing by 7% for sawnwood, 22% for plywood,
8% for particle boards, 10% for fiberboards, 67% for paper and 12% for paperboards compared to
17
the first half of 2009 .
Belarus is more of an exporter as the half of the sawnwood and particle boards, the majority of the
plywood production and one third of the paper and paperboards are exported. The products are
exported to more than 20 countries represented on Figure 13 by type of production. Depending on
the wood products, the destination countries vary. Most of the sawnwood products are exported to
Germany (32% of the export production), Belgium (24%), Lithuania (13%) and Netherlands (13%).
The majority of plywood goes to Russia (23%), Poland (20%) and Germany (17%). Roundwood is
mainly exported to Poland (69%); while most of the particle boards go to Russia (31%), Kazakhstan
(21%) and Uzbekistan (25%). Both Fibreboards and Paper and paperboards export productions are
mainly intended to Russia (respectively 62% and 79%)
According to the MCPFE, for the period 1990 to 2010, the number of employed people has increased
18
from 22,000 to 36,000. The percentage of male workers is 84% .
In recent years, the forest industry has been vastly discussed by politics. It has been seen as rather
undeveloped considering the vastness of the resources, the degree of processing is low, production
facilities are outdated and the investments for it are minor. The objective of the government is to
19
switch from a roundwood exporter status to a high value-added products one .
17
Belstat 2010
18
FOREST EUROPE, UNECE and FAO 2011, State of Europe’s Forests 2011. Status and Trends in Sustainable Forest
Management in Europe.
19
Gerasimov, Y. & Karjalainen, T., 2010. Atlas of the forest sector in Belarus. Working Papers of the Finnish Forest Research
Institute 170
SGS BELGIUM S.A. June 2017 16
Project No.: 130373GDF Suez- Electrabel Forest sustainability in Belarus
Figure 12 : Production trends, imports, and exports
Source : Belstat 2010, FAOSTAT 2010
SGS BELGIUM S.A. June 2017 17
Project No.: 130373GDF Suez- Electrabel Forest sustainability in Belarus
Figure 13 : Production export according to country in 2009
Source : Belstat 2010, FAOSTAT 2010
SGS BELGIUM S.A. June 2017 18
Project No.: 130373GDF Suez- Electrabel Forest sustainability in Belarus
3. Sustainability of Belarus forest
3.1. Evolution of forest area and risk of conversion
In 1887, the forest cover in Belarus occupied more than 40% of the territory. Between 1887 and
2008, the forest cover decreased with two minima in 1917 and 1945 before increasing until 2008 and
reaching 7.96 million ha (38% of the total country area) (Figure 14). In 2016, the cover reached
20
8,742,000 ha which consists in 42% of the country area .
Figure 14 : Development of forest cover in Belarus since 1887
Source : Gerasimov, Y. & Karjalainen, T., 2010. Atlas of the forest sector in Belarus.
According to the FAO, between 1990 and 2015 (Table 3):
- The Forest area has increased from 7.8 million ha to 8.6 million ha. The percentage of forest
cover increased from approximately 37% to approximately 42%.
- Other wood lands have increased from 491 thousand ha to 539.8 thousand ha.
- The annual change decrease from 49.3 for the period 1990 to 2000, to approximately 20%
for the period 2005 to 2015.
- The annual rate change decreases from 0.63% for the period 1990 to 2000, to 0.23% for the
period 2010 to 2015 and seems to stabilize.
Table 3 : Forest and other wooded land cover between 1990 and 2015
Area (000 ha) 1990 2000 2005 2010 2015
Forest 7780 8273 8436 8534 8633,5
Other wooded land 491 490 486 512,9 539,8
Total area 8271 8763 8922 9046,9 9173,3
Percentage of forested area 37,48% 39,85% 40,64% 41,11% 41,59%
Evolution of forest area / 493 163 98 99,5
(between period)
Annual change / 49,3 32,6 19,6 19,9
Annual rate change / 0,63% 0,39% 0,23% 0,23%
Source : FAO, Global Forest Resources Assessment 2015
20
Environmental protection in the Republic of Belarus, 2016. p.163.
SGS BELGIUM S.A. June 2017 19
Project No.: 130373GDF Suez- Electrabel Forest sustainability in Belarus
For the period between 1930 and 1950, wood harvesting exceeded its increment; it explains the low
values of the forest cover, compared to today’s values. From 1940 until 2010, the increment of
forests increased. From 1960, it exceeded the harvest, explaining the increasing forest area (Figure
15).
Figure 15 : Development of forest use in Belarus
Source : Gerasimov, Y. & Karjalainen, T., 2010. Atlas of the forest sector in Belarus.
The values of reforestation and afforestation in the recent years can be seen on Figure 16 and Table
4. The total reforestation and afforestation have been declining between 2010 and 2013 from an area
of 32,983 ha to a surface of 31,172 ha, followed by an increase until 2016 with an area of 37,179 ha.
Most of this reforestation and afforestation consists in forest planting and seeding oscillating between
80% and 84.9%. The other part consists in the assistance to natural forest regeneration and
21
preservation of undergrowth, it ranges from 15% to 21.6% . Through the data obtained by Baginsky
in 1997, we note that natural regeneration prevailed between 1922 and 1945 (85%) and 1945 and
1990 (65%) due to economic difficulties. It is from 1990 that the artificial regeneration has surpassed
22
the natural regeneration by increasing three times as much as this last .
Figure 16 : Reforestation and afforestation in Belarus
40000
assistance to natural
30000 forest regeneration and
Area (ha)
preservation of
20000 undergrowth
forest planting and
10000 seeding
0
2010 2011 2012 2013 2014 2015 2016
Source : Belstat 2017
21
Belstat 2017
22
Gerasimov, Y. & Karjalainen, T., 2010. Atlas of the forest sector in Belarus. Working Papers of the Finnish Forest Research
Institute 170. p. 17.
SGS BELGIUM S.A. June 2017 20
Project No.: 130373GDF Suez- Electrabel Forest sustainability in Belarus
Table 4 : Reforestation and afforestation between 2010 and 2016
Area (ha) 2010 2011 2012 2013 2014 2015 2016
Reforestation and afforestation 32983 30555 31172 30284 32374 33094 37179
of which:
forest planting and seeding 27695 25327 24742 23750 26247 26486 31576
assistance to natural forest
regeneration and preservation of 5288 5228 6430 6534 6127 6608 5603
undergrowth
Forest area biologically
protected against pest and 22731 22765 23673 35103 23904 22458 21640
diseases
Forest area chemically protected
292 1693 664 556 356 357 1367
against pests and diseases
Source : Belstat 2017
In Belarus, it is obligatory to reforest when a process of harvesting is met. It accomplished in order to
meet the attention towards ecological problems, the protection of biodiversity, gene fund and
23
improvement of the sustainability .
24
According to the FSC risk assessment platform , Belarus is considered low risk in relation to
conversion of forest to plantations or non-forest use, as there is no net loss and no significant rate of
loss (> 0.5% per year) of natural forests and other naturally wooded ecosystems such as savannahs
taking place in the eco-region in question.
3.2. Living wood volumes and removals
The growing stock corresponds to “the volume over bark of all living trees with a minimum diameter
of 10 cm at breast height (or above buttress if these are higher). It includes the stem from ground
25
level up to a top diameter of 0 cm, excluding branch” .
Table 5 presents the evolution of growing stock in Belarus between 1990 and 2015. According to the
FAO, the total growing stock has increased from 1,039.2 million m³ in 1990 to 1,669.3 million m³ in
2015. The evolution is constant through the years. Both the coniferous and the deciduous trees
increase. The coniferous growing stock increases from 807.8 million m³ to 1115.5 million m³, the
deciduous growing stock increases from 285.4 million m³ to 553.8 million m³. The percentage of
deciduous growing stock grows from 26.1% to 33.2%. The results for 2010 and 2015 were obtained
26
by a linear interpolation .
Table 5 : Growing stock between 1990 and 2015
Category 1990 2000 2005 2010 2015
Total growing stock 1093,2 1339,2 1434,8 1580 1669,3
… of which coniferous 807,8 906,2 955,1 1061 1115,5
23
Materials of the National Forest Certification System of the Republic of Belarus
24
http://www.globalforestregistry.org/
25
FAO, 2015. Global Forest Resources Assessment 2015, p.16.
26
FAO, 2015. Global Forest Resources Assessment 2015
SGS BELGIUM S.A. June 2017 21
Project No.: 130373GDF Suez- Electrabel Forest sustainability in Belarus
… of which deciduous 285,4 433 479,7 519 553,8
Source : FAO, Global Forest Resources Assessment 2015
The evolution of growing stock in Belarus from 1990 to 2015 according to the tree species can be
seen on Figure 17. We note a positive change of forested volume for the main species except for
Aspen. The common Pine, while dominating the other species, increases linearly from 611.1 million
m³ to 838.9 million m³. The common Birch also increases constantly. The Norways Spruce seems to
stagnate from 1990 to 2005 and sees its trend increasing from 2005 to 2010. The Aspen is the only
specie that undergoes a big decline, while common Alder faces a major growth between 2000 and
2005. The last five categories are rather stable for the entire period, presenting a small growth.
Figure 17 : Growing stock per tree specie
900
Common Pine
800
Volume (million m³)
700 Common Birch
600 Norways Spruce
500
400 Aspen
300 Common Alder
200
Pedunculate Oak
100
0 Grey (White) Alder
Common Ash
Source : FAO, Global Forest Resources Assessment 2015
Table 6 shows the evolution of forest felling area between 2000 and 2015. The area increases from
415,400 ha to 578,300 ha in 2011. It is followed by a decrease to 466,900 ha in 2015. The area
dedicated to final cutting grows from 20,400 ha in 2000 to 37,500 ha in 2014 and then declines to
31,300 ha in 2015. Nowadays, almost every clear felled hectare has been regenerated. A forest
27
enterprise belonging to the Ministry of Forestry is responsible for silviculture
Table 6 : Forest felling area between 2010 and 2015
Area (000 ha) 2000 2005 2010 2011 2012 2013 2014 2015
Forest felling area 415,4 441 462,4 578,3 545 535,3 523,9 466,9
… of which final cutting 20,4 25,1 25,4 28,9 28,1 30,5 37,5 31,3
Volume (million m³)
Marketable timber harvest by 10787 14109 15473 17670 18059 18521 19550 18473
all types of cutting
… of which final cutting 4303 5213 5863 6523 6522 7143 7786 7480
Source : Statistical yearbook of the Republic of Belarus 2016
In the recent years, the evolution of the felling volume increased by 81.2%, from a volume of 10,787
thousand m³ to 19,550 thousand m³ in 2014. This volume decreases to 18,473 thousand m³ in 2015.
27
Gerasimov, Y. & Karjalainen, T., 2010. Atlas of the forest sector in Belarus. Working Papers of the Finnish Forest Research
Institute 170. p. 16.
SGS BELGIUM S.A. June 2017 22
Project No.: 130373GDF Suez- Electrabel Forest sustainability in Belarus
The area of forest destruction categorized by the different causes can be seen on Table 7. The total
area of destruction varies each year depending on its situation. 2015 is the year with the most losses
compared to other years because of forest fire. 2010 faced adverse weather conditions that
destroyed 11.562 ha. Forests diseases are also important. The other factors contribute less to the
losses and are more stable. The forests are not permanently lost as there is reforestation.
Table 7 : Forest destruction area between 2010 and 2015
Area (ha) 2010 2011 2012 2013 2014 2015
damaged by insect pests / / / 2 24 8
damaged by wild animals 323 / 2 / 2 /
forest diseases 526 708 760 541 697 985
anthropogenic factors 3 3 / / 1 /
adverse weather conditions 11562 9345 8274 7145 7455 6446
excessive moisture 745 243 652 454 310 253
forest fires 343 269 160 79 105 5968
Total 13502 10568 9848 8221 8594 13660
Source : Environmental protection in the Republic of Belarus, 2016
3.3. Protection of ecosystems and biodiversity
The protected areas in Belarus called Specially Protected Natural Areas (SPNA) are organized as
follow:
1 nature reserve
4 national parks
85 nature sanctuaries (“zakaznik”) of national significance
267 nature sanctuaries (“zakaznik”) of local significance
306 nature monuments of national significance
568 nature monuments of local significance
The total area covered by these SPNA equals 1,811,600 ha, which corresponds to 8.8% of the total
country area in 2016. The main locations can be seen on Figure 18. The repartition of the territory
under protection is dominated by wildlife sanctuaries which cover 67.6% of the total protected area,
national parks represent 25.3%, the only natural reserve occupies 6.2% and nature landmarks
28
0.8% .
28
Krasovsky, D., 2015. Presentation: Republic of Belarus. Implementing criteria and indicators for sustainable forest
management
SGS BELGIUM S.A. June 2017 23
Project No.: 130373GDF Suez- Electrabel Forest sustainability in Belarus
Figure 18 : Specially Protected Areas
Source : http://www.minpriroda.gov.by/en/map_ohrana-en/
29
The nature reserve and national parks are defined by main characteristics :
- Berezinsky Biosphere reserve: Preservation of the natural reference and other valuable
natural complexes and features, study of flora and fauna, ecosystems and landscapes typical
and unique of the Eastern European mixed forest, creation of conditions to ensure the
conservation of natural processes. A distinctive feature of the reserve is a unique complex of
forest and wetland ecosystems that almost completely preserved their natural state.
- Polessky State Radiation and Ecological Reserve: Restricting public access to the areas
contaminated as a result of the disaster at the Chernobyl nuclear power plant, from which the
population was evacuated and resettled; radiation protection, prevention of the spread of
radionuclides, radiation monitoring, radio-ecological research, study of flora and fauna,
typical and unique ecosystems and landscapes, natural processes characteristic of Pripyat
Poles’e. The features of the reserve are the presence of high levels of environmental
pollution as a result of the disaster at the Chernobyl nuclear power plant, including
transuranic isotopes, restoration of the natural state of biogeocenoses as a result of removal
of anthropogenic load.
29
Environmental protection in the Republic of Belarus, 2016
SGS BELGIUM S.A. June 2017 24
Project No.: 130373GDF Suez- Electrabel Forest sustainability in Belarus
- Belovezhskaya Pushcha: Preservation in the natural state and comprehensive study of the
natural standard and unique features of the Bialowieza forest, biological and landscape
diversity of the area, restoration of damaged natural complexes and objects of special
ecological, historical, cultural and aesthetic value as well as their use for nature protection,
scientific, educational and recreational purposes.
- Braslavskie Ozera (Braslav Lakes): Preservation of the natural complex of Braslav Lakes as
a benchmark of natural landscapes, storage of genetic stock of the flora and fauna of
Belarusian Lake Land and its use for nature protection, scientific, educational, tourism and
recreational purposes.
- Pripyatsky: Preservation of the natural complex of the valley of the Pripyat river as a
benchmark of natural landscapes, storage of the genetic stock of flora and fauna of
Belarusian Polessye and its use for nature protection, scientific, educational, tourism and
recreational purposes.
- Narochansky: Preservation of unique natural complexes joined by Lake Narach as reference
landscapes, storage of genetic stock of the flora and fauna of Belarusian Lake Land and their
more complete and efficient use nature protection, scientific, educational, tourism and
recreational purposes.
The MCPFE has defined a quantitative indicator to assess the performances of the reporting
countries in terms of conservation of the forests’ protective functions. The classes are precisely
detailed in “MCPFE assessment guidelines for protected and protective forest and other wooded land
30
in Europe”. The classes are summarized in Table 8 .
Table 8 : Comparison of MCPFE classes of protected and protective forest and other wooded
land in Europe, forest management approaches (FMAs), and separated forest areas according
to the Triad zonation approach
Source : https://www.ecologyandsociety.org/vol17/iss4/art51/table3.html
The evolution of the areas in Belarus between 1990 and 2015 are presented in Table 9. For MCPFE
class 1.1, we note a stable situation between 200 and 2010, followed by an increase to 165.8
30
MCPFE assessment guidelines for protected and protective forest and other wooded land in Europe
http://www.unece.org/fileadmin/DAM/timber/publications/2002-guidelines-protected-forest.pdf
SGS BELGIUM S.A. June 2017 25
Project No.: 130373GDF Suez- Electrabel Forest sustainability in Belarus
thousand ha. The area of MCPFE class 1.2 increases from 133.2 thousand ha to 163.6 thousand ha
in 2015. MCPFE class 1.3 areas face an increase between 2000 and 2010, followed by a decrease to
467.9 thousand ha. MCPFE class 2 presents a variation in its areas for the whole period 1990-2015.
In 2015, its area is 600 thousand ha. MCPFE class 3 faces a big increase (the double) between 1990
and 2000, from 622.2 thousand ha to 1244.5 thousand ha. It continues to increase up to 1286.8
thousand ha in 2005. It is followed by a small decrease to 1257 thousand ha in 2010. Finally, it
31
increases again to its maximum in 2015 with 1343 thousand ha .
Table 9 : Area of forest protected, according to MCPFE Assessment Guidelines
Area (000 ha) 1990 2000 2005 2010 2015
MCPFE class 1.1 / 134.8 134.8 134.8 165.8
MCPFE class 1.2 / 133.2 134 137 163.6
MCPFE class 1.3 / 443.1 497.5 511.1 467.9
MCPFE class 2 / 628 649.4 545.6 600
MCPFE class 3 642 1289.3 1328.7 1288.5 1378
… for soil, water and other forest
622.2 1244.5 1286.8 1257 1343
ecosystem functions
…for infrastructure and managed
19.8 44.8 41.9 31.5 35
natural resources
Total / 2628.4 2744.4 2617 2775.3
Source : States of Europe’s Forests 2015
3.4. Protection of water
The MCPFE quantitative indicator focuses on soil and water (MCPFE class 3). It is based on the
surface of forest land specifically dedicated to protective functions, as defined by the following
32
criteria :
- The management is clearly directed to protect soil and its properties or water quality and
quantity or other forest ecosystem functions, or to protect infrastructure and managed natural
resources against natural hazards
- Forests and other wooded lands are explicitly designated to fulfil protective functions in
management plans or other legally authorised equivalents
- Any operation negatively affecting soil or water or the ability to protect other ecosystem
functions, or the ability to protect infrastructure and managed natural resources against
natural hazards is prevented
Table 10 : Area of forest dedicated to soil, water and other ecosystem functions (MCPFE
class 3)
Area (000 ha) 1990 2000 2005 2010 2015
Land dedicated to soil, water and
622,2 1244,5 1286,8 1257 1343
other forest ecosystem functions
Percentage of the forest area 8,0% 15,0% 15,3% 14,6% 15,6%
31
FOREST EUROPE, UNECE and FAO 2011, State of Europe’s Forests 2015. Status and Trends in Sustainable Forest
Management in Europe.
32
MCPFE assessment guidelines for protected and protective forest and other wooded land in Europe
http://www.unece.org/fileadmin/DAM/timber/publications/2002-guidelines-protected-forest.pdf
SGS BELGIUM S.A. June 2017 26
Project No.: 130373GDF Suez- Electrabel Forest sustainability in Belarus
Source : States of Europes Forests 2011
3.5. Protection of soils
As described in the previous section, the MCPFE (Ministerial Conference on the Protection of Forests
in Europe) has defined a quantitative indicator of to assess the performances of the reporting
countries in terms of conservation of the forests’ protective functions, especially regarding soil and
water (MCPFE class 3). The conservation areas are presented on Table 10.
3.6. Protection of carbon stocks
In forest land the carbon stocks mainly includes:
- living above ground and below ground woody biomass,
- carbon in deadwood,
- carbon in litter,
- soil organic carbon.
Table 11 presents the carbon stocks in forests. The total stock in 2015 equals 1,450.3 million t of
carbon. The highest contributor to this number is the living biomass, both above and below ground,
with 645, million t. The soil is the second contributor with 540.4 million t and deadwood and litter are
the third one with 264.4 million t. According to the expansion of the forest area and the increase of
the living wood volume, the carbon stocks grow as well.
Table 11 : Carbon stock in forests (million metric tonne)
Category 1990 2000 2005 2010 2015
Carbon in above ground biomass 296 369,7 414,5 468,4 495,1
Carbon in below ground biomass 89,6 111,9 125,9 142,3 150,4
Total living biomass 385,6 481,6 540,4 610,7 645,5
Carbon in deadwood 1,9 2,7 2,9 3,1 3,3
Carbon in litter 222,6 236,7 241,3 247 261,1
Total deadwood and litter 224,5 239,4 244,2 250,1 264,4
Soil carbon 460,8 490,2 499,8 511,3 540,4
Total 1070,9 1211,2 1284,4 1372,1 1450,3
Source : FAO, Global Forest Resources Assessment 2015
Carbon emission and removals are shown on Table 12. The land use, land use change and forestry
(LULUCF) is considered as a carbon sink for Belarus. Most of this sink consists in the forest carbon
sink, which is calculated from the variations in carbon stocks and the emissions from drained organic
soils. This sink is rather stable in time. In 2013, it represents 31% of the total greenhouse gas
emissions for the whole country.
Table 12 : Carbon emission and removal (kt CO2 eq)
Category 1990 2000 2010 2011 2012 2013
Total GHG emission including
indirect CO2 emissions 151124,53 85997,43 98403,57 99045,61 98029,52 100262,9
excluding LULUCF
SGS BELGIUM S.A. June 2017 27
Project No.: 130373GDF Suez- Electrabel Forest sustainability in Belarus
Total GHG emission including
indirect CO2 emissions including 126741,15 59752,01 73357,33 76137,93 80943,96 78527,62
LULUCF
Carbon sink from LULUCF -24383,38 -26245,42 -25046,24 -22907,68 -17085,6 -21735,3
Carbon sink for the forests -30013,4 -32451,2 -31686,4 -31685,6 -31443,8 -31019,2
Source : Report on the individual review of the inventory submission of Belarus submitted in 2015 & Submission of information
on the forest management reference level.
3.7. Protection of air quality
Concerning forests, the main impact on air quality relates to fire. It includes wild fire (which are
unintended).
The total number of fire in Belarus varies in time but reached a maximum in 2015 (Table 13 and
33
Figure 19). The total number of fire in 2016 was 319 and its cover was 251 ha . The number of
forest fires in 2015 was 1218 and affected a total of 13,876 ha. The great majority of affected area
(11,990 ha of the total affected area) was in the Gomel region, which is the one near the Ukrainian
34
border .
Table 13 : Forest fires
Category 2010 2011 2012 2013 2014 2015 2016
Number of forest fires 607 433 544 272 687 1218 319
Forest area affected by fires (ha) 423 152 176 72 345 13876 251
Standing timber burnt and 2165 4197 7675 1572 13735 398496 /
damaged (m³)
Forest fire control with the aid of 9367 9364 9375 9410 9420 9461
/
aviation (000 ha)
33
Belstat 2017
34
Environmental protection in the Republic of Belarus, Statistical book. p.200
SGS BELGIUM S.A. June 2017 28
Project No.: 130373GDF Suez- Electrabel Forest sustainability in Belarus
Source : Environmental protection in the Republic of Belarus 2016
Figure 19 : Number of forest fires and forest area affected by fires
Source : http://www.minpriroda.gov.by/en/map_ohrana-en/
This massive number of forest fires raises another problem for the air. The interaction between
radioactive elements from the Chernobyl disaster of 1986 and extreme fire events is analysed.
137
According to the paper, a large amount of Cs remains in the forests near the Ukrainian border
(Figure 6). Litter carbon has doubled in the area as the tree mortality has increased and the
decomposition rates have decreased, this provides fuel for wildfires increasing the chance of extreme
fire events. Fires could create cloud charged with the radioactive element could rise and move over
35
the area contaminating other regions .
The totality of the Forest Fund area is considered under forest fire control. A network of means of
visual observation of the forest has been developed for the discovery of forest fires. A closed system
of electronic document flow is used for the exchange of information on fire danger and fires. For
operative organization of work in extinguishing of forest fires and for other production goals, a system
36
of emergence and technical radio connection in the sector has been set up .
3.8. Illegal logging
According to the WWF, illegal logging is proven but the scale is unknown. The suspected quantity of
wood is estimated to 1.5 million m³ (it is based on the imported wood-based products in the European
Union). The repartition of the imported products is estimated to 36% of roundwood, 30% of
35
Evangeliou, N., Balkanski, Y., Cozic, A., Hao, W. M., Mouillot, F., Thonicke, K., Paugam, R., Zibtsev, S., Mousseau, T. A.,
Wang, R., Poulter, B., Petkov, A., Yue, C., Cadule, P., Koffi, B., Kaiser, J. W. and Møller, A. P. (2015), Fire evolution in the
radioactive forests of Ukraine and Belarus: future risks for the population and the environment. Ecological Monographs, 85:
49–72. doi:10.1890/14-1227.1
36
Material of the National Forest Certification System of the Republic of Belarus
SGS BELGIUM S.A. June 2017 29
Project No.: 130373You can also read