IMBIO CT LUNG DENSITY ANALYSIS USER MANUAL - LUNG DENSITY ANALYSIS v3.1.0 - SOFTWARE USER MANUAL
←
→
Page content transcription
If your browser does not render page correctly, please read the page content below
IMBIO CT LUNG DENSITY ANALYSIS™ USER MANUAL

                                               LUNG DENSITY ANALYSIS™
                                                          v3.1.0
Imbio Document Number: UM-36 v1.0

                                    P. 1            SOFTWARE USER MANUAL   UM-36 v1.0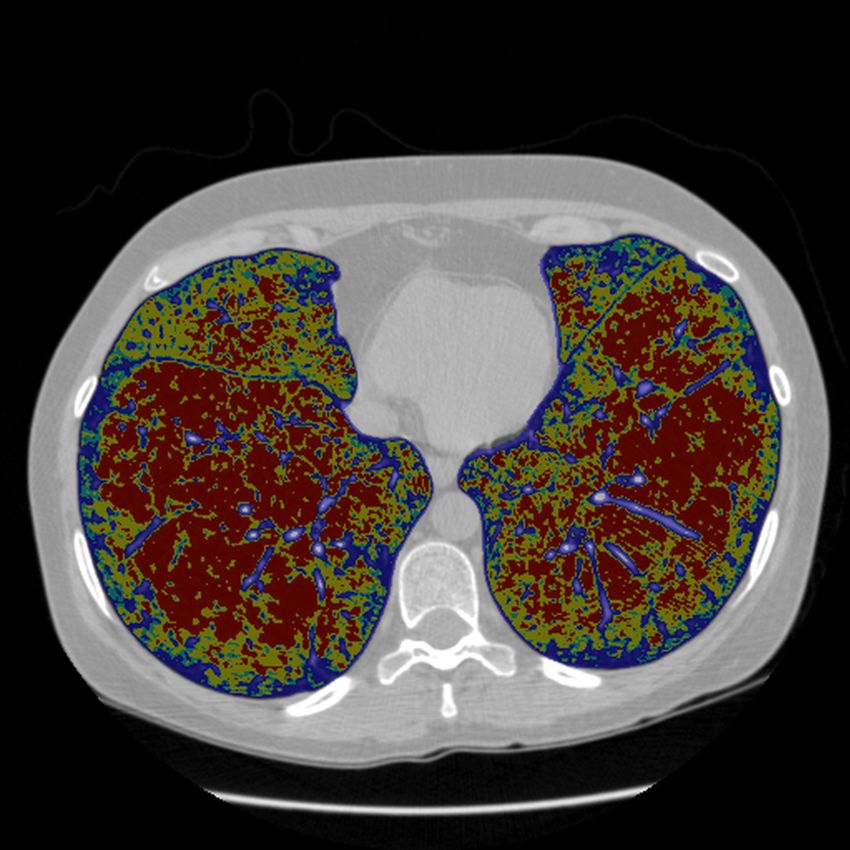
IMBIO CT LUNG DENSITY ANALYSIS™ USER MANUAL
CONTENTS

       Contents
       1 Introduction                                                                                                                                                               4
         1.1 Scope of Manual . . . . . . . . . . . . . . . . . . . . . . . . . . . . . . . . . . . . . . . .                                                                        4
         1.2 Product Overview . . . . . . . . . . . . . . . . . . . . . . . . . . . . . . . . . . . . . . .                                                                         4
         1.3 Contact Imbio . . . . . . . . . . . . . . . . . . . . . . . . . . . . . . . . . . . . . . . . .                                                                        5

       2 Indications for Use and Requirements                                                                                                                                       6
         2.1 Intended Users . . . . . . . . . . . . . . . . . . . . . . . . .                                          .   .   .   .   .   .   .   .   .   .   .   .   .   .   .    6
         2.2 Scan Protocol Requirements . . . . . . . . . . . . . . . . . .                                            .   .   .   .   .   .   .   .   .   .   .   .   .   .   .    6
             2.2.1 Imbio Acquisition Parameters . . . . . . . . . . . . .                                              .   .   .   .   .   .   .   .   .   .   .   .   .   .   .    6
             2.2.2 Imbio Recommended Protocol . . . . . . . . . . . . .                                                .   .   .   .   .   .   .   .   .   .   .   .   .   .   .    8
             2.2.3 Imbio Recommended Protocol for Low-dose Images                                                      .   .   .   .   .   .   .   .   .   .   .   .   .   .   .    9
             2.2.4 Breathing Instructions . . . . . . . . . . . . . . . . .                                            .   .   .   .   .   .   .   .   .   .   .   .   .   .   .   10

       3 Quality Assessment                                                                                                                                                        11
         3.1 Scan Quality . . . . . . . . . . . . . . . . . . . . . . . . . . . . . . . . . . . . . . . . . .                                                                      11
         3.2 Contraindications . . . . . . . . . . . . . . . . . . . . . . . . . . . . . . . . . . . . . . .                                                                       11

       4 Components                                                                                                                                                                13
         4.1 Functional Assessment . . . . . . . . . . . . . . . . . . . . . . . . . .                                                     .   .   .   .   .   .   .   .   .   .   13
         4.2 Inspiration Assessment . . . . . . . . . . . . . . . . . . . . . . . . . .                                                    .   .   .   .   .   .   .   .   .   .   13
         4.3 Optional Features . . . . . . . . . . . . . . . . . . . . . . . . . . . . .                                                   .   .   .   .   .   .   .   .   .   .   13
             4.3.1 Filtering . . . . . . . . . . . . . . . . . . . . . . . . . . . . . . .                                                 .   .   .   .   .   .   .   .   .   .   14
             4.3.2 Adjustable Thresholds . . . . . . . . . . . . . . . . . . . . . . .                                                     .   .   .   .   .   .   .   .   .   .   14
             4.3.3 Report Format . . . . . . . . . . . . . . . . . . . . . . . . . . .                                                     .   .   .   .   .   .   .   .   .   .   14
             4.3.4 Institution Logo . . . . . . . . . . . . . . . . . . . . . . . . . .                                                    .   .   .   .   .   .   .   .   .   .   15
             4.3.5 Multiple Thresholds (Insp. Assessment Feature Only) . . . .                                                             .   .   .   .   .   .   .   .   .   .   15
             4.3.6 Adjustable Percentile (Insp. Assessment Feature Only) . . .                                                             .   .   .   .   .   .   .   .   .   .   16
             4.3.7 Additional LungMap Report (Insp. Assessment Feature Only)                                                               .   .   .   .   .   .   .   .   .   .   16

       5 Functional Assessment                                                                                                                                                     17
         5.1 Inputs . . . . . . . . .    . . . .   .   .   .   .   .   .   .   .   .   .   .   .   .   .   .   .   .   .   .   .   .   .   .   .   .   .   .   .   .   .   .   .   17
         5.2 Functional Assessment       Map .     .   .   .   .   .   .   .   .   .   .   .   .   .   .   .   .   .   .   .   .   .   .   .   .   .   .   .   .   .   .   .   .   17
         5.3 Segmentation Map . .        . . . .   .   .   .   .   .   .   .   .   .   .   .   .   .   .   .   .   .   .   .   .   .   .   .   .   .   .   .   .   .   .   .   .   18
         5.4 Registration Map . . .      . . . .   .   .   .   .   .   .   .   .   .   .   .   .   .   .   .   .   .   .   .   .   .   .   .   .   .   .   .   .   .   .   .   .   19
         5.5 Functional Assessment       Report    .   .   .   .   .   .   .   .   .   .   .   .   .   .   .   .   .   .   .   .   .   .   .   .   .   .   .   .   .   .   .   .   20

       6 Inspiration Assessment                                                                                                                                                    22
         6.1 Inputs . . . . . . . . . . . . . .        .   .   .   .   .   .   .   .   .   .   .   .   .   .   .   .   .   .   .   .   .   .   .   .   .   .   .   .   .   .   .   22
         6.2 Inspiration Assessment Map . .            .   .   .   .   .   .   .   .   .   .   .   .   .   .   .   .   .   .   .   .   .   .   .   .   .   .   .   .   .   .   .   22
         6.3 Segmentation Map . . . . . . .            .   .   .   .   .   .   .   .   .   .   .   .   .   .   .   .   .   .   .   .   .   .   .   .   .   .   .   .   .   .   .   23
         6.4 Inspiration Assessment Report             .   .   .   .   .   .   .   .   .   .   .   .   .   .   .   .   .   .   .   .   .   .   .   .   .   .   .   .   .   .   .   23
         6.5 LungMap™ Report . . . . . . .             .   .   .   .   .   .   .   .   .   .   .   .   .   .   .   .   .   .   .   .   .   .   .   .   .   .   .   .   .   .   .   26

       7 Possible Encountered Exceptions                                                                                                                                           30
         7.1 Input Errors . . . . . . . . . . . . . . . . . . . . . . . . . . . . . . . . . . . . . . . . . .                                                                      30
         7.2 Segmentation Errors . . . . . . . . . . . . . . . . . . . . . . . . . . . . . . . . . . . . .                                                                         30
         7.3 Registration Errors . . . . . . . . . . . . . . . . . . . . . . . . . . . . . . . . . . . . . .                                                                       32

P. 2                                                                                                                                                                           UM-36 v1.0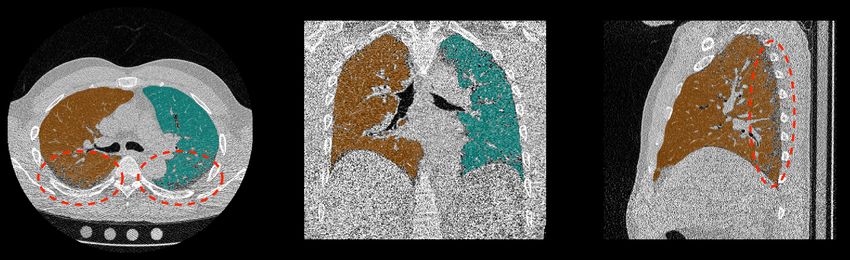
IMBIO CT LUNG DENSITY ANALYSIS™ USER MANUAL
CONTENTS

       8 Considerations to Reduce Risk                                                                                                                        33
         8.1 Protocol . . . . . . . . . . . . . . . . . . . . .   .   .   .   .   .   .   .   .   .   .   .   .   .   .   .   .   .   .   .   .   .   .   .   33
         8.2 Expected Performance . . . . . . . . . . . . .       .   .   .   .   .   .   .   .   .   .   .   .   .   .   .   .   .   .   .   .   .   .   .   33
         8.3 Lung Segmentation Quality Assessment . . .           .   .   .   .   .   .   .   .   .   .   .   .   .   .   .   .   .   .   .   .   .   .   .   33
             8.3.1 Introduction . . . . . . . . . . . . . . .     .   .   .   .   .   .   .   .   .   .   .   .   .   .   .   .   .   .   .   .   .   .   .   33
             8.3.2 Examples of Lung Segmentation Errors           .   .   .   .   .   .   .   .   .   .   .   .   .   .   .   .   .   .   .   .   .   .   .   36
         8.4 Lobe Segmentation Quality Assessment . . .           .   .   .   .   .   .   .   .   .   .   .   .   .   .   .   .   .   .   .   .   .   .   .   38
             8.4.1 Introduction . . . . . . . . . . . . . . .     .   .   .   .   .   .   .   .   .   .   .   .   .   .   .   .   .   .   .   .   .   .   .   38
             8.4.2 Examples of Lobe Segmentation Errors           .   .   .   .   .   .   .   .   .   .   .   .   .   .   .   .   .   .   .   .   .   .   .   39
         8.5 Image Registration Quality Assessment . . .          .   .   .   .   .   .   .   .   .   .   .   .   .   .   .   .   .   .   .   .   .   .   .   41
             8.5.1 Introduction . . . . . . . . . . . . . . .     .   .   .   .   .   .   .   .   .   .   .   .   .   .   .   .   .   .   .   .   .   .   .   41
             8.5.2 Examples of Registration Errors . . . .        .   .   .   .   .   .   .   .   .   .   .   .   .   .   .   .   .   .   .   .   .   .   .   41
             8.5.3 Examples of Acceptable Registrations .         .   .   .   .   .   .   .   .   .   .   .   .   .   .   .   .   .   .   .   .   .   .   .   47

       9 Unique Device Identification                                                                                                                         50
         9.1 Overview . . . . . . . . . . . . . . . . . . . . . . . . . . . . . . . . . . . . . . . . . . . .                                                 50
         9.2 Printing the Label . . . . . . . . . . . . . . . . . . . . . . . . . . . . . . . . . . . . . . .                                                 50

       10Software Label                                                                                                                                       51

       11References                                                                                                                                           52

P. 3                                                                                                                                                      UM-36 v1.0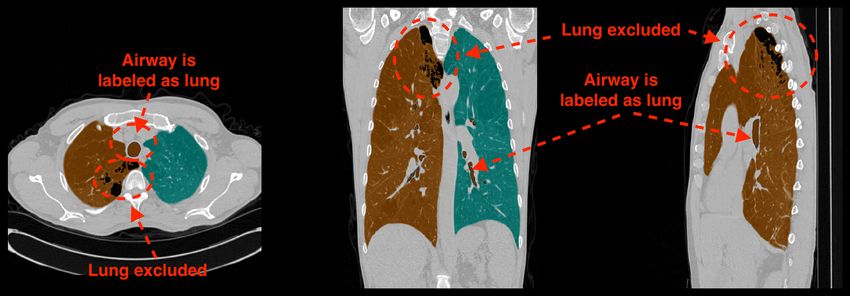
IMBIO CT LUNG DENSITY ANALYSIS™ USER MANUAL
1_INTRODUCTION

       1     Introduction
       1.1    Scope of Manual
       This user manual was written for the Imbio CT Lung Density Analysis™ (LDA)
       Software. Guidance for using the Imbio Core Computing Platform (CCP) is not
       included in this document.

       The Imbio CCP includes a cloud platform which is a subscription-based, scalable
       software-as-a-service product which allows customers to run computationally-
       intensive image algorithms in the cloud, on infrastructure maintained by Imbio.
       The Imbio CCP is also available as an on-premise hosted product, targeted at
       those organizations which desire to keep their image data in-house. This enter-
       prise version of CCP provides a system by which customers can still benefit from
       image processing job automation, while integrating with native DICOM tools and
       workflows. The Imbio CCP with cloud and enterprise options is a separate product
       developed by Imbio.

       1.2    Product Overview
       Imbio's CT Lung Density Analysis™ Software is a set of image post-processing al-
       gorithms designed to help radiologists and pulmonologists determine the location
       and extent of tissue damage in patients with COPD, by providing visualization and
       quantification of areas with abnormal CT tissue density. The LDA Software runs
       automatically on the input CT series, with no user input or intervention. The LDA
       Software consists of the Functional Assessment and the Inspiration Assessment.

       The Imbio CT Lung Density Analysis™ Functional Assessment performs image seg-
       mentation, registration, thresholding, and classification on CT images of human
       lungs. The Functional Assessment performs the four algorithms sequentially on
       two CT scans (inspiration and expiration lung datasets).

       The purpose of the segmentation algorithm is to automatically identify and sepa-
       rate the two lungs from the rest of the body. An optional feature of the segmenta-
       tion algorithm is the ability to label the individual lobes of the lungs. The purpose
       of the registration algorithm is to map one lung image onto another, so that a
       pairwise mapping comparison between lung images can be done. The purpose of
       the thresholding algorithm is to identify voxels above and below a given threshold
       for the inspiration series and to identify voxels above and below a given threshold
       for the expiration series. The purpose of the classification algorithm is to compare
       inspiration and expiration lung images that have been registered and have gone
       through thresholding. Further description of this component is in the Functional
       Assessment section of the document (Section 4.1).

P. 4                                                                                UM-36 v1.0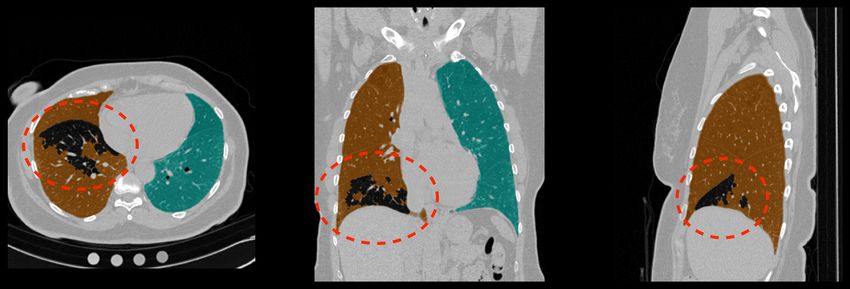
IMBIO CT LUNG DENSITY ANALYSIS™ USER MANUAL
1_INTRODUCTION

       The Imbio CT Lung Density Analysis™ Inspiration Assessment is a component for
       users who only acquire inspiration datasets. The Inspiration Assessment performs
       image segmentation and thresholding on an inspiration CT scan. Volumetric per-
       centages of the lung tissue below the user configurable threshold are calculated.
       Further description of this component is in the Inspiration Assessment section of
       the document (Section 4.2).

       The Imbio CT Lung Density Analysis™ Software utilizes DICOM format high reso-
       lution CT lung inspiration and expiration data sets as input to the software. The
       specific requirements are given in the Scan Protocol section of this document (Sec-
       tion 2.2).

       The output provided by the Imbio CT Lung Density Analysis™ Software is a RGB
       lung image series in DICOM format and a DICOM summary report (Encapsulated-
       PDF SOPClass or Secondary Capture Image Storage SOPClass).

       1.3   Contact Imbio
                  Imbio LLC
                  1015 Glenwood Avenue
                  Minneapolis, MN 55405
                  United States
                  www.imbio.com

P. 5                                                                              UM-36 v1.0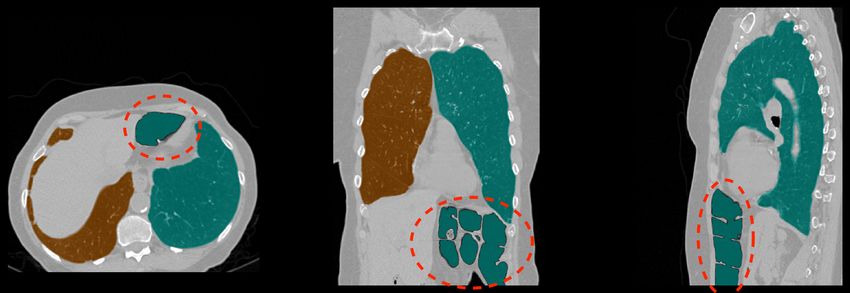
IMBIO CT LUNG DENSITY ANALYSIS™ USER MANUAL
2_INDICATIONS FOR USE AND REQUIREMENTS

       2     Indications for Use and Requirements
       The Imbio CT Lung Density Analysis™ Software provides reproducible CT values
       for pulmonary tissue, which is essential for providing quantitative support for di-
       agnosis and follow up examinations. The Imbio CT Lung Density Analysis™ Soft-
       ware can be used to support the physician in the diagnosis and documentation of
       pulmonary tissue images (e.g., abnormalities) from CT thoracic datasets. Three-
       D segmentation and isolation of sub-compartments, volumetric analysis, density
       evaluations, and reporting tools are provided.

       2.1     Intended Users
       The intended user base for the Imbio CT Lung Density Analysis™ Software is
       Pulmonologists, Radiologists, and Radiology Technicians under the supervision of
       a Pulmonologist or Radiologist.

       2.2     Scan Protocol Requirements
       The ability to segment and register the scans is dependent on the resolution of
       the scan; therefore, it is important to analyze the scan resolution. The resolution
       can be determined by assessing the acquisition protocols from the DICOM data
       as well as visually assessing the images themselves. The DICOM data provides
       information on the basic acquisition parameters used and can be compared with
       Imbio's required parameters. The scan should also be visually assessed to ensure
       that there are not contraindications or missing information.

       2.2.1   Imbio Acquisition Parameters

       The Imbio CT Lung Density Analysis™ Software will not generate outputs for scans
       with acquisition parameters that do not meet the requirements as outlined in the
       Table 1 below. In addition, Imbio CT Lung Density Analysis™ Software will not gen-
       erate outputs unless DICOM Patient Image Orientation (DICOM tag 0020,0037)
       can be rounded to [+/-1,0,0,0,+/-1,0].

P. 6                                                                              UM-36 v1.0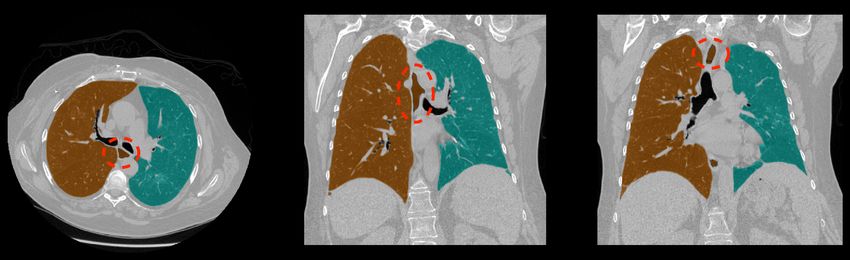
IMBIO CT LUNG DENSITY ANALYSIS™ USER MANUAL
2_INDICATIONS FOR USE AND REQUIREMENTS

        DICOM Tag              Name                             Required Value
        (0008,0060)            Modality                         CT
        (0028,0030)            Pixel Spacing                    ≤ 2.0 x 2.0 mm2
        (0018,9305)            Revolution Time                  ≤ 1.0 s (if present)
        N/A                    Slice Spacing                    ≤ 2.5 mm
        (0018,0050)            Slice Thickness                  ≤ 2.5 mm
        N/A                    Field of View                    ≥ 10.0 x 10.0 x 20.0 cm3
        N/A                    Number of Slices                 ≤ 1024
        (0010,1010)*           Patient's Age                    ≥ 18 (if present)
        (0028,1054)            Rescale Type                     HU (if present)
                               Table 1: Required CT Scan Parameters

       * Patient's Age will be calculated from PatientBirthDate (0010,0030) and StudyDate (0008,0020)
       if (0010,1010) is not populated.

       Recommended Convolution Kernels
       Imbio recommends using only inputs of images reconstructed with non-edge en-
       hancing kernels. Sharp kernels are not appropriate for Imbio CT Lung Density
       Analysis™ Software. Below is a list of kernels that are acceptable for use.

          GE: standard
          PHILIPS: B
          TOSHIBA: FC01
          SIEMENS: B31f, B35f, Qr40, Qr40d, Br40, Br40d

       Below is a list of kernels that are not recommended for Imbio CT Lung Density
       Analysis™ Software. If an image with a kernel in the following list (or not in the
       list of approved kernels) is passed to the software, the analysis will run but a
       warning will be issued and displayed in the report footer.

         GE: bone, bone+, edge, lung
         PHILIPS: D
         TOSHIBA: FC30, FC31, FC50, FC51, FC52, FC53, FC54, FC55, FC56, FC57,
       FC58, FC59, FC80, FC81, FC82
         SIEMENS: Kernels belonging to the ‘Head’ family (e.g. H31f), vascular or
            pediatric groups (e.g. Bp31f, e.g. Bv31f), or having sharpness greater
            than or equal to 60 (e.g. B60f).

P. 7                                                                                         UM-36 v1.0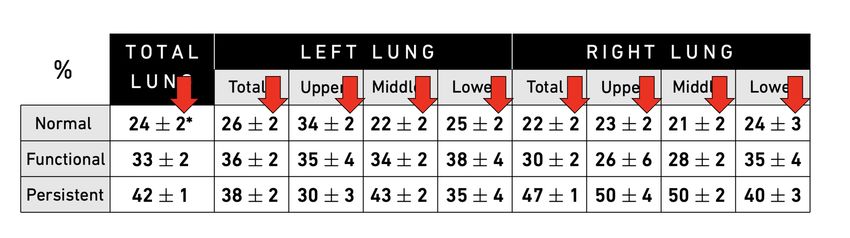
IMBIO CT LUNG DENSITY ANALYSIS™ USER MANUAL
2_INDICATIONS FOR USE AND REQUIREMENTS

       2.2.2   Imbio Recommended Protocol

       For the Imbio CT Lung Density Analysis™ Software, Imbio recommends a 3D vol-
       umetric acquisition with pixel spacing less than 1 mm and slice thickness less
       than 2.5 mm for both inspiration and expiration scans. The images should be re-
       constructed with a soft tissue/smoothing algorithm without high spatial frequency
       enhancement. Imbio Lung Density Analysis™ Imbio does not recommend a con-
       trast enhanced acquisition. Example protocols are listed in the table below. The
       protocols accepted by Imbio CT LDA Software are not limited to the scanners and
       protocols in Table 2, but the acquisition parameters should be similar. Failure
       to observe the recommended scan protocol could limit the software's ability to
       properly segment and register lungs.

        Scanner Make            GE                    SIEMENS                       PHILIPS 64
        Scanner Model           VCT 64                Sensation-64                  64 Slice
        Scan Type               VCT Helical           Spiral                        Axial Helix
        Rotation Time (S)       See mA                0.5                           0.5
        Det.                    64 x 0.625            64 x 0.6                      64 x 0.625
        Configuration
        Pitch                   1.375                 1.1                           0.923
        Speed (mm/rot)          13.75                 21.1                          0.5
        kVp                     120                   120                           120
        mA                      400 @ 0.5s (Ins)      Effective mAs: 200 (Ins)      200 mAs (Ins)
                                100 @ 0.5s (Exp)      Effective mAs: 50 (Exp)       50 mAs (Exp)
        Dose modulation         Off                   CARE Dose 4D Off              Off
        Reconstruction
        Algorithm               Standard              B31f                          B
        Thickness (mm)          0.625                 0.75                          0.9
        Interval (mm)           0.625                 0.5                           0.45
        DFOV(cm)                Lungs*                Lungs*                        Lungs*

                      Table 2: Recommended protocol for full-dose CT scans

       *Reconstruction field of view should encompass the widest diameter of the lung.

P. 8                                                                                         UM-36 v1.0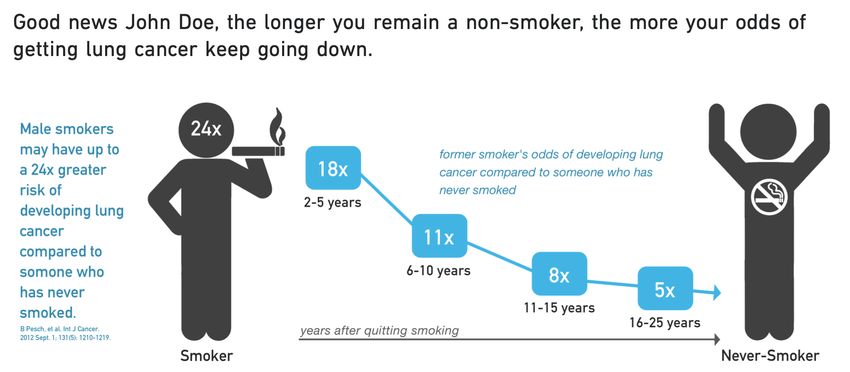
IMBIO CT LUNG DENSITY ANALYSIS™ USER MANUAL
2_INDICATIONS FOR USE AND REQUIREMENTS

       2.2.3    Imbio Recommended Protocol for Low-dose Images

       Due to increased image noise, it is especially important that images from low-
       dose CT scans should be reconstructed using a soft tissue/smoothing kernel OR
       an iterative reconstruction algorithm. If available, fully iterative reconstructions
       should be used with the Imbio post-processing filter turned OFF. If iterative re-
       constructions are not available, the post-processing filter should be turned ON to
       reduce the effects of noise on LDA measures. For more information on Imbio's
       post-processing filter, see section 4.3.1. An example low-dose protocol is shown
       in the Table 3 below. Please note that the software operator should be familiar
       with the effects of x-ray dose and slice-thickness on LDA measurements.

        Scanner Make           GE                       SIEMENS                        PHILIPS 64
        Scanner Model          VCT 64                   Sensation-64                   64 Slice
        Scan Type              VCT Helical              Spiral                         Axial Helix
        Rotation Time (S)      See mA                   0.5                            0.5
        Det.                   64 x 0.625               64 x 0.6                       64 x 0.625
        Configuration
        Pitch                  1.375                    1.1                       0.923
        Speed (mm/rot)         13.75                    21.1                      0.5
        kVp                    120                      120                       120
        mA                     80-160 @ 0.5s (Ins)      Effective mAs: 40-80 (Ins)40-80 mAs (Ins)
                               100 @ 0.5s (Exp)         Effective mAs: 50 (Exp) 50 mAs (Exp)
        Dose modulation        On                       On                        On
        Reconstruction
        Algorithm              Standard*                B31f*                          B*
        Thickness (mm)         2-3                      2-3                            2-3
        Interval (mm)          2                        2                              2
        DFOV(cm)               Lungs‡                   Lungs‡                         Lungs‡

                      Table 3: Recommended protocol for low-dose CT scans

       *Fully iterative reconstructions are recommended if available. Otherwise, LDA should be run with
       the "Filter-ON" option to reduce the impact of quantum noise.
       ‡ Reconstruction field of view should encompass the widest diameter of the lung.

P. 9                                                                                          UM-36 v1.0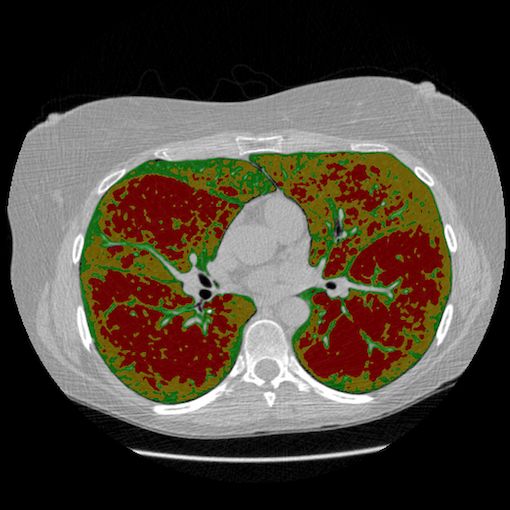
IMBIO CT LUNG DENSITY ANALYSIS™ USER MANUAL
2_INDICATIONS FOR USE AND REQUIREMENTS

    2.2.4   Breathing Instructions

    The patient should be coached to achieve and hold full inspiration, with several
    practice attempts prior to scan acquisition. If the patient is unable to hold their
    breath for the scan period, such as the case for a severely ill patient, a faster
    scanner needs to be utilized. The scan protocol remains the same for expiratory
    scanning. The patient should be coached for full expiration holds and be capable
    of retaining the hold for the duration of the scan. Below is a suggested script of
    how to coach a patient for the inspiratory and expiratory scans.

    Breathing Instructions Script
    Inspiratory CT
    For the first part of this scan, I am going to ask you to take a deep breath in and
    hold it
    First let's practice:
       Take a deep breath in
       Hold it - do not breathe
       Breathe and relax
    Take a deep breath in
       Let it out
    Take a deep breath in
       Let it out
    Breath all the way IN...IN...IN...
       Keep holding your breath - DO NOT BREATHE!
       At end of scan: Breathe and relax
    Start scan at bottom of lungs; end at top of lungs

    Expiratory CT
    For the second part of this scan, I am going to ask you to breathe out and hold it
    out.
    First let's practice:
       Take a deep breath in
       Breath out and hold it - do not breathe
       Breathe and relax
    Take a deep breath in
       Let it out
    Take a deep breath in
       Let it out
    Take another deep breath in
       Let it out and hold it out
       Keep holding your breath - DO NOT BREATHE!
       At end of scan: Breathe and relax
    Start scan at bottom of lungs; end at top of lungs

P. 10                                                                          UM-36 v1.0
IMBIO CT LUNG DENSITY ANALYSIS™ USER MANUAL
3_QUALITY ASSESSMENT
3 Quality Assessment
The scan quality and possible contraindications must be assessed before executing
the Imbio CT Lung Density Analysis™ Software.
3.1 Scan Quality
Lung density values from a CT scan may vary due to different acquisition param-
eters thus causing variation in LDA results. Sources of variation include but are
not limited to dose, reconstruction kernel, slice thickness, scanner calibration and
respiratory cycle. Users should not compare LDA results across acquisitions with
different acquisition parameters.
Refer to Table 4 for scan quality issues that may generate errors:
Scan Quality Component Result
Noise The airway segmentation in a noisy scan may fail if the lung
tissue is not distinguishable from other tissue.
Missing slices If slices within the tissue containing lung are missing, the
resultant Lung Density Analysis™ map and report could be
inaccurate.
Entire lung not included If scan does not fully contain the lungs, segmentation of the
lungs will fail.
Intubation If the patient is intubated during the scan, the lung segmen-
tation will fail.
Motion Artifact If the patient does not execute a full breath hold and/or
moves during the scan, motion artifacts may be present in
the scan that will cause segmentation and/or registration to
fail or affect the classification results.
Table 4: Potential causes of image processing and analysis failures
3.2 Contraindications
This software is designed to run on any input data that satisfies the criteria in
Section 2.2.1 and does not perform any additional quality checking. It is the re-
sponsibility of the medical professional who is using the application (i.e.,
the Radiologist, Pulmonologist or Radiology Technologist) to ensure that
the input data is of adequate quality. If the input data is not of adequate
quality, the application's results should be disregarded. Imbio's CT Lung Density
Analysis™ Software is not intended for use as a primary tool for disease detection
and/or diagnosis.
P. 11 UM-36 v1.0IMBIO CT LUNG DENSITY ANALYSIS™ USER MANUAL
3_QUALITY ASSESSMENT
Areas of the lung where comorbidities or anomalous pathologies are present may
give unpredictable results, and the Lung Density Analysis™ results should be in-
terpreted with a knowledge of the location and extent of any comorbidities or
anomalous pathologies.
Lung Density Analysis™ was designed and validated on adult lungs and has not
been validated on children. The software is not cleared by the FDA for use in a
pediatric setting.
P. 12 UM-36 v1.0IMBIO CT LUNG DENSITY ANALYSIS™ USER MANUAL
4_COMPONENTS
4 Components
The Imbio CT Lung Density Analysis™ Software has two components for process-
ing data, the Functional Assessment and the Inspiration Assessment. Output Re-
ports and Assessment Maps generated by Imbio CT Lung Density Analysis™ Soft-
ware are DICOM compatible.
NOTE: The outputs from each component of Imbio CT LDA Software have the fol-
lowing DICOM tags populated according to the Coordinated Universal Time (UTC):
DICOM Tag Name
(0008,0021) Series Date
(0008,0023) Content Date
(0008,0031) Series Time
(0008,0033) Content Time
(0040,a032) Observation Date Time
4.1 Functional Assessment
The Functional Assessment takes two CT scans as input, an inspiration and an
expiration scan. The process performs segmentation on both images and then
registers the inspiration image to the expiration. Thresholding is applied to the
images and then each voxel pair is classified. The process outputs an RGB image
with color overlay classifying each lung voxel as either "Normal", "Functional Low
Density Area" or "Persistent Low Density Area". In addition, a Functional Assess-
ment Report is generated summarizing results, for more details see Section 5.5.
4.2 Inspiration Assessment
The Inspiration Assessment takes one CT scan as input, a full inspiration scan. The
process performs segmentation on the inspiration image and then thresholding.
The output image is an RGB image with color overlay classifying lung voxels above
and below the inhalation threshold. In addition, a report is generated summarizing
results.
4.3 Optional Features
Both Functional Assessment and Inspiration Assessment have the following addi-
tional features for processing; filtering, adjustable thresholding, selectable report
format and personalizing report with an institution logo.
Inspiration Assessment has two optional features not available for Functional As-
sessment: adjustable percentile and an additional LungMap™ report.
P. 13 UM-36 v1.0IMBIO CT LUNG DENSITY ANALYSIS™ USER MANUAL
4_COMPONENTS
Both Functional and Inspiration Assessment have the option of labeling and
computing lung density statistics on the upper right, middle right, lower right,
upper left, and lower left lung lobes. Alternatively, Functional and Inspiration As-
sessment can be run with segmentation of only the left and right lungs, in which
case the statistics will be computed over three equally spaced vertical partitions
of each lung (i.e. "thirds"). The quality of the lobar or lungs-only segmentation
must be assessed by the user visually using RGB output image (see Section 8.3).
Important Note: If Imbio CT LDA Software is installed with the Imbio Cloud Plat-
form or the Imbio Enterprise Platform, user preferences for optional features are
set only at installation.
4.3.1 Filtering
Before classification, a noise reducing filter is applied to the lung datasets by de-
fault. This filtering can be turned off by the user.
There are tradeoffs between the two options, unfiltered and filtered. Filtering be-
fore classification allows for robust classification of low signal-to-noise ratio (SNR)
images (high specificity) at the expense of missing small areas of low attenuation
(reduced sensitivity). Not filtering before classification allows for identification of
small areas of low attenuation areas (high sensitivity) at the expense of small
erroneous classifications of low attenuation areas in noisy images (reduced speci-
ficity).
The user is allowed to determine if filtering is appropriate for classification for the
input images based on the patient of interest and the noise level of the scans.
4.3.2 Adjustable Thresholds
The inhalation threshold and exhalation threshold (if applicable) may be deter-
mined by the user and provided as inputs to the LDA Software. Values for thresh-
olds are given in Hounsfield units (HU) and are allowed in the range of -1024 HU
and 0 HU.
The default inhalation threshold is -950 HU and the default exhalation threshold
is -856 HU (Nature Medicine, Volume 18, Number 11, November 2012, Pages
1711-1715.).
4.3.3 Report Format
The format of the output report can be selected by the user. The two SOPClasses
currently supported for the output report are Encapsulated PDF Report and Sec-
ondary Capture Image Storage. The user may select either one of these formats
P. 14 UM-36 v1.0IMBIO CT LUNG DENSITY ANALYSIS™ USER MANUAL
4_COMPONENTS
to be generated or both formats to be generated as output. The default format
for the report is Encapsulated PDF Report.
4.3.4 Institution Logo
The LDA summary reports display the Imbio logo in the upper left corner of the
report. This logo can be replaced with an alternate logo from the user's institution.
The maximum logo size is 1.4 cm height by 6.0 cm width. Minimum resolution
is 300 dots per inch (dpi). Given these requirements, either square or horizontal
shaped logos are recommended, vertical oriented (tall) logos will not elegantly fit
in the report header. The logo format can be either PNG or JPEG.
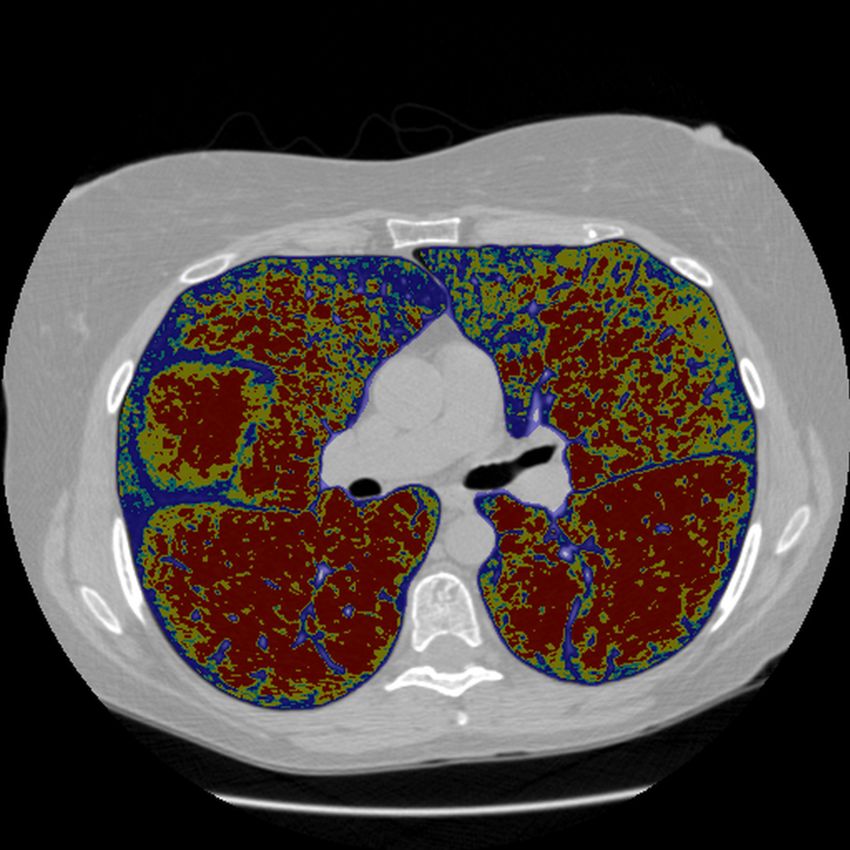
4.3.5 Multiple Thresholds (Insp. Assessment Feature Only)
Inspiration Assessment can be configured such that the RGB output image can
display multiple thresholds as different color overlays. The Report will only report
statistics on the primary threshold provided to the algorithm as reflected in the
report. In Figure 1, the color scheme has been configured as follows:
RED - Below -950 HU
YELLOW - Between -950 and -900 HU
CYAN - Between -900 and -875 HU
BLUE - Above -875 HU
Figure 1: Slices of Inspirational Assessment Map with multiple thresholds config-
ured.
P. 15 UM-36 v1.0IMBIO CT LUNG DENSITY ANALYSIS™ USER MANUAL
4_COMPONENTS
4.3.6 Adjustable Percentile (Insp. Assessment Feature Only)
The Inspiration Assessment calculates PercX (where ''X'' corresponds to the desired per-
centile), the HU value corresponding to the Xth percentile of lung intensity values. The
percentile used to compute the percentile low attenuation area can be adjusted to be any
value between 0 and 100. The default value for X is 15.
4.3.7 Additional LungMap Report (Insp. Assessment Feature Only)
The Inspiration Assessment can output an additional report, the LungMap™ Report. This
report simplifies the Inspiration Assessment Report results and is available in two versions:
one that contains information about general benefits of smoking cessation and another
that contains peer-reviewed, published statistics that may help motivate former smokers
to stay off tobacco. For more information on the contents of the LungMap™ Report, see
Section 6.5.
P. 16 UM-36 v1.0IMBIO CT LUNG DENSITY ANALYSIS™ USER MANUAL
5_FUNCTIONAL ASSESSMENT
5 Functional Assessment
The Functional Assessment generates two main outputs; a Functional Assessment Map
and a Functional Assessment Report.
5.1 Inputs
The LDA Functional Assessment takes two CT scans from the same exam as input, one
taken during inspiration and the other during expiration. The input datasets must have
the same Patient Name, Patient ID, and Study ID. The user may also input an inspiration
HU threshold, an expiration HU threshold, select the registration direction and/or turn
filtering off. For more information on optional inputs, see Section 4.3.
5.2 Functional Assessment Map
The Functional Assessment Map is a DICOM Secondary Capture Image with voxel data
that is the original expiration image with an RGB overlay. The RGB overlay color codes
each lung tissue voxel, identifying the lung tissue as one of three classification categories.
The classification categories are defined by an inhalation threshold (in HU), an exhalation
threshold (in HU), lower limit threshold of -1024 HU and an upper limit threshold of 0
HU. See Section 4.3.2 for more information on input thresholds. Below are the definitions
of the classification categories and the corresponding color of the Functional Assessment
Map voxel data.
GREEN - Normal
Voxels with HU higher than inspiration threshold
and higher than expiration threshold
YELLOW - Functional Low Density Area
Voxels with HU higher than inspiration threshold
and lower than expiration threshold
RED - Persistent Low Density Area
Voxels with HU lower than inspiration threshold
and lower than expiration threshold
Example axial slices from the Functional Assessment Map are shown below in Figure 2.
P. 17 UM-36 v1.0IMBIO CT LUNG DENSITY ANALYSIS™ USER MANUAL
5_FUNCTIONAL ASSESSMENT
Figure 2: Slice of Functional Assessment Map: Lobar segmentation activated (left)
and de-activated (right).
5.3 Segmentation Map
Imbio CT LDA Software produces a segmentation DICOM series so that users can assess
the quality of segmentation. If lobar segmentation is NOT activated, the left and right
lungs are labeled. If lobar segmentation is activated, the upper right, middle right, lower
right, upper left, and lower left lobes are labeled: See Figure 3 for example segmenta-
tion DICOM series images and section 8.3 for more details on how to interpret the images.
Figure 3: Example segmentation maps: Lobar segmentation activated (left) and
lobar segmentation de-activated.
P. 18 UM-36 v1.0IMBIO CT LUNG DENSITY ANALYSIS™ USER MANUAL
5_FUNCTIONAL ASSESSMENT
5.4 Registration Map
Imbio CT Lung Density Analysis™ (LDA) Software generates a "warped" inspiration map
that helps visualize the registration process that is part of the Functional Assessment
algorithm. Figure 4 shows an example of this output side by side with a corresponding
expiration image. Please see section 8.5 for more details on how to interpret this image.
Inspiration Registered Inspiration Expiration
Figure 4: Inspiratory phase CT scan registered to the expiratory phase CT scan.
P. 19 UM-36 v1.0IMBIO CT LUNG DENSITY ANALYSIS™ USER MANUAL
5_FUNCTIONAL ASSESSMENT
5.5 Functional Assessment Report
The Functional Assessment Report is a DICOM compatible format. It is either a Encapsu-
lated PDF Report SOPClass or Secondary Capture Image Storage SOPClass. The report
summarizes the results of the Functional Assessment Map. It contains patient informa-
tion, lung slice images, and tables displaying results. An example report is shown below
in Figure 5.
TM
LUNG DENSITY ANALYSIS
FUNCTIONAL ASSESSMENT
NAME: 13155Y_UAB_COPD SEX: Female STUDY DATE: January 1, 1900
PATIENT ID: 13155Y_UAB_COPD DOB: Unknown REPORT DATE: March 25, 2021
MANUFACTURER: GE MEDICAL SYSTEMS MODEL: LightSpeed16 STATION NAME: KC03_OC0
KERNEL: STANDARD SLICE THICKNESS: 0.62 TUBE CURRENT AVG ( max 400
min ), KVP: 400 ( 400 ) mA, 120 kV
CORONAL SLICE SAGITTAL SLICE - RIGHT MIDLINE SAGITTAL SLICE - LEFT MIDLINE
AXIAL SLICE - UPPER THIRD AXIAL SLICE - MIDDLE THIRD AXIAL SLICE - LOWER THIRD
SUMMARY BY LUNG LOBES
42% TOTAL LEFT LUNG RIGHT LUNG
% LUNG
33% Total Upper Middle Lower Total Upper Middle Lower
24% Normal 24 ± 2* 26 ± 2 32 ± 2 N/A 21 ± 2 22 ± 2 24 ± 2 23 ± 2 21 ± 2
Functional 33 ± 2 36 ± 2 40 ± 3 N/A 32 ± 3 30 ± 2 28 ± 4 37 ± 5 29 ± 4
Persistent 42 ± 1 38 ± 2 27 ± 2 N/A 46 ± 3 47 ± 1 47 ± 3 39 ± 5 49 ± 3
NORMAL Vol (L) TOTAL LUNG LEFT LUNG RIGHT LUNG
Voxels ABOVE -950 HU on inspiration Inspiration 7.1 3.5 3.6
Voxels ABOVE -856 HU on expiration
Expiration 5.7 2.7 2.9
FUNCTIONAL LOW DENSITY AREA
Voxels ABOVE -950 HU on inspiration *THE RANGES PROVIDED WITH THE LDA RESULTS ARE AN INDICATION OF THE ACCURACY OF REGISTRATION (SEE USER MANUAL FOR
Voxels BELOW -856 HU on expiration MORE INFORMATION). THIS DOES NOT ACCOUNT FOR ADDITIONAL SOURCES OF VARIATION SUCH AS SLICE THICKNESS, IMAGE NOISE,
SCANNER CALIBRATION OR RESPIRATORY PHASE.
PERSISTENT LOW DENSITY AREA VALUES ON FUNCTIONAL ASSESSMENT REPORT ARE CALCULATED BASED ON THE EXPIRATORY IMAGE. VALUES MAY DIFFER FROM
Voxels BELOW -950 HU on inspiration INSPIRATION ASSESSMENT REPORT AS THE PERSISTENT LOW DENSITY AREA REPRESENTS VOXELS WHICH ARE LOW ON BOTH
Voxels BELOW -856 HU on expiration INSPIRATION AND EXPIRATION AND THE PERCENTAGES ARE CALCULATED BASED ON THE EXPIRATORY IMAGES.
Analysis was run with FILTERING OFF
ADDITIONAL
INFORMATION
User manual for Lung Density Analysis v3.1.0 can be found at https://www.imbio.com/support-documentation.
Page 1 of 1 for Report 0xc0695440.F
Figure 5: Functional LDA report
P. 20 UM-36 v1.0IMBIO CT LUNG DENSITY ANALYSIS™ USER MANUAL
5_FUNCTIONAL ASSESSMENT
Report Header
Of particular importance in the report header are the reconstruction kernel, slice thick-
ness, and x-ray tube current. These parameters affect either the effective resolution of
the CT image and/or the dose, which in turn affect repeatability of lung density mea-
surements. When comparing follow-up lung density measurements, it is important that
changes in these parameters are observed and accounted for during assessment.
Report Statistics
The results summarized within the report include the percent of lung tissue identified as
Normal, Functional Low Density Area and Persistent Low Density Area for right, left and
total lung. A small percentage of voxels do not fit into well-defined physiologic categories
(below -950 HU on inspiration and above -856 on expiration) and thus are not reported.
For this reason, the reported category percentages may not add up to 100%. If lobar
segmentation is enabled, the text "SUMMARY BY LUNG LOBES" is displayed along with
percentages for the upper, middle, and lower right and upper and lower left lobes. If
lobar segmentation is NOT enabled, the text "SUMMARY BY LUNG THIRDS" is displayed
along with percentages for three equally sized regions of both lungs.
Percentages are presented with estimated variations. The values are based off of the
estimated accuracy of the registration algorithm. Large estimated variations typically re-
flect a nonuniform density pattern that is sensitive to registration accuracy. If the density
patterns are uniform and insensitive to registration accuracy, the estimated variations
will be small. Therefore, the estimated variations can be thought of as a measure of con-
fidence in the reported values based on the expected accuracy of the registration process.
The Imbio registration algorithm will not produce a perfect registration between the in-
spiration and expiration images. The effect of the registration accuracy was assessed
by comparing the automated Imbio registration to a perfect registration found through
manual landmark definition. LDA percentages were calculated for the automated Imbio
registration and for the perfect registration for multiple subjects. It was found the LDA
percentages for the automated Imbio registration all fell within the variation of the LDA
percentages for the perfect registration.
Volumes of the segmented inspiration and expiration lungs are also reported. Total lung
volumes are given as well as the volumes for the right and left lung.
NOTE: Report summary statistics are rounded to the nearest integer. Thus, values less
than 0.5% will be displayed as 0%.
Report Graphics
The report displays six images, displaying slices of the Functional Assessment Map in dif-
ferent orientations. The six images include, one coronal slice, mid sagittal slice of the
right lung, mid sagittal slice of the left lung, and three axial slices, the middle of the
lower, middle and upper third of the lungs. Below is an example of the images found in
the report (Fig. 6).
P. 21 UM-36 v1.0IMBIO CT LUNG DENSITY ANALYSIS™ USER MANUAL
6_INSPIRATION ASSESSMENT
Figure 6: Example of lung images found in Functional Assessment Report
6 Inspiration Assessment
The Inspiration Assessment of the LDA Software generates two main outputs; the Inspi-
ration Assessment Map and the Inspiration Assessment Report.
6.1 Inputs
The Inspiration Assessment component only takes an inspiration scan as input. In addi-
tion, the user may input an inhalation threshold, input a percentile for PercX calculation,
create the additional LungMap™ Report and/or turn filtering off. For more information on
optional inputs, see Section 4.3. For the version of LungMap targeting former smokers,
the Patient Sex DICOM attribute (0x0010,0x0040) must be present and contain an "M"
or "F" value.
6.2 Inspiration Assessment Map
The Inspiration Assessment Map is a DICOM Secondary Capture Image with voxel data
that is the original inspiration image with an RGB overlay. The RGB overlay identifies
two classes of tissue. First, voxels that are labeled as lung tissue by the segmentation
algorithm and have a HU value equal to or above the inhalation threshold are identified
by a translucent blue color. The blue voxels can be used to assess the quality of the lung
segmentation. Second, voxels that are labeled as lung tissue by the segmentation algo-
rithm and have a HU value below the inhalation threshold are identified by an opaque red
color. The inhalation threshold may be determined by the user and provided as inputs to
the Imbio CT Lung Density Analysis™ Software. If thresholds are not defined by the user,
the inhalation threshold defaults to -950 HU.
An example of a slice from the Inspiration Assessment Map is shown below in Figure 7.
P. 22 UM-36 v1.0IMBIO CT LUNG DENSITY ANALYSIS™ USER MANUAL
6_INSPIRATION ASSESSMENT
Figure 7: Slice of Inspiration Assessment Map
6.3 Segmentation Map
Imbio CT LDA Inspiration Assessment Software produces a segmentation DICOM series
so that users can assess the quality of segmentation. For more details, please refer to
sections 5.3 and 8.3.
6.4 Inspiration Assessment Report
The Inspiration Assessment Report is a DICOM compatible format. It is either a Encap-
sulated PDF Report SOPClass or Secondary Capture Image Storage SOPClass. The report
summarizes the results of the Inspiration Assessment Map. It contains patient informa-
tion, lung slice images, charts and tables displaying results. An example report is shown
below in Figure 8. As explained in Section 5.5, it is important to note the image acquisi-
tion parameters. Please see Section 5.5 for more details.
P. 23 UM-36 v1.0IMBIO CT LUNG DENSITY ANALYSIS™ USER MANUAL
6_INSPIRATION ASSESSMENT
TM
LUNG DENSITY ANALYSIS
INSPIRATION ASSESSMENT
NAME: 13155Y_UAB_COPD SEX: Female STUDY DATE: January 1, 1900
PATIENT ID: 13155Y_UAB_COPD DOB: Unknown REPORT DATE: March 25, 2021
MANUFACTURER: GE MEDICAL SYSTEMS MODEL: LightSpeed16 STATION NAME: KC03_OC0
KERNEL: STANDARD SLICE THICKNESS: 0.62 TUBE CURRENT AVG ( max 400
min ), KVP: 400 ( 400 ) mA, 120 kV
RESULTS 15TH
PERCENTILE
1.0
0.75
Percentage
0.5
0.25
0
-1000 -900 -800 -700 -600 -500
-986
Hounsfield Unit
CT SCAN ANALYSIS LUNG DENSITY DISTRIBUTION
ASSESSMENT KEY
LOW DENSITY AREA
Voxels BELOW -950 HU on inspiration
SUMMARY BY LUNG LOBES LUNG VOLUME BY LOBES
% < -950 HU LEFT LUNG RIGHT LUNG Inspiration LEFT LUNG RIGHT LUNG
TOTAL LUNG 38 % 47 % TOTAL LUNG 3.5 L 3.6 L
Upper Lobe 27 % 48 % Upper Lobe 1.5 L 1.4 L
Middle Lobe N/A 40 % Middle Lobe N/A 0.6 L
Lower Lobe 46 % 49 % Lower Lobe 2.0 L 1.7 L
Total Lung: 43 % Total Lung: 7.1 L
Analysis was run with FILTERING OFF
ADDITIONAL
INFORMATION
User manual for Lung Density Analysis v3.1.0 can be found at https://www.imbio.com/support-documentation.
Page 1 of 1 for Report 0xc0694078.I
Figure 8: Inspiration LDA report
Report Statistics
The results summarized within the report include the percent of lung tissue below the in-
halation threshold for right, left and both lungs. If lobar segmentation is enabled, the text
"SUMMARY BY LUNG LOBES" is displayed along with percentages for the upper, middle,
and lower right and upper and lower left lobes. If lobar segmentation is NOT enabled, the
text "SUMMARY BY LUNG THIRDS" is displayed along with percentages for three equally
sized regions of both lungs.
P. 24 UM-36 v1.0IMBIO CT LUNG DENSITY ANALYSIS™ USER MANUAL
6_INSPIRATION ASSESSMENT
NOTE: Report summary statistics are rounded to the nearest integer. Thus, values less
than 0.5% will be displayed as 0%.
Report Graphics
The report displays an image of the mid coronal slice of the Inspiration Assessment Map.
In the image shown in the report, only the voxels that are labeled as lung tissue by the
segmentation algorithm and have a HU value below the inhalation threshold are shown.
Below is an example of the image found in the report (Fig. 9) .
Figure 9: Example of lung image in Inspiration Assessment Report
The other graphic in the report is the Density Histogram. This plot visually displays the
percentage of lung voxel density at each Hounsfield Unit for both lungs. In addition, a
line corresponding to the PercX measurement (see Section 4.3.6 for details about PercX)
is shown on the histogram. Below is an example of the image found in the report (Fig 10).
Figure 10: Example of Density Histogram in Inspiration Assessment Report
P. 25 UM-36 v1.0IMBIO CT LUNG DENSITY ANALYSIS™ USER MANUAL
6_INSPIRATION ASSESSMENT
6.5 LungMap™ Report
The LungMap™ Report is an optional report that is generated in addition to the Inspiration
Assessment Map and the Inspiration Assessment Report. The LungMap™ Report is a
DICOM compatible format. It is either a Encapsulated PDF Report SOPClass or Secondary
Capture Image Storage SOPClass. The report contains the percentages of lung volume
below and above the inspiration threshold, the most affected lobe or third of the lung and
is corresponding percent below threshold, and an image of the lung and a table listing the
potential benefits of smoking cessation. An example report is shown below in Figure 11.
TM
LungMap Report
For Educational Purposes Only
Page 1 of 1 for Report 0xb9d71dec.P
13155Y_UAB_COPD,
here are your lungs today:
CT scan performed on January 1, 1900 (DOB: Unknown)
43 % Low Density*
Most Affected Region:
49%, Lower Right Lung
57 % Normal Density
*Low Density tissue is defined as the
% of lung tissue (by volume) below
-950 Hounsfield Units. Please
consult your physician for more
information regarding what this
may mean for your health.
Good news 13155Y_UAB_COPD, if you smoke, your body begins
to repair the damage the minute you quit smoking:
Your risk of having a heart
20 Your heart rate drops
to a normal level.
12 The carbon monoxide level 2-12 attack begins to drop. Your lung
MINUTES HOURS in your blood drops to normal. WEEKS function begins to improve.
Your risk of a stroke is the
Your coughing and Your added risk of coronary
1-9 shortness of breath 1 heart disease is half that 5-15 same as someone who has never
smoked. Your risk of cancer of
MONTHS decrease. YEAR of a smoker's. YEARS the mouth, throat, or esophagus
is half that of a smoker's.
Your risk of dying from Your risk of coronary heart
10 lung cancer is about half 15 disease is the same as someone
† Source: U.S. Department of Health and Human
Services. The Health Consequences of Smoking:
YEARS that of a smoker's. YEARS who has never smoked. A Report of the Surgeon General. Atlanta, GA: 2004.
We're here to help. Successfully quitting and staying off tobacco can be very difficult,
but people who keep trying are very likely to succeed. Please call the help center
at 777-777-7777 to speak with someone who is ready to listen and can connect you
with smoking cessation resources.
Powered by Imbio Lung Density Analysis™ | imbio.com
Figure 11: Example LungMap™ Report for current smokers
P. 26 UM-36 v1.0IMBIO CT LUNG DENSITY ANALYSIS™ USER MANUAL
6_INSPIRATION ASSESSMENT
Another version of the LungMap™ Report for former smokers is also available. Instead
of a table listing the potential benefits of smoking cessation, a figure showing decreasing
relative risk of lung cancer over time after quitting tobacco compared to never-smokers
is displayed. Statistics are taken from a peer-reviewed article [1] and are personalized
based on the patient's gender. An example report is shown below in Figure 12.
TM
LungMap Report
For Educational Purposes Only
Page 1 of 1 for Report 0xb9d71dec.Q
13155Y_UAB_COPD,
here are your lungs today:
CT scan performed on January 1, 1900 (DOB: Unknown)
43 % Low Density*
Most Affected Region:
49%, Lower Right Lung
57 % Normal Density
*Low Density tissue is defined as the
% of lung tissue (by volume) below
-950 Hounsfield Units. Please
consult your physician for more
information regarding what this
may mean for your health.
Good news 13155Y_UAB_COPD, the longer you remain a non-smoker, the more your
odds of getting lung cancer keep going down.
We're here to help. Successfully quitting and staying off tobacco can be very difficult,
but people who keep trying are very likely to succeed. Please call the help center
at 777-777-7777 to speak with someone who is ready to listen and can connect you
with smoking cessation resources.
Powered by Imbio Lung Density Analysis™ | imbio.com
Figure 12: Example LungMap™ Report for former smokers
P. 27 UM-36 v1.0IMBIO CT LUNG DENSITY ANALYSIS™ USER MANUAL
6_INSPIRATION ASSESSMENT
Report Statistics
The statistics within the report are the total percentages of lung volume below and above
the inspiration threshold, as well the most affected region with it's corresponding per-
centage below the threshold. The most affected region refers to the lobe or third with
the highest percentage of voxels below the specified threshold. Unlike the Inspiration
Assessment Report, the lung volumes are not included in the LungMap™ Report.
Report Graphics
The LungMap™ report displays an image of a coronal slice of the Inspiration Assessment
Map towards the center of the lungs that has percentage of pixels below the threshold
similar to the percentage below the threshold for the entire lung. The color of the lung
pixels on this image slice imitates the colors of the physical lung; pink for normal density
tissue and black for low density tissue. The image has an outline of the body outside
of the lungs to give a clearer picture of the orientation and position of the lungs in the
patient's body. Below is an example of the image slice found in the report (Fig. 13 ).
Figure 13: Example of lung image in LungMap™ Report
The other graphic in the current smoker report is a table of smoking cessation benefits
(Figure 14). This table remains the same and does not change on a patient-to-patient
basis.
The other graphic in the former smoker report is the figure showing the relative risk of
lung cancer diagnosis as a function of time after quitting tobacco (Figure 15). This figure
is personalized based on whether or not the patient is male (Fig. 15) or female (Fig. 16).
Please see Table 4 from [1].
P. 28 UM-36 v1.0IMBIO CT LUNG DENSITY ANALYSIS™ USER MANUAL
6_INSPIRATION ASSESSMENT
Figure 14: Table of Smoking Cessation Benefits
Figure 15: Figure showing the decreasing relative risk of lung cancer diagnosis
compared to never-smokers for males.
Figure 16: Figure showing the decreasing relative risk of lung cancer diagnosis
compared to never-smokers for females.
P. 29 UM-36 v1.0IMBIO CT LUNG DENSITY ANALYSIS™ USER MANUAL
7_POSSIBLE ENCOUNTERED EXCEPTIONS
7 Possible Encountered Exceptions
The Imbio CT Lung Density Analysis™ Software produces notifications and errors when
an exception is encountered within the algorithm. Below are possible errors generated by
the software with further descriptions and probable causes of the exceptions.
7.1 Input Errors
ERROR: Invalid input data |
This error occurs if the data provided do not meet Imbio's requirements. For example,
the path provided contains more than one DICOM series. For the details on each required
parameter, see Section 2.2.1.
ERROR: Unacceptable input data |
This error occurs if the image acquisition parameters fo not meet Imbio's requirements.
For the deatils on each required parameter, see Secion 2.2.1.
In the event that this error occurs, the algorithm will output and Input Check Failure Re-
port indicating the reason why the input data was deemed unacceptable. An examle Input
Check Dailure Report for the Inspiration Assessment is shown in Figure 17. The cause(s)
of the input check failure can be identified by the red 'X' mark in the Result column. In
Figure 17, the offending parameter is the slice thickness. Note the yellow triangle warn-
ing signs indicate sub-optimal parameters (Convolution Kernel) or parameters that are
missing from the input meta data (Revolution Time). These warnings will not result in an
input check failure, but should be noted nonetheless.
ERROR: Input images have same Series Instance UID
This error occurs when both input images have the same Series Instance UID. The Series
Instance UIDs must be unique for each input image. Check the DICOM attributes of the
uploaded series.
7.2 Segmentation Errors
ERROR: Could not extract airways
ERROR: Could not separate lungs
ERROR: Could not find trachea
ERROR: No lungs found
These errors indicate an exception in the segmentation step of the Imbio CT Lung Density
Analysis™ Software. Possible causes include:
• Patient body motion or breathing during the scan.
• Tracheomalacia or very narrow major bronchi.
• Scanning more than a few centimeters above the apex of the lung.
• Lungs are not contained with the field of view of the image.
P. 30 UM-36 v1.0IMBIO CT LUNG DENSITY ANALYSIS™ USER MANUAL
7_POSSIBLE ENCOUNTERED EXCEPTIONS
TM
LUNG DENSITY ANALYSIS
INPUT CHECK REPORT
ACCESSION NUMBER: 6789 MANUFACTURER: GE MEDICAL SYSTEMS KERNEL: BONE
STATION NAME: Unknown MODEL: Horos TUBE CURRENT AVG ( max 300
min ), KVP: 300 ( 300 ) mA, 140 kV
Requirement Value Result
Series Description: ER AAA 3.0 B30f - THICK
Series Instance UID: 1.3.6.1.4.1.19291.2.1.2.16413123114215210612372205883
Modality CT CT
Revolution Time (sec) ≤1 Not Present
Pixel Spacing (mm) ≤2 N/A
Column Spacing (mm) ≤2 0.607422
Row Spacing (mm) ≤2 0.607422
Slice Spacing (mm) ≤ 2.5 2.5
FOV (mm) ≥ (200, 100, 100) (295.0, 311.000064, 311.000064)
Slice Thickness (mm) ≤ 2.5 5.0
Image Orientation (±1,0,0,0,±1,0) (1.0, 0.0, 0.0, 0.0, 1.0, 0.0)
Patient's Age (years) ≥ 18 52
Rescale Type HU HU
Convolution Kernel Non-edge-enhancing BONE
See Lung Density Analysis 3.1.0 User Manual (section Scan Protocol Requirements) for more information on input requirements.
User manual can be found at https://www.imbio.com/support-documentation.
Figure 17: Example of an Input Check Failure Report
• The input image does not contain lungs or the input image is noisy.
ERROR: Lung larger than the expected size range
ERROR: Lung smaller than the expected size range
These errors indicate that the segmented lungs do not fall within the expected range of
volumes. This could be due to a poor segmentation where non lung tissue was misidenti-
fied as lung or lung tissue was excluded from the segmentation. These errors could also
be a result of a patient with anomalous anatomy.
P. 31 UM-36 v1.0IMBIO CT LUNG DENSITY ANALYSIS™ USER MANUAL
7_POSSIBLE ENCOUNTERED EXCEPTIONS
ERROR: Airways larger than the expected size range
ERROR: Airways smaller than the expected size range
These errors indicate that the segmented airways do not fall within the expected range of
volumes. This could be due to a poor segmentation where airways bled into the lung or
only the trachea was able to be identified. These errors could also be a result of a patient
with anomalous anatomy.
7.3 Registration Errors
ERROR: Borders metric indicates poor registration
ERROR: Similarity metric indicates poor registration
These errors indicate that the registered image does not meet the required Imbio stan-
dards. A poor registration could be due to a large difference in size between the two input
images or a poor segmentation.
P. 32 UM-36 v1.0IMBIO CT LUNG DENSITY ANALYSIS™ USER MANUAL
8_CONSIDERATIONS TO REDUCE RISK
8 Considerations to Reduce Risk
8.1 Protocol
Users must follow CT protocol as seen in Section 2.2.
8.2 Expected Performance
The accuracy of the LDA Functional Assessment measurements is primarily determined by
the quality of the image registration. An estimate of the accuracy of the measurements
is given in the form of a range for each measurement on the output report (Figure 18).
Figure 18: Chart of LDA measurements on the Functional Assessment Report.The
arrows indicate the estimated variation of the LDA measurement.
These ranges of values represent an estimate of how the measurement values would
change if the images were translated in all directions within the range of the estimated
accuracy of the image registration process. Note that the Imbio LDA algorithm is deter-
ministic, meaning that the LDA measurements will be identical for repeated analyses on
the same input data set. Therefore, the major determinant of measurement precision
is the noise level in the input images. The noise level of the input images should be
considered when comparing measurements from multiple acquisitions.
8.3 Lung Segmentation Quality Assessment
8.3.1 Introduction
The Imbio CT Lung Density Analysis™ (LDA) Software uses advanced image processing
techniques to segment the lungs from thoracic CT images so that density analysis can
be performed. The software produces a segmentation DICOM series so that users can
assess the quality of segmentation. If lobar segmentation is NOT activated, the left and
right lungs are labeled. If lobar segmentation is activated, the upper right, middle right,
lower right, upper left, and lower left lobes are labeled: See Figure 19 for a list of the col-
ors used for anatomical labeling and Figures 20 and 21 for example segmentation DICOM
series images.
P. 33 UM-36 v1.0IMBIO CT LUNG DENSITY ANALYSIS™ USER MANUAL
8_CONSIDERATIONS TO REDUCE RISK
Figure 19: Lung Segmentation label colors.
In order to detect segmentation errors, LDA software checks input parameters and lung
segmentation statistics, and notifies users with warning or error messages if potential
problems are discovered. Even so, there may be a small number of cases where poor
segmentation quality is not automatically detected and the output report is generated with
potentially misleading results. These cases can be categorized as one of the following:
• Lung inclusion errors. This includes but is not limited to the following:
– Air outside of the body is categorized as lung.
– Air in the gut is categorized as lung.
– Air in the esophagus is categorized as lung.
• Lung exclusion errors. This includes but is not limited to the following:
– Part of the lung is categorized as belonging to the airway tree, removing that
part of the lung from the analysis.
– The apex of the lung is categorized as part of the trachea.
– High-density areas of the lung parenchyma are excluded from the segmenta-
tion.
• Left/right lung labeling error.
– Part of the left lung is incorrectly classified as belonging to the right lung, or
vice versa.
– Either the left or right lung is excluded from the segmentation.
The following section contains figures that illustrate examples of segmentation errors
that may generate misleading results. Users of the software should look for this type
of output and, if present, the results should not be used. The Imbio CT Lung Density
Analysis™ Software should only be used by Pulmonologists, Radiologists, and Radiology
Technicians under the supervision of a Pulmonologist or Radiologist.
P. 34 UM-36 v1.0IMBIO CT LUNG DENSITY ANALYSIS™ USER MANUAL
8_CONSIDERATIONS TO REDUCE RISK
Figure 20: Example lung segmentation.
Figure 21: Example lobar segmentation.
P. 35 UM-36 v1.0IMBIO CT LUNG DENSITY ANALYSIS™ USER MANUAL
8_CONSIDERATIONS TO REDUCE RISK
8.3.2 Examples of Lung Segmentation Errors
1. Outside inclusion. In certain cases, the air outside of the body may be incorrectly
labeled as part of the left or right lung.
Figure 22: Segmentation overlay showing outside air inclusion error.
2. Gut inclusion. If air is present in the transverse colon, the colon may incorrectly be
labeled as part of the lung. This is more common when the input CT image has a slice
thicknesses greater than 2 cm.
Figure 23: Segmentation overlay showing gut air inclusion error.
3. Esophagus inclusion. A dilated esophagus may accidentally be labeled as part of the
lungs. This type of error may result in a few percentage point over-estimation of persistent
(Functional LDA) or percent below threshold (Inspiration LDA).
4. Lung exclusion due to mislabeled airways. In some cases, parts of the lung parenchyma
may be accidentally classified as distal airways. In other cases, the apex of the lung may
be mis-identified as part of the trachea, leading to a lung exclusion error and mis-labeling
of the trachea as part of the lungs.
4. Exclusion due to dependent atelectasis.
P. 36 UM-36 v1.0IMBIO CT LUNG DENSITY ANALYSIS™ USER MANUAL
8_CONSIDERATIONS TO REDUCE RISK
Figure 24: Segmentation overlay showing gut air inclusion error.
Figure 25: Segmentation overlay showing airway leak into lung parenchyma.
Figure 26: Segmentation overlay showing lung apex classified as trachea.
5. Left/right lung labeling error.
6. Left/right lung exclusion error. This occurs more often in expiration scans when the
major airways are occluded or have collapsed.
P. 37 UM-36 v1.0IMBIO CT LUNG DENSITY ANALYSIS™ USER MANUAL
8_CONSIDERATIONS TO REDUCE RISK
Figure 27: Segmentation overlay lung exclusion due to depenent atelectasis.
Figure 28: Segmentation overlay showing left/right lung mislabeling.
Figure 29: Segmentation overlay showing left lung exclusion.
8.4 Lobe Segmentation Quality Assessment
8.4.1 Introduction
As an optional feature, Imbio CT Lung Density Analysis™ Software is able to perform
lobar segmentation of the lungs. Lobar segmentation divides the right lung into the upper,
middle, and lower right lobes and the left lung into the upper and lower left lobes. In some
cases, a lung lobe may be missing from the segmentation, or the segmentation may be
P. 38 UM-36 v1.0You can also read