Statin Treatment Induced a Lipogenic Expression Hierarchical Network Centered by SREBF2 in the Liver
←
→
Page content transcription
If your browser does not render page correctly, please read the page content below
ORIGINAL RESEARCH
                                                                                                                                              published: 19 July 2021
                                                                                                                                     doi: 10.3389/fendo.2021.573824

                                           Statin Treatment Induced
                                           a Lipogenic Expression Hierarchical
                                           Network Centered by SREBF2
                                           in the Liver
                                           Shiyu Song 1, Mengyuan Niu 1, Qiao Liang 1, Lei Wang 1, Haiyan Min 1, Yuming Peng 2,
                                           Hongwei Wang 1,3* and Qian Gao 1*
                                           1Center for Translational Medicine and Jiangsu Key Laboratory of Molecular Medicine, Medical School of Nanjing University,
                                           Nanjing, China, 2 Department of General Practice of Central Hospital of Karamay, Karamay, China, 3 State Key Laboratory of
                                           Analytical Chemistry for Life Science, Medical School, Nanjing University, Nanjing, China

                                           Statin treatment is a major prevention treatment for hypercholesterolemia and the
                                           management of patients with increased risk of cardiovascular disease (CVD) due to its
                            Edited by:
                         Ruth Andrew,
                                           protective effects. However, its long-term safety was questioned regarding its potential
              University of Edinburgh,     role in new-onset type 2 diabetes mellitus, and its effect on gene regulation in the liver is
                     United Kingdom        not yet fully understood. By reanalyzing the transcriptome of the livers of patients with
                       Reviewed by:        obesity and hypercholesterolemia, this study shows a multiple module organization that is
                      Matthew Brook,
              University of Edinburgh,     related to various clinical metabolic parameters and identified an expression hierarchical
                     United Kingdom        network involving cholesterol and fatty acid syntheses in the liver of statin-treated patients.
                     Maria Fedorova,
          Leipzig University, Germany
                                           The key genes of the network were validated by QPCR in the hepatocytes upon statin
                 *Correspondence:
                                           treatment. The upregulation of the key enzymes involving the synthesis of Acetyl-CoA and
                          Qian Gao         the induction of gentle global acetylation of pan-protein and histone H4 in hepatocytes
                qian_gao@nju.edu.cn        were observed. The study provides an overall view of the statin effect on transcriptional
                      Hongwei Wang
                   hwang@nju.edu.cn        and post-transcriptional regulation of genes in the liver.
                                           Keywords: statin, liver, protein acetylation, WGCNA, obesity, diabetes
                   Specialty section:
         This article was submitted to
              Systems Endocrinology,
               a section of the journal    INTRODUCTION
            Frontiers in Endocrinology

            Received: 24 June 2020         The high prevalence of obesity is a worldwide health challenge that has continually increased in the
            Accepted: 27 May 2021          last 40 years. It is believed that the global rates of overweight people have almost tripled since 1975
            Published: 19 July 2021        to approximately 39% (1.9 billion) of grown-ups, more than 13% (650 million) of whom are obese
                              Citation:    (1, 2). Obesity is associated with multiple metabolic disorders, e.g. type 2 diabetes, hypertension,
    Song S, Niu M, Liang Q, Wang L,        dyslipidemia, cardiovascular disease (CVD), NASH, and many types of cancers. Among them, CVD
  Min H, Peng Y, Wang H and Gao Q          is becoming the most common cause of death, and total figures have now surpassed 17.3 million
               (2021) Statin Treatment
                                           deaths a year globally, more than twice that caused by cancers according to the Global Burden of
      Induced a Lipogenic Expression
        Hierarchical Network Centered
                                           Disease (GBD) study (3).
               by SREBF2 in the Liver.         There is overwhelming evidence on the benefits of reducing low-density lipoprotein cholesterol
        Front. Endocrinol. 12:573824.      (LDL-c) by statin, a 3-hydroxy-3-methylglutaryl-coenzyme A (HMG-CoA) reductase inhibitor, to
    doi: 10.3389/fendo.2021.573824         CVD (4). Although the protective effect of statin on CVD is supported by multiple clinical evidence,

Frontiers in Endocrinology | www.frontiersin.org                                  1                                          July 2021 | Volume 12 | Article 573824
Song et al.                                                                                                       Statin Altered Liver Transcription

its long-term safety was questioned. For example, several                  package (9). The gene symbols were mapped to the probe ID
randomized controlled trials (RCTs) and observational studies              according to the annotation of GPL20265 [HTA-2_0] Affymetrix
have outlined the possibility of new-onset type 2 diabetes                 Human Transcriptome Array 2.0 [transcript (gene) version].
mellitus with statin treatment, especially in those who have               Probes that do not match with mature transcription were
preexisting risk in glucose metabolism (4, 5). However, little is          removed. Genes matching multiple probes, the highest average
known about the overall response of the body or organs to                  expression of the probe was chosen. Finally, 25,128 genes were
statin treatment.                                                          identified to undergo WGCNA analysis.
    The liver is a central organ in lipogenesis, gluconeogenesis,             The clinical factor data such as gender and usage of statin
cholesterol metabolism, and is the major metabolic organ for               were transformed to numeric data before proceeding. The cluster
statin. Thus, the effects of statin on the liver, for example on its       and correlation test of the clinical parameters were based on K‐
gene regulation, should be addressed. Previously, differently              means algorithm with Spearman distance and COR function
expressed gene (DEGs) analysis in the livers between statin                with Spearman’s method, respectively. Principal component
treated and not treated patients was performed (6); however,               analysis (PCA) was applied to show the overall profile of
the differences of the DEGs were small and the noises of                   patients at the transcriptional level.
transcription were high. The overall organization of the altered
gene modules was not accessed.                                             Weighted Gene Co-expression Network
    Weighted gene correlation network analysis (WGCNA) is a                Construction and Module Detection
powerful method for constructing co-expression networks based              WGCNA was carried out on all 25,128 genes using the R
on expression data with an unbiased approach (7). It provides a            “WGCNA” package. First, cluster analysis was performed by
system biology strategy to explore the functionality of a                  flashClust to evaluate if there was an obvious outlier among the
transcriptome at organ-/system-level that is especially suitable           samples. Among the 910 objects, 876 were kept for network
for analyzing the correlations of corresponding module                     construction. Next, an appropriate soft thresholding power b of
eigengene with numeric clinical phenotypes to identify key                 12 for network construction was identified with the function Pick
modules/genes in a transcriptome.                                          Soft Threshold in the ‘WGCNA’ package to avoid the selection of
    The present study performed a WGCNA to analyze the                     an arbitrary cut-off. Co-expression similarity for each pair of
transcriptome of a microarray data set of liver samples of 910             genes from the adjacency matrix is determined via the
severely obese patients with/without statin treatment. Various             Topological Overlap Matrix (TOM) method which could
clinical parameters were correlated with organized gene modules.           minimize the effects of noise and spurious associations. Finally,
4 modules were correlated with clinical metabolic phenotypes               the co-expression gene modules were identified by hierarchical
and recognized among a total of 18 modules. One module, the                cluster analysis with the following major parameters:
light green module with 75 genes, showed stronger correlations             maxBlockSize of 20,000, minModuleSize of 50, and deepSplit
with glucose and cholesterol parameters and statin treatment.              of 2.18 modules were obtained after merging highly similar
Gene enrichment and interaction analysis revealed that 19                  modules with the height of module eigengene (ME) calculated
biologically tightly associated genes form a gene hub that is              by retaining the first principal component following principal
significantly correlated with low plasma cholesterol and high               component analysis.
fasting glucose levels of the patients to the statin treatment. This
gene expression network was centered by the transcriptional                Relating Modules to Clinical Parameters
factor SREBF2 with several novel key genes that were previously            and Discovering Modules of Interest
not identified by the DEG analysis. Finally, the transcriptional            The relevance between MEs and clinical parameters was
upregulation of key genes was validated by QPCR in hepatocytes.            calculated by COR function with Spearman’s method in the
Enhanced acetylation of both global and histone was observed               WGCNA. The log10 transformation of the P value was then
after statin treatment. Our findings explored an integrated                 defined as gene significance (GS) and the average GS for all genes
transcriptional response and post-transcriptional alternation of           in the module was defined as the module significance (MS).
the liver by statin.
                                                                           Functional Enrichment Analysis
                                                                           Gene ontology (GO) biological process enrichment and KEGG
                                                                           pathway enrichment of genes in the target module were analyzed
MATERIAL AND METHOD
                                                                           and visualized by the “clusterProfiler” R package (10).
Data Collecting and Processing
Dataset GSE130991, a comprehensive analysis of the liver                   Identification and Validation of Hub Genes
transcriptome of obese patients who participated in the                    The gene correlation network of the interested module was
Biological Atlas of Severe Obesity (ABOS) cohort                           calculated with the TOM method. For biological interactions,
(ClinicalTrials.gov identifier NCT01129297) was initially                   the genes were submitted to Search Tool for the Retrieval of
downloaded from GEO via GEOquery (8). The raw data were                    Interacting Genes (STRING, http://www.string-db.org/) (11),
previously processed with robust multi-array average (RMA) in              and the protein–protein interaction (PPI) networks were
log2 transformed form, was then normalized by limma R                      retrieved. The PPI network was analyzed and visualized by

Frontiers in Endocrinology | www.frontiersin.org                       2                                   July 2021 | Volume 12 | Article 573824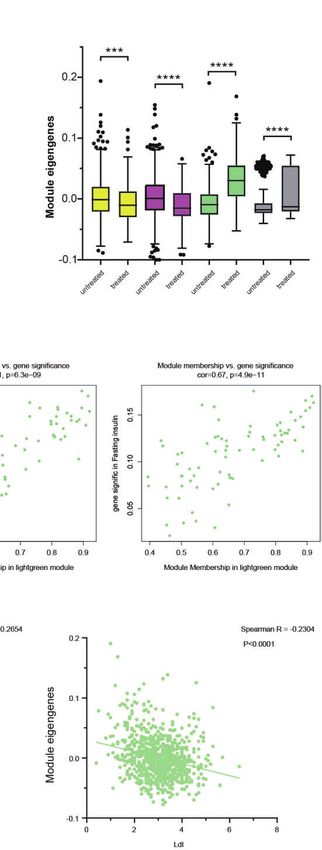
Song et al.                                                                                                                            Statin Altered Liver Transcription

Cytoscape v3.7.2 software (12). The nod size was mapped                               Protein Extraction and Western Blot
according to the average shortest path and the width of the                           Cell total proteins were extracted using RIPA buffer and the
edges was mapped according to the combined score, indicating                          protein concentrations were determined by a BCA kit (Thermo,
the strength of interaction between the nods according to TOM.                        USA). 20 mg of total lysates were separated by a 10% SDS-PAGE
The expressions of the feature genes of the hub were then                             gel and transferred onto a PVDF membrane and blotted with 5%
analyzed by Spearman Ranked Assay between statin treated or                           bovine serum albumin (BSA) in TBS for 90 minutes, and then
not treated group. The correlation with clinical parameters is                        incubated with primary antibodies of anti-acetyl-lysine, anti-
analyzed by COR function in R with Spearman’s method (13).                            acetyl histone H4, and anti-total histone H4 (Cell Signaling
                                                                                      Technology, USA) overnight at 4°C. After washing, the
Cell Culture and Treatment                                                            membrane was incubated with HRP conjugated horse anti-
The human hepatocyte cell line LO2 was purchased from the                             rabbit antibody, 60 minutes at room temperature. The
Type Culture Collection of the Chinese Academy of Sciences                            membranes were visualized by ECL Plus western blotting
(Shanghai, China). The cells were grown in Dulbecco’s modified                         detection reagents (Millipore, USA). Total histone H4 was used
Eagle’s medium (DMEM) supplemented with 10% (v/v) fetal                               as an internal control. The gel was stained with Coomassie
bovine serum (FBS) and 1% penicillin streptomycin (Gibco,                             Brilliant Blue G250.
USA) in humidified incubators at 37°C under 5% CO2. The
cells were seeded in 6-well plates and treated with the indicated
concentration of lovastatin, simvastatin, or TSA (Selleck, USA)
for 24 hours.                                                                         RESULTS
Cell Viability Assay                                                                  Identification of Main Clinical Parameters
Cells were seeded in triplicate at a density of 2 ×10⁴ cells/mL in                    Correlated With Statin Treatment
96 well plates, and Cell viability assays were performed using the                    To identify the clinical observations that correlated with statin
CellTiter 96 AQueous One Solution Cell Proliferation Assay kit                        treatment, we initially compared a set of 17 available
(Promega, USA) after treatment with 2-fold diluted statins for 24                     measurements (Figure S1) that were collected from a cohort of
hours. The absorbance at 490 nm was measured using a                                  910 overweight patients and performed Spearman’s correlation
microplate reader (Bioteck, USA).                                                     test. As shown in Figure 1A, the statin treatment was positively
                                                                                      correlated with fasting blood glucose and HbA1c, but reversely
RNA Extraction and QPCR                                                               correlated with total cholesterol and Ldl, suggesting a beneficial
mRNA was extracted from cultured cells using RNeasy Micro Kit                         role of statin on cholesterol metabolism, but a potential risk on
(Qiagen, Germany), Total mRNA was reversed transcribed into                           glucose metabolism. However, the scatter‐plot based on PCA of
cDNA with PrimeScript RT Master Mix (TaKaRa, otsu, Japan).                            the liver transcriptome data did not show separated clusters
SYBR green quantitative real-time was performed, using PCR                            according to the treatment of statin, indicating that the overall
Master Mix (Life technology, USA). The expression of the target                       profiles of the transcriptome were not significantly altered by
gene was determined relative to beta actin and relative expression                    statin treatment in the liver (Figure 1B). Moreover, the DEGs
was calculated by DDCt method. The primers of each gene are                           analysis showed that there were seldom genes in the liver that
listed in Table S1.                                                                   varied more than 2 fold between statin treated and non-treated

                  A                                         B                                           C

 FIGURE 1 | Correlated test identified main clinical parameters with Statin treatment. (A) Correlation matrix according to Spearman’s rank correlation coefficient of 17
 clinical parameters showed the positive correlation of glucose metabolic and negative correlation of cholesterol with statin treatment. (B) Scatter plot of Principal
 component analysis (PCA) according to gene transcription levels, the color of the dots was mapped to the condition of statin treatment of the patients. (C) Volcano
 plots of the DEGs are depicted with the fold change of each gene and the p value was calculated by performing a Welch’s t-test. The genes whose absolute value of
 Log2 fold change > 1 (2 folds) and p value < 0.05 were considered as significantly changed genes. Only two genes were significantly changed, one up in red and
 one down in blue, according to this criterion.

Frontiers in Endocrinology | www.frontiersin.org                                  3                                            July 2021 | Volume 12 | Article 573824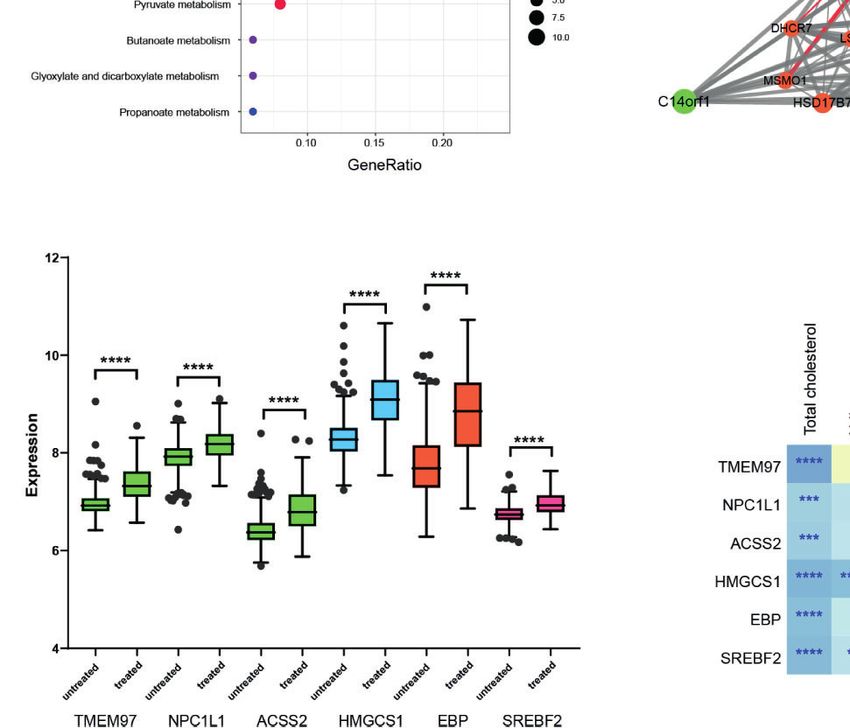
Song et al.                                                                                                                           Statin Altered Liver Transcription

patients (Figure 1C). Together, these results indicated obvious                       distance between each gene pair, the topological overlap measure
alterations in clinical measurements regarding the cholesterol                        (TOM) matrix similarity was adopted. Hierarchical clustering
and glucose metabolism by statin treatment, but minimum gene                          analysis with the average method and dynamic method was used
alternations at the transcription level. Thus we were encouraged                      to build the cluster tree and classify the genes into modules,
to investigate the association of the internal expression                             respectively (Figure 2C). After merging small modules according
organization of the genes in responding to statin treatment to                        to their distances, 18 modules, with sizes ranging from 75 to 6628
reveal subtle but significant differentially expressed genes                           genes, were constructed and randomly assigned with
through their concurrent expression behavior.                                         corresponding artificial colors (Figure S2A). The clustering of
                                                                                      the modules and their correlations based on the module
Construction of Weighted Gene                                                         eigengenes are presented in Figure 2D.
Correlation Network Revealed
18 Gene Modules                                                                       Correlation Test With Clinical Data
We performed an unbiased WGCNA analysis with all annotated                            Uncovered Statin-Related
genes obtained from the liver samples of the patients. Figure 2A                      Co-expression Modules
shows a good clustering feature of the remaining 876 samples                          To investigate the association of statin-related clinical futures
with clinical information of the patients, after removing 34                          and the WGCNA modules, the correlation coefficients and
outlier samples. The co-expression network was then                                   corresponding p‐values between patients’ clinical parameters
constructed with the WGCNA package in the R software. The                             and the eigengenes of each module were calculated. As shown
soft‐threshold (power = 12) was determined based on the                               in Figure 3A, multiple modules showed a significant though
maximal R2 for the scale‐free network, which also had a                               moderate correlation with patients’ clinic signatures. The yellow
relatively high Mean Connectivity (Figure 2B). To evaluate the                        and magenta modules showed a similar behavior of negative

                        A                                                                 B

                        C                                                                 D

 FIGURE 2 | Construction of gene correlation network by Weighted gene co-expression network analysis. (A) Clustering dendrogram of 876 samples and the clinical
 traits. The clustering was based on the expression data of the liver. The color intensity was proportional to higher levels of the indicated parameter. (B) Network
 topology for different soft-thresholding powers. Numbers in the plots represent the corresponding soft thresholding powers, and the approximate scale-free topology
 can be acquired at the soft-thresholding power of 12. (C) Gene dendrogram is based on the same topological overlap with the corresponding color row-indicated
 module colors. A total of 18 modules were identified. The genes which are not coexpressed in any modules are assigned to the gray module. (D) Hierarchical
 clustering dendrogram (upper panel) and the correlation heatmap (lower panel) of each module are according to module eigengenes. Different colors of the abscissa
 and the ordinate represent different modules.

Frontiers in Endocrinology | www.frontiersin.org                                  4                                          July 2021 | Volume 12 | Article 573824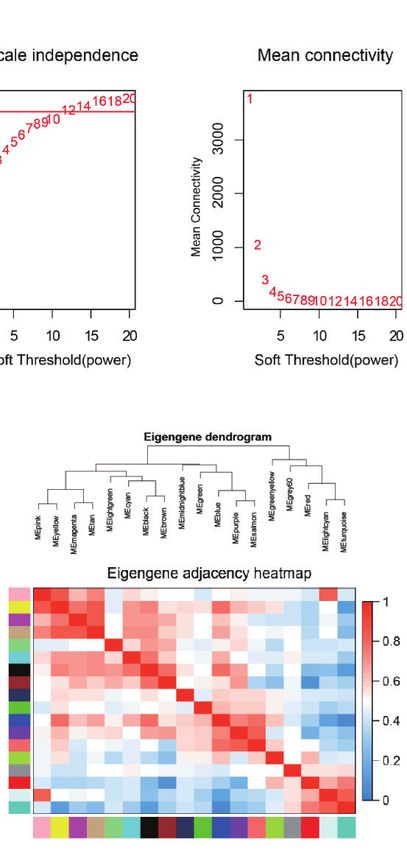
Song et al.                                                                                                                       Statin Altered Liver Transcription

                       A                                                                           B

                       C

                       D

 FIGURE 3 | Identification of the key modules associated with glucose and lipid disorder after statin treatment. (A) Correlation between modules and clinical
 parameters. The significance of each correlation was marked and the color reflects the correlation coefficient. (B) The differences of the module eigengenes of
 each module between statin and non-statin treated patients. The color indicated the corresponding module and Wilcoxon signed-rank test were applied for the
 data that was not normally distributed. (C) Scatter plot for correlation between gene module membership in the light green module and the gene significance of
 the indicated parameters. (D) Scatter plot for correlation between patient green module eigengene and indicated parameters. Data were expressed as mean ± SD.
 *P < 0.05, **P < 0.01, ***P < 0.001, ****P < 0.0001.

correlation with statin treatment, but no significant correlations                   through its clinical readouts. The scatterplots of “The Gene
with metabolic parameters were judged by fasting blood glucose                      Significance vs. Module Membership” of each gene in the light
and HbA1c. The modules of black, grey60, and light green                            green module with statin treatment, HbA1c, fasting blood
showed a possible correlation with multiple blood glucose                           glucose, fasting insulin are plotted respectively in Figure 3C.
parameters and a negative correlation with cholesterol                              There are strong correlations between Gene Significance and
metabolism. However, the black module did not show a                                Module Membership, indicating that the genes with higher
correlation with statin treatment. The comparison of the                            connections with their module members also had a tighter
eigengenes of all 18 modules (Figure S2B) confirmed the                              correlation with glucose disorder phenotypes. It is noteworthy
above findings of four modules that exhibited significant                             that in individual patients, the module eigengenes were positively
differences regarding statin treatment conditions (Figure 3B).                      correlated with HbA1c and fasting blood glucose, and negatively
Together, in both analyses, the light green module showed the                       correlated with Ldl levels (Figure 3D). Additional parameters,
strongest correlation of statin treatment with lower total                          including the age, BMI, total cholesterol, and diastolic blood
cholesterol and Ldl, and higher glucose metabolism, and was                         pressure were also studied and the strong correlation of hub
thus chosen for further investigation.                                              genes in the light green module with age and total cholesterol,
    We then correlated the module membership of each gene,                          and a moderate correlation with diastolic blood pressure were
indicating its hierarchy and connections with other members,                        observed (Figure S8).

Frontiers in Endocrinology | www.frontiersin.org                                5                                         July 2021 | Volume 12 | Article 573824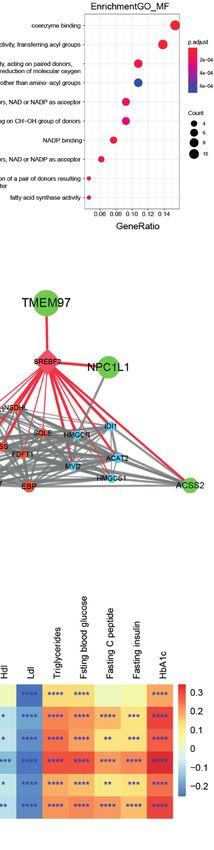
Song et al.                                                                                                                           Statin Altered Liver Transcription

Functional Enrichment of Light Green                                                  function terms of coenzyme binding (GO:0050662), transferase
Genes Indicated the Key Network Altered                                               activity, transferring acyl groups (GO:0016746), oxidoreductase
Upon Statin Treatment in the Liver                                                    activity, acting on paired donors, with incorporation or reduction
To explore the biological functions of the light green module, Gene                   of molecular oxygen (GO:0016705) (Figure 4B). Searching for
Ontology (GO) biological process enrichment analysis was                              KEGG pathway mapping showed that the pathways of Steroid
performed using the clusterProfiler R package. There was                               biosynthesis (hsa00100), Terpenoid backbone biosynthesis
significant enrichment of GO terms in the biology processes of the                     (hsa00900), and Fatty acid metabolism (hsa01212) were enriched
cholesterol biosynthetic process (GO:0006695), secondary alcohol                      in the light green module (Figure 4C). The genes in the string
biosynthetic process (GO:1902653), and sterol biosynthetic process                    of synthesis of cholesterol, campesterol, brassicasterol, and
(GO:0016126) (Figure 4A). there was enrichment in molecular                           stigmasterol were significantly enhanced (Figure S3).

                            A                                                         B

                            C                                                         D

                            E                                                         F

 FIGURE 4 | Functional enrichment and gene network construction of light green genes. (A) The top 10 biology process GO terms in the enrichment analysis of the
 light green genes. (B) The top 10 molecular function GO terms in the enrichment analysis of the light green genes. (C) The top 10 KEGG pathways in the enrichment
 analysis of the light green genes. (D) Protein-protein interaction (PPI) network of genes with a weight value > 0.8 in the light green module was constructed
 according to biological association. The nod size was mapped according to the average shortest path and the width of the edges was mapped according to the
 combined score, indicating the strength. The color indicates the pathway involved in each gene. (E) The differences of indicated genes between statin and non-statin
 treated patients. The color indicates that the corresponding pathway of the gene and the Wilcoxon signed-rank test was applied for the data, but it was not normally
 distributed. (F) Heatmap of the correlation of indicated genes with metabolic parameters. Data were expressed as mean ± SD. *P < 0.05, **P < 0.01, ***P < 0.001,
 ****P < 0.0001.

Frontiers in Endocrinology | www.frontiersin.org                                  6                                           July 2021 | Volume 12 | Article 573824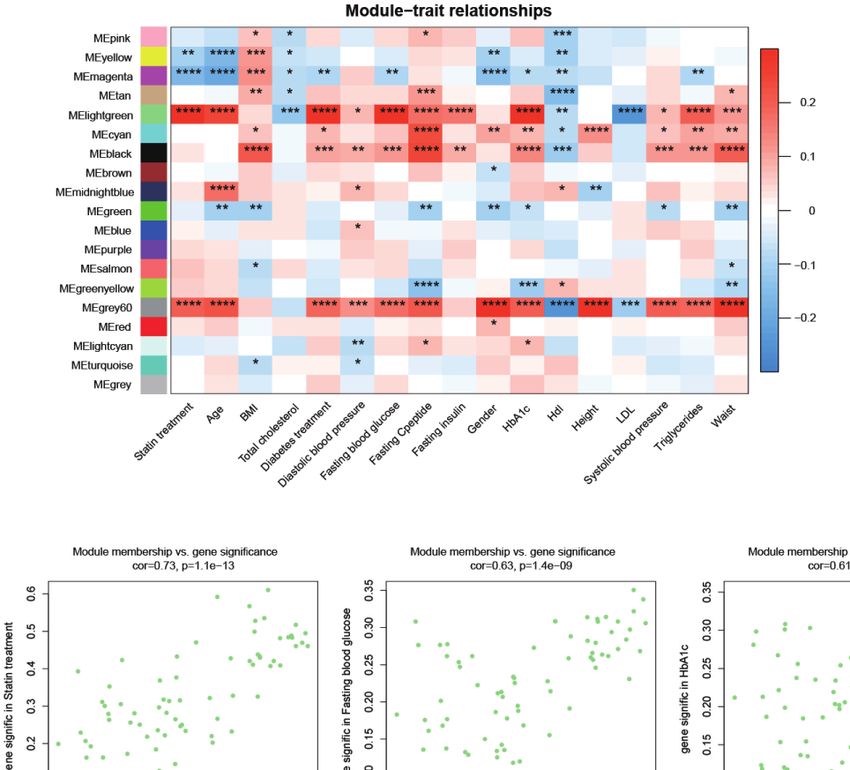
Song et al.                                                                                                                               Statin Altered Liver Transcription

   Since highly connected hub nodes at the center of the                                and terpenoid syntheses in the liver. Finally, the feature genes at core
network’s architecture are more likely to be the key drivers to                         position were validated between statin treated and non-treated
respective cellular functions, the gene correlation network based                       patients (Figure 4E). As shown, all the genes were significantly
on TOM of the light green genes was constructed. The genes that                         higher in statin treated patients (the full profile of light green genes
have a high Module Membership (>0.8) in the light green                                 was shown in Figure S5) and they all showed the same pattern as
module showed tight correlations with each other, suggesting                            the light green module, which was remarkably correlated with
the existence of a functional core (Figure S4A). These genes were                       glucose disorder parameters while negatively correlated with Ldl
then submitted to the String database to construct the biological                       (Figure 4F and Figure S6).
PPI network. As expected, the genes formed a highly connected
network with the transcription factor SREBF2 as a hub gene                              Statin Increased Protein Acetylation
transcriptionally controlling both steroid biosynthesis and                             in Hepatocytes
terpenoid backbone biosynthesis genes that are the major                                Next, we validated the transcriptions of key light green genes in
component enzymes of the mevalonate pathway downstream to                               hepatocytes. A human hepatocyte cell line (LO2) was treated
HMG-CoA reductase. Interestingly, SREBF2 also transcriptionally                         with lovastatin or simvastatin. The treatment of both satins
controls TEMEM97 and NPC1L1, which were suggested to be                                 showed no obvious inhibition of the cell growth at indicated
involved in cell signaling and cholesterol uptake (Figure 4D). In                       concentrations (Figure 5A) suggesting low cytotoxicity to
addition, ACSS2, an enzyme that synthesizes Acetyl-CoA from                             hepatocytes. Consistent with the transcriptome data, the
short-chain fatty acids was also identified as a core member of the                      transcription levels of the key gene SREBF2, ACSS2, NPC1L1,
network. Thus, the hub genes of the light green module were                             and ALDOC et al. were all upregulated after statin treatment in
organized as a tightly connected functional unit involving cellular                     the cells in a dose-dependent manner (Figures 5B, C). ALDOC,
cholesterol uptake, Acetyl-CoA synthesizing as well as cholesterol                      the gene that encodes the Fructose-1,6-Biphosphate

                       A                                                                B

                       C                                                                D

 FIGURE 5 | QPCR validation and analysis of protein acetylation in hepatocytes. (A) LO2 cells were treated with lovastatin or simvastatin for 24 hours. The cell
 viability was analyzed by MTS mothed. The mRNA expressions of indicated genes in LO2 cells after treated with lovastatin (B) or simvastatin (C) for 24 hours were
 tested by real-time quantitative PCR. (D) Western blot analyses of Acetylated lysine, Acetyl-histone H4, and total histone H4 in the LO2 cells after being treated with
 lovastatin, simvastatin, and TSA for 24 hours. Data were expressed as mean ± SD.

Frontiers in Endocrinology | www.frontiersin.org                                    7                                            July 2021 | Volume 12 | Article 573824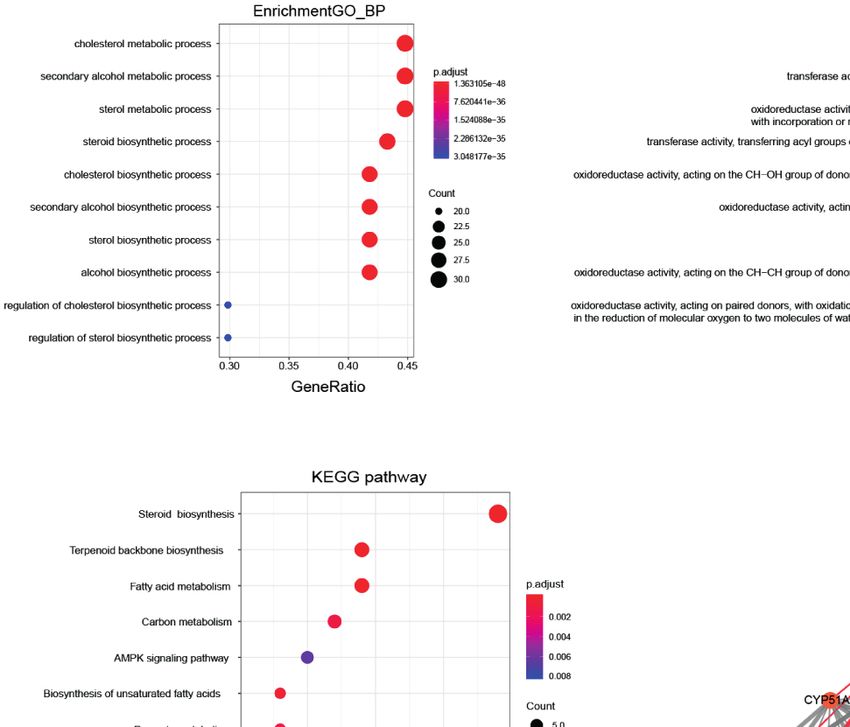
Song et al.                                                                                                         Statin Altered Liver Transcription

Triosephosphate Lyase, was not in the biological annotated                 cholesterol. The generation of transcriptionally active SREBF2
network, but has a high membership score. It was indeed                    is exquisitely dependent upon the content of cholesterol in the
upregulated after statin treatment and the only glucose                    endoplasmic reticulum, which at transcription level auto
metabolism-related gene identified in the expression hub.                   regulates itself, and thus behaves as a cholesterol sensor and
Furthermore, two key genes, ACSS2 and ACLY, which are                      the organizer of cholesterol synthesis (16).
critical for the synthesis of Acetyl-CoA, were also upregulated                TMEM97, which is transcriptionally controlled by SREBF2, is
(Figures 5B, C and Figure S5), suggesting that the protein                 an intracellular orphan receptor that binds numerous drugs and
acetylation in the hepatocytes treated with statin might be                highly expressed in various proliferating cancer cells involving
altered, which may fundamentally affect cellular metabolism                cell survival, morphology, and differentiation (17). It is wide
status (14). Statin moderately induced acetylation of pan-                 phyletic distributed in eukaryotes (in plants, metazoa, and fungi)
protein and histone H4 in the cells, compared with TSA                     and likely to have a fundamental cellular function, but is poorly
treatment (Figure 5D and Figure S9).                                       characterized (17). It was reported to regulate cellular cholesterol
                                                                           homeostasis and has a function of sterol isomerase (18). Under
                                                                           sterol-depleted conditions, it localizes to endo-/lysosomal
DISCUSSIONS                                                                compartments and binds to LDL cholesterol transport-
                                                                           regulating protein Niemann-Pick C1 (NPC1) (19). Whether
A non-bias WGCNA analysis was performed to analyze the                     TMEM97 in the liver may involve the regulation of glucose is
overall internal organization and connections of the genes in the          still an open question. Moreover, in this study, an NPC1 like
transcriptome and to connect the gene modules with the clinical            protein-1 (NPC1L1) was enriched and participated in the core
parameters in overweight patients after statin treatment. One              network. It is critical for the uptake of cholesterol across the
critical module, the light green module, containing 75 genes that          plasma membrane of the intestinal enterocyte (20). Naturally
have a tight correlation with multiple glucose and lipid metabolic         occurring mutations that disrupt NPC1L1 functions were found
parameters, was uncovered. Unlike the DEG findings, the overall             to be associated with reduced plasma LDL cholesterol levels and
module organization of the transcriptome and the connections of            a reduced risk of coronary heart disease (21). The correlation
the genes in the target module were assessed (Figure S7). Key              with TMEM97 revealed in this study suggested that they play a
genes were validated by QPCR in the hepatocytes upon statin                role in regulating cholesterol uptake in the liver.
treatment. Although their expressions were significantly altered in             ACSS2 is an enzyme that synthesizes Acetyl-CoA from short-
the hepatocytes, the underlying molecular function and influence            chain fatty acids (15). It may promote acetate utilization and
on metabolic diseases still required further investigation.                maintains cancer cell growth under metabolic stress, acting as an
    Functional enrichment analysis based on the gene annotation            energy sensor (22). It may also control acetate uptake and
of the light green module revealed a hierarchical network of 21            contribute to fatty acids and under the regulation of SREBF2
genes. These formed a tightly connected hub with functionally              (23). Acetyl-CoA is the metabolite central to cholesterol
close relation to the core, which was largely transcriptionally            synthesis, fatty acid synthesis, isoprenoid synthesis, and
controlled by SREBF2, but not SREBF1, in which most of the                 protein/histone acetylation, etc. (24, 25). Notably, another
members are enzymes of the mevalonate pathway downstream to                enzyme, ACLY, which catabolizes Acetyl-CoA from citrate was
HMG-CoA reductase, the target of statin, and participate Steroid           also significantly upregulated in the patients who received statin.
and Terpenoid backbone biosyntheses, suggest a counter                     Thus, the levels of Acetyl-CoA were likely enriched in the cells
reaction of the liver as the consequence of a low detecting level          due to the upregulation of lipid importer as well as various ways
of cellular/plasma cholesterol resulting from statin treatment             of Acetyl-CoA biosynthesis, and the inhibition of the utilization
(Ldl from 3.12 to 2.64 mmol/l, p= 5.639e-09, total cholesterol             of it to synthesize steroids with the presence of statin. The hyper
from 5.00 to 4.65 mmol/l, p= 0.0002258). This robust reaction              acetylation of proteins may fundamentally affect cellular
across the livers of the statin treated patients indicated that the        metabolism (26).
cholesterol sensing system was likely compromised in                           Interestingly, the current study did enrich a fructose
overweight/high blood cholesterol patients, although a negative            metabolic gene, ALDOC, which has been implicated in obesity
feedback mechanism to suppress the cholesterol synthesis genes             and type II diabetes (27). Whether the increased expression of
was triggered, but at a higher Ldl level. Notably, at a reduced            this gene is involved in a higher level of blood glucose in statin
stringency of module membership, a secondary network                       treated patients and the potential mechanism are currently not
involving Fatty acid metabolism genes was also identified along             known. Moreover, a manual inspection of genes involving
with an increase of the blood triglycerol levels in the patients who       gluconeogenesis, glycogenolysis, as well as lipid transporters
received statin treatment (Figure S1 and Figure S4B). Whether              such as CD36 and FABPs, etc. did not observe significant
this observation is due to an increase of the cytoplasmic Acetyl-          upregulation. Thus, the current analysis of transcriptome in
CoA levels resulting from the inhibition of the HMGCR function             the livers of statin treated patients did not provide direct
has not yet been tested and is controversial (15), and further             information on statin-caused glucose metabolic disorders.
investigation is warranted.                                                However, the literature did indicate the harmful effect of statin
    SREBF2 is a well-known key transcriptional regulator in                on b cells and muscles (5, 28), which is beyond the scope of the
cholesterol biosynthesis that is sensitive to low levels of                current study.

Frontiers in Endocrinology | www.frontiersin.org                       8                                    July 2021 | Volume 12 | Article 573824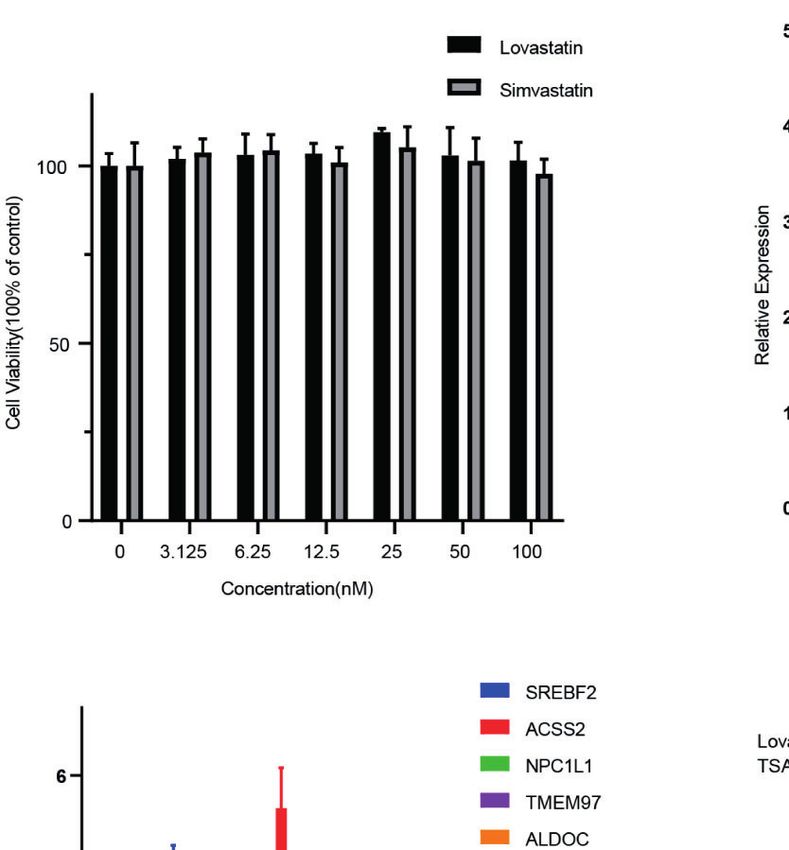
Song et al.                                                                                                                             Statin Altered Liver Transcription

CONCLUSION                                                                           National Natural Science Foundation of China (No. 82070912),
                                                                                     the Key Project of Research and Development of Ningxia Hui
In this study, the transcriptome of the livers of obesity and                        Autonomous Region of China (No. 2017BN04), and a grant from
hypercholesterolemia patients was re-analyzed by Weighted gene                       the Natural Science Foundation of Jiangsu Province China (No.
co-expression network analysis. A multiple module organization                       BK20171347 and BE2019676).
was revealed that was related to various clinical metabolic
parameters. Specifically, a lipogenic expression hierarchical
network involving both cholesterol and fatty acid syntheses in                       SUPPLEMENTARY MATERIAL
the liver of statin treated patients was identified, which is
centered by SREBF2 and highly coexpressed at the                                     The Supplementary Material for this article can be found online
transcription level. QPCR validated the consistency of the key                       at: https://www.frontiersin.org/articles/10.3389/fendo.2021.
genes of the network in the hepatocytes upon statin treatment.                       573824/full#supplementary-material
The upregulation of the key enzymes involved in the synthesis of
                                                                                     Figure S1 | Boxplot of clinical parameters between statin treated and non-treated
Acetyl-CoA induced gentle global acetylation of pan-protein in
                                                                                     patients. *P < 0.05, ****P < 0.0001, ns no significant.
hepatocytes and acetylation of histone H4. Overall, this study
provides insight into the effect of statin on transcriptional and                    Figure S2 | (A) Barplot of counts of genes of each module. The counts were log
post-transcriptional regulation of genes in the liver.                               transformed. (B) Boxplot of module eigengenes between statin treated and non-
                                                                                     treated patients. ***P < 0.001, ****P < 0.0001.

                                                                                     Figure S3 | KEGG pathways of (A) steroid biosynthesis, (B) terpenoid backbone
DATA AVAILABILITY STATEMENT                                                          biosynthesis (C) free fatty metabolism. Genes in the light green module are marked
                                                                                     red.
The raw data supporting the conclusions of this article will be
                                                                                     Figure S4 | (A) Interaction network of high membership genes in the light green
made available by the authors, without undue reservation.                            module according to TOM. The size of the nod was mapped to its membership
                                                                                     score. (B) Interaction network of genes in the light green module involving fatty acid
                                                                                     metabolism according to string interaction. The size of the nod was mapped to the
                                                                                     number of directly interacting nods. The width of the edge was mapped to the
AUTHOR CONTRIBUTIONS                                                                 combined score.

SS, HW, and QG designed the work and wrote the manuscript.                           Figure S5 | Boxplot of the expression of the genes in the light green module
MN, QL, and LW retrieved and analyzed the transcriptome data.                        between statin treated and none treated patients. Except for “ns” marked genes, all
                                                                                     other genes showed a significant difference.
SS and HM performed the QPCR and WB assays. YP prepared
the figures. All authors read and approved the final manuscript.                       Figure S6 | Heatmap of the correlation of the genes in the light green module with
                                                                                     indicated clinical parameters. Genes shown in Figure 4F are marked with *.

                                                                                     Figure S7 | (A) Correlation matrix according to Spearman's rank correlation
FUNDING                                                                              coefficient of top 25 DEGs between statin treated and non-treated patients.
                                                                                     (B) Correlation matrix according to Spearman's rank correlation coefficient of all the
This work was supported by grants from the National Key R&D                          light green genes.
Program of China (2020YFC2005600/01), the Fundamental
                                                                                     Figure S8 | Scatter plot for correlation between patient green module eigengene
Research Funds for the Central Universities (0214-14380509),
                                                                                     and indicated parameters.
the National Key R&D Program of China (2018YFC2001800,
2020YFC2005100, 2020YFC2005300), the Science and                                     Figure S9 | Coomassie Brilliant Blue staining of the total protein of LO2 cells
Technology Program of Karamay City (2018HM014A), the                                 receiving lovastatin, simvastatin, and TSA treatment.

                                                                                           Impaired Glucose Homeostasis in Severely Obese Patients. BMC Med
REFERENCES                                                                                 Genomics (2019) 12(1):80–9. doi: 10.1186/s12920-019-0536-1
                                                                                      7.   Langfelder P, Horvath S. Eigengene Networks for Studying the Relationships
 1. Blüher M. Obesity: Global Epidemiology and Pathogenesis. Nat Rev                       Between Co-Expression Modules. BMC Syst Biol (2007) 1:54. doi: 10.1186/
    Endocrinol (2019) 15(5):288–98. doi: 10.1038/s41574-019-0176-8                         1752-0509-1-54
 2. Chooi YC, Ding C, Magkos F. The Epidemiology of Obesity. Metabolism               8.   Sean D, Meltzer PS. GEOquery: A Bridge Between the Gene Expression
    (2019) 92:6–10. doi: 10.1016/j.metabol.2018.09.005                                     Omnibus (GEO) and BioConductor. Bioinformatics (2007) 23(14):1846–7.
 3. Ortega Loubon C, Ferná ndez Molina M, Singh G, Correa R. Obesity and its              doi: 10.1093/bioinformatics/btm254
    Cardiovascular Effects. Diabetes/Metabolism Res Rev (2019) 35(4):e3135.           9.   Ritchie ME, Phipson B, Wu D, Hu Y, Law CW, Shi W, et al. Limma Powers
    doi: 10.1002/dmrr.3135                                                                 Differential Expression Analyses for RNA-Sequencing and Microarray
 4. Ward NC, Watts GF, Eckel RH. Statin Toxicity. Circ Res (2019) 124(2):328–              Studies. Nucleic Acids Res (2015) 43:e47. doi: 10.1093/nar/gkv007
    50. doi: 10.1161/CIRCRESAHA.118.312782                                           10.   Yu G, Wang L, Han Y, He Q. Clusterprofiler: An R Package for Comparing
 5. Thompson PD, Panza G, Zaleski A, Taylor B. Statin-Associated Side Effects.             Biological Themes Among Gene Clusters. OMICS (2012) 16(5):284–7.
    J Am Coll Cardiol (2016) 67(20):2395–410. doi: 10.1016/j.jacc.2016.02.071              doi: 10.1089/omi.2011.0118
 6. Margerie D, Lefebvre P, Raverdy V, Schwahn U, Ruetten H, Larsen P, et al.        11.   Szklarczyk D, Gable AL, Lyon D, Junge A, Wyder S, Huerta-Cepas J, et al.
    Hepatic Transcriptomic Signatures of Statin Treatment are Associated With              STRING V11: Protein-Protein Association Networks With Increased

Frontiers in Endocrinology | www.frontiersin.org                                 9                                              July 2021 | Volume 12 | Article 573824
Song et al.                                                                                                                                  Statin Altered Liver Transcription

      Coverage, Supporting Functional Discovery in Genome-Wide Experimental               22. Schug ZT, Peck B, Jones DT, Zhang Q, Grosskurth S, Alam IS, et al. Acetyl-
      Datasets. Nucleic Acids Res (2019) 47(D1):D607–13. doi: 10.1093/nar/gky1131             CoA Synthetase 2 Promotes Acetate Utilization and Maintains Cancer Cell
12.   Shannon P, Markiel A, Ozier O, Baliga NS, Wang JT, Ramage D, et al.                     Growth Under Metabolic Stress. Cancer Cell (2015) 27(1):57–71. doi: 10.1016/
      Cytoscape: A Software Environment for Integrated Models of Biomolecular                 j.ccell.2014.12.002
      Interaction Networks. Genome Res (2003) 13(11):2498–504. doi: 10.1101/              23. Luong A, Hannah VC, Brown MS, Goldstein JL. Molecular Characterization
      gr.1239303                                                                              of Human Acetyl-CoA Synthetase, an Enzyme Regulated by Sterol Regulatory
13.   R. C. Team. R: A Language and Environment for Statistical Computing.                    Element-Binding Proteins. J Biol Chem (2000) 275(34):26458–66.
      Vienna, Austria (2019).                                                                 doi: 10.1074/jbc.M004160200
14.   Pietrocola F, Galluzzi L, Bravo-San Pedro JM, Madeo F, Kroemer G. Acetyl            24. Dieterich IA, Lawton AJ, Peng Y, Yu Q, Rhoads TW, Overmyer KA, et al.
      Coenzyme A: A Central Metabolite and Second Messenger. Cell Metab (2015)                Acetyl-CoA Flux Regulates the Proteome and Acetyl-Proteome to Maintain
      21(6):805–21. doi: 10.1016/j.cmet.2015.05.014                                           Intracellular Metabolic Crosstalk. Nat Commun (2019) 10:3929. doi: 10.1038/
15.   Huang Z, Zhang M, Plec AA, Estill SJ, Cai L, Repa JJ, et al. ACSS2 Promotes             s41467-019-11945-9
      Systemic Fat Storage and Utilization Through Selective Regulation of Genes          25. Mews P, Donahue G, Drake AM, Luczak V, Abel T, Berger SL. Acetyl-CoA
      Involved in Lipid Metabolism. Proc Natl Acad Sci (2018) 115(40):E9499–506.              Synthetase Regulates Histone Acetylation and Hippocampal Memory. Nature
      doi: 10.1073/pnas.1806635115                                                            (2017) 546(7658):381–6. doi: 10.1038/nature22405
16.   Sato R, Inoue J, Kawabe Y, Kodama T, Takano T, Maeda M. Sterol-Dependent            26. Bechmann LP, Hannivoort RA, Gerken G, Hotamisligil GS, Trauner M,
      Transcriptional Regulation of Sterol Regulatory Element-Binding Protein-2.              Canbay A. The Interaction of Hepatic Lipid and Glucose Metabolism in
      J Biol Chem (1996) 271(43):26461–4. doi: 10.1074/jbc.271.43.26461                       Liver Diseases. J Hepatol (2012) 56(4):952–64. doi: 10.1016/j.jhep.2011.08.025
17.   Alon A, Schmidt HR, Wood MD, Sahn JJ, Martin SF, Kruse AC. Identification            27. Oppelt SA, Zhang W, Tolan DR. Specific Regions of the Brain are Capable of
      of the Gene That Codes for the ς2 Receptor. Proc Natl Acad Sci (2017) 114               Fructose Metabolism. Brain Res (2017) 1657:312–22. doi: 10.1016/
      (27):7160–5. doi: 10.1073/pnas.1705154114                                               j.brainres.2016.12.022
18.   Sanchez-Pulido L, Ponting CP. TM6SF2 and MAC30, New Enzyme                          28. Zhang Y, Liang M, Sun C, Qu G, Shi T, Min M, et al. Statin Use and Risk of
      Homologs in Sterol Metabolism and Common Metabolic Disease. Front                       Pancreatic Cancer An Updated Meta-Analysis of 26 Studies. Pancreas (2019)
      Genet (2014) 5:439. doi: 10.3389/fgene.2014.00439                                       48(2):142–50. doi: 10.1097/MPA.0000000000001226
19.   Ebrahimi-Fakhari D, Wahlster L, Bartz F, Werenbeck-Ueding J, Praggastis M,
      Zhang J, et al. Reduction of TMEM97 Increases NPC1 Protein Levels                   Conflict of Interest: The authors declare that the research was conducted in the
      and Restores Cholesterol Trafficking in Niemann-Pick Type C1                         absence of any commercial or financial relationships that could be construed as a
      Disease Cells. Hum Mol Genet (2016) 25(16):3588–99. doi: 10.1093/hmg/               potential conflict of interest.
      ddw204
20.   Garcia-Calvo M, Lisnock JM, Bull HG, Hawes BE, Burnett DA, Braun MP,                Copyright © 2021 Song, Niu, Liang, Wang, Min, Peng, Wang and Gao. This is an
      et al. The Target of Ezetimibe is Niemann-Pick Cl-Like 1 (Npc1l1). Proc Natl        open-access article distributed under the terms of the Creative Commons Attribution
      Acad Sci USA (2005) 102(23):8132–7. doi: 10.1073/pnas.0500269102                    License (CC BY). The use, distribution or reproduction in other forums is permitted,
21.   Stitziel NO, Won H, Morrison AC, Peloso GM, Do R, Lange LA, et al.                  provided the original author(s) and the copyright owner(s) are credited and that the
      Inactivating Mutations in NPC1L1 and Protection From Coronary                       original publication in this journal is cited, in accordance with accepted academic
      Heart Disease. N Engl J Med (2014) 371(22):2072–82. doi: 10.1056/                   practice. No use, distribution or reproduction is permitted which does not comply with
      NEJMoa1405386                                                                       these terms.

Frontiers in Endocrinology | www.frontiersin.org                                     10                                             July 2021 | Volume 12 | Article 573824
You can also read