The Sequencing-Based Mapping Method for Effectively Cloning Plant Mutated Genes
←
→
Page content transcription
If your browser does not render page correctly, please read the page content below
International Journal of
               Molecular Sciences

Article
The Sequencing-Based Mapping Method for Effectively
Cloning Plant Mutated Genes
Li Yu † , Yanshen Nie † , Jinxia Jiao, Liufang Jian and Jie Zhao *

                                             State Key Laboratory of Hybrid Rice, College of Life Sciences, Wuhan University, Wuhan 430072, China;
                                             2012102040065@whu.edu.cn (L.Y.); nie_ys@whu.edu.cn (Y.N.); 2016202040087@whu.edu.cn (J.J.);
                                             jianliufang@whu.edu.cn (L.J.)
                                             * Correspondence: jzhao@whu.edu.cn
                                             † These authors contributed equally to this work.

                                             Abstract: A forward genetic approach is a powerful tool for identifying the genes underlying the
                                             phenotypes of interest. However, the conventional map-based cloning method is lengthy, requires a
                                             large mapping population and confirmation of many candidate genes in a broad genetic region to
                                             clone the causal variant. The whole-genome sequencing method clones the variants with a certain
                                             failure probability for multiple reasons, especially for heterozygotes, and could not be used to clone
                                             the mutation of epigenetic modifications. Here, we applied the highly complementary characteristics
                                             of these two methods and developed a sequencing-based mapping method (SBM) for identifying the
                                             location of plant variants effectively with a small population and low cost, which is very user-friendly
                                             for most popular laboratories. This method used the whole-genome sequencing data of two pooled
                                             populations to screen out enough markers. These markers were used to identify and narrow the

                                             candidate region by analyzing the marker-indexes and recombinants. Finally, the possible mutational
                                      sites were identified using the whole-genome sequencing data and verified in individual mutants.
Citation: Yu, L.; Nie, Y.; Jiao, J.; Jian,   To elaborate the new method, we displayed the cloned processes in one Arabidopsis heterozygous
L.; Zhao, J. The Sequencing-Based            mutant and two rice homozygous mutants. Thus, the sequencing-based mapping method could
Mapping Method for Effectively               clone effectively different types of plant mutations and was a powerful tool for studying the functions
Cloning Plant Mutated Genes. Int. J.         of plant genes in the species with known genomic sequences.
Mol. Sci. 2021, 22, 6224. https://
doi.org/10.3390/ijms22126224                 Keywords: map-based cloning; whole-genome sequencing; heterozygote; rice

Academic Editor:
Pedro Martínez-Gómez

                                             1. Introduction
Received: 7 May 2021
Accepted: 5 June 2021
                                                   In the studies of plant genes, the mutant is a very important and effective tool for it is
Published: 9 June 2021
                                             the direct embodiment of loss and the most convincing evidence of gene function. To clone
                                             the mutated genes, many methods have been invented and used. For example, Genome
Publisher’s Note: MDPI stays neutral
                                             Walking and Tair-PCR (Thermal Asymmetric Interlaced PCR) were employed to identify
with regard to jurisdictional claims in
                                             the mutated sites induced by the insertion of T-DNA, and TILLING (Targeting Induced
published maps and institutional affil-      Local Lesions IN Genomes) was invented for the cloning of the mutational sites induced by
iations.                                     EMS (Ethyl methyl sulfonate) [1–3]. The most popular methods are the conventional map-
                                             based cloning method and the whole-genome sequencing method, including SHOREmap
                                             and MutMap [4–7].
                                                   The conventional map-based cloning methods are illustrated in Figure S1 and could
Copyright: © 2021 by the authors.
                                             be used for all types of mutation, including DNA deletion, DNA insertion, the mutation
Licensee MDPI, Basel, Switzerland.
                                             of a single nucleotide and the mutation of epigenetic modifications (Figure S1) [4]. For
This article is an open access article
                                             good effect, it needs a good mapping population that can be used to screen out enough
distributed under the terms and              markers and that is big enough to get the lines that harbor the crossover near the mutated
conditions of the Creative Commons           site [8–12]. However, the available markers are usually different between the different
Attribution (CC BY) license (https://        hybrid combinations and difficult to identify, using the conventional method [13,14]. Many
creativecommons.org/licenses/by/             plants, especially for crops like rice and maize, need more space to plant the large map-
4.0/).                                       ping populations, which is very difficult for many laboratories [11,15,16]. Besides, hybrid

Int. J. Mol. Sci. 2021, 22, 6224. https://doi.org/10.3390/ijms22126224                                             https://www.mdpi.com/journal/ijms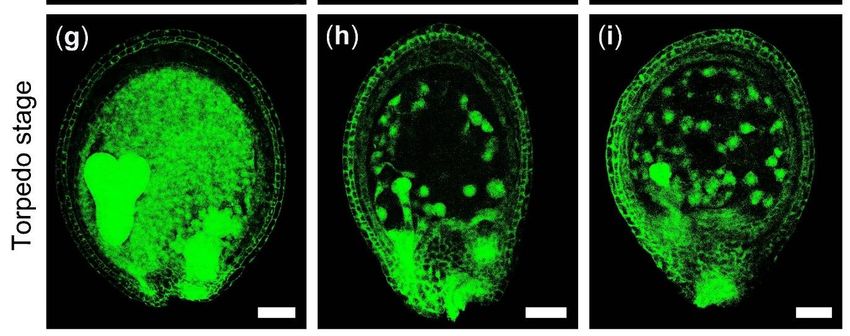
Int. J. Mol. Sci. 2021, 22, 6224                                                                                             2 of 18

                                   plants, such as rice, either display serious abortion in F1 generation, resulting in insufficient
                                   numbers of F2 populations, or have fewer SSR markers, making it difficult to meet the
                                   requirements of map-based cloning [17–19]. Moreover, the target region is usually about
                                   30–500 kb using the conventional map-based cloning method and there are about 5–100 can-
                                   didate genes for verification and complementation which take a long time [16,17]. These
                                   restrict the application of conventional map-based cloning methods. The whole-genome
                                   sequencing method was invented to clone the mutations using next-generation sequencing
                                   (NGS) technology which provides an unprecedented wealth of high-resolution genotypic
                                   information. Thus, the whole-genome sequencing method overcomes many traditional
                                   difficulties, such as time-consuming genetic assays and a big planting space. Based on
                                   the whole-genome sequencing method, many different strategies have been invented to
                                   analyze the sequencing data and to identify causative mutations more effectively, like
                                   SHOREmap, NGM (next-generation mapping) and MutMap [5–7]. In spite of this, there
                                   are many unassociated polymorphisms which segregate with the causative mutation, se-
                                   quences different from the ‘reference genome’, and biases of the genome sequencing for
                                   their sequencing depth is generally no more than 40×, leading to some large gaps and
                                   a low signal-to-noise ratio. To overcome these problems, either multiple backcross with
                                   parents, or bulk analysis of a very large number of mutant lines with high depth, or genome
                                   sequencing of many individual plants from the same mutant, or a de novo assembly of
                                   the genomic gap region are performed to improve cloning efficiency, however, the cost
                                   also increases which is not favorable for the ordinary small laboratories [7,20–23]. Even if
                                   these are achieved, it is still difficult to clone the target genes in the species with complex
                                   and large genomes for the existence of the repetition of large fragments. Besides, many
                                   homozygous mutants could not survive for some genes were indispensable for the survival
                                   of sporophytes or gametophytes, thus only heterozygotes could be used to clone the target
                                   genes. The heterozygotes harbor smaller marker indexes around the mutated sites com-
                                   pared to the homozygotes and produce lower signal-to-noise ratio, making it more difficult
                                   to clone the mutational sites using the whole-genome sequencing method. Moreover, the
                                   whole-genome sequencing method could not be used to clone the mutation of epigenetic
                                   modification for there is no difference of sequence in these mutants. Thus, there is no
                                   heterozygous or epigenetic mutant that has been cloned by the whole-genome sequencing
                                   method, and a more effective and simple method is needed to address these issues.
                                         Here, we screened out some rice and Arabidopsis mutants, and planned to use the
                                   whole-genome sequencing method to clone the mutated genes. However, we failed to
                                   get the target genes of five mutants and only got the mutated gene of one Arabidopsis
                                   homologous mutant. To clone the target genes, we improved the conventional map-based
                                   cloning method and introduced the whole-genome sequencing technology to generate a
                                   new method—the sequencing-based mapping method (SBM). We used the whole-genome
                                   sequencing data to screen out enough markers, and then, the marker-indexes and re-
                                   combinants of these phenotype-linked markers were analyzed to identify and narrow the
                                   candidate region. Finally, possible mutational sites were identified using the whole-genome
                                   sequencing data and verified in the mutant. Based on this new method, the mutated sites
                                   of three rice homologous mutants and two Arabidopsis heterozygous mutants were cloned
                                   using a small mapping population. The cloning procedures of one Arabidopsis heterozygous
                                   mutant and two rice homologous mutants are shown here to illustrate this method.

                                   2. Results
                                   2.1. Cloning Procedure of Mutant Genes by Using SBM
                                        The sequencing-based mapping method (SBM) was based on the whole-genome-
                                   sequencing technique and used to clone the mutants in the species with known genomic
                                   information. This method could be used to clone all types of mutations efficiently, especially
                                   the heterozygous mutants. The procedure of the method in heterozygous and homologous
                                   mutants of the diploid species consists of four steps and is described in Figure 1 and
                                   Figure S2 respectively.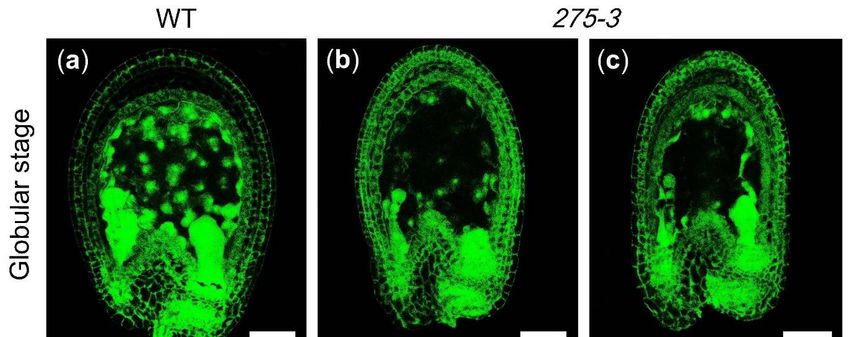
Int. J. Mol. Sci. 2021, 22, 6224                                                                                                 3 of 18

      Figure 1. The simplified cloning scheme for the heterozygous mutant. Step One: the heterozygous mutant was crossed with
      WT of the other variety four times to generate the BC3 F1 population. Step Two: about 30–200 heterozygous plants of BC3 F1
      population were selected to extract DNA, and the DNA samples were mixed with equimolar of each, resequenced, and
      analyzed. The markers (mainly SNP and InDel) were identified and their marker indexes were calculated to identify the
      high-quality markers for identifying the candidate regions using the MutMap method. Step Three: the BC3 F1 population
      was used for the analysis of the recombinants at the phenotype-linked markers to identify and narrow the candidate region
      with the markers which were downloaded from the sharing platform on the internet or identified from the resequencing
      results. Step Four: using the resequencing genome data, the mutational sites (the ∆marker-index was about 0.5) in the target
                                                                   2
      region were identified.
                                         Step One: Construction of the mapping population. The heterozygous mutants
                                   that could not produce homozygous mutants and their heterozygotes exhibited a certain
                                   abortion rate of seeds (about 0.25–0.5). This suggested that the heterozygotes should be
                                   crossed with WT (wildtype) of the closely related variety for the offspring obtained from
                                   the cross of distant varieties exhibited a certain abortion rate of seeds. For example, the
                                   cross between Arabidopsis ecotype Columbia (Col) mutant and Landsberg erecta (Ler), or
                                   between rice japonica varieties, could produce F1 plants that showed almost no abortion. In
                                   the heterozygotes, half of the target genes were mutated and their marker indexes were
                                   0.5, therefore, we chose BC3 F1 population (the marker indexes of the phenotype-linked
                                   markers were about 0.5 while the marker indexes of the phenotype-unlinked markers were
                                   about 0.0625), but not the F2 population (the marker indexes of all the markers were about
                                   0.5), as the mapping population (Figure 1).
                                         Step Two: Whole-genome sequencing. About 30–200 heterozygous plants of BC3 F1
                                   population were selected to extract their DNAs, mixed with an equimolar of each, rese-
                                   quenced, and analyzed. The SNP (single nucleotide polymorphism), InDel (insertion and
                                   deletion), structural variations (SV, mainly insertion and deletion of large fragments) and
                                   copy number variation (CNV) were identified and analyzed to calculate their marker index,
                                   the rate of one parent-type allele. The high-quality alleles, whose supported reads were
                                   more than eight, were identified and used to calculate their ∆marker-index (mainly SNP
                                   and InDel). The ∆marker-index plots were drawn and the average distributions of the
                                   ∆marker index were produced using the MutMap method to identify the candidate regions
                                   and sites (Figure 1). If the numbers of the candidate mutated sites were very few and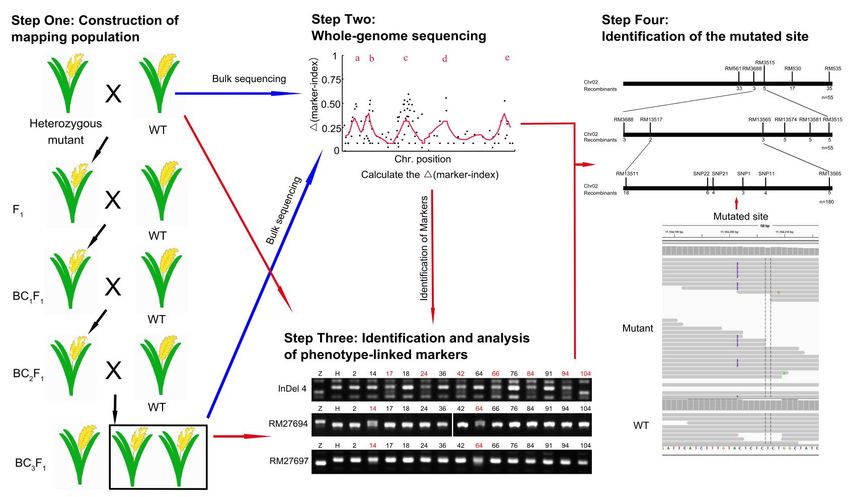
Int. J. Mol. Sci. 2021, 22, 6224 4 of 18
the mutated gene was verified among them by the DNA-sequencing technology, then the
cloning experiments could be finished. However, all the heterozygous mutants failed to
produce the target genes by only using the whole-genome sequencing method. Thus, more
work should be done to clone the target genes.
Step Three: Identification and analysis of phenotype-linked markers. More than
30 heterozygous plants of the BC3 F1 population were used for analyzing the marker index
and the recombinant of the phenotype-linked markers to identify and narrow the location
region of the target genes. The experimental effect would be better if the number of plants
were higher, however, this would increase the workload and need more planting space.
Based on our experiment, it was found that the 30–100 plants used in this step would be
appropriate to achieve better experimental effect with less workload and planting space.
BC2 F1 population also could be used here if cloning the target genes as soon as possible was
desirable and there were enough markers. The markers (most were repeat sequence-based
markers) were downloaded from the sharing platform on the internet or identified from the
resequencing results in Step Three. The markers around the candidate region got in Step
Three were the priority choices. Then, the allele polymorphisms of these markers among
the individuals were detected by PCR (Polymerase Chain Reaction) and the markers linked
to the phenotype characters were identified. For the recombinants of the markers located
at different sides of the target gene were different and their marker indexes would be close
to 0.5, the target gene could be narrowed among two markers (Figure 1).
Step Four: Identification of the mutated site. After the candidate region was found,
the mutational site (the ∆marker-index is about 0.5) in the target region was identified by
using the resequencing genome data when the sequence of the mutated gene was changed,
and the mutated site was verified in the recombinants (Figure 1). When the mutants were
caused by the changes of the epigenetic modifications around the target genes, the target
region could be obtained and the candidate target genes could be identified by RNA-seq or
RT-PCR (Real time-PCR).
For the homologous mutants, we crossed them with the closely related varieties to
produce F1 generation without abortion, and then the F2 population was used as the
mapping population (Figure S2). The following procedures were similar to the cloning
method of the heterozygous mutants except that the marker indexes and ∆marker indexes
near the mutated site were about 1.
To illustrate this method in detail, the cloning processes of one Arabidopsis heterozy-
gous mutant and two rice homologous mutants, whose mutated sites were not obtained by
the whole-genome sequencing method, are shown below.
2.2. Cloning Process of Arabidopsis Heterozygous Mutant 275-3
The mutant 275-3 was one of the embryo-defective mutants purchased from Arabidopsis
Biological Resource Center (http://abrc.osu.edu/; accessed on 7 June 2021). During the
vegetative developmental stage, the features of heterozygous mutant 275-3 were similar to
WT (Col), but abnormal albino ovules in its silique were produced during the reproductive
development stage (Figure 2a,b). The detailed data of the heterozygous mutant 275-3
exhibited that there were 26.49% albino ovules (n = 789) and 69.35% offspring (n = 62)
producing albino ovules, implying the phenotype of 275-3 was controlled by a recessive
gene (Table 1). To research the cause of the albino ovules, we cleared the 275-3 ovules
at different developmental stages and found that the embryos of the albino ovules were
stagnating in the globular stage compared to WT (Figure 2c–h). In the globular stage
of the WT ovules, the embryos in the albino ovules were still below 16 cells, indicating
that the embryo development was delayed (Figure 2c,f). As the WT ovules developed to
form the torpedo embryos, the embryos of the albino ovule were still in the early globular
stage, although its number of embryonic cells increased (Figure 2d,e,g,h). Meanwhile,
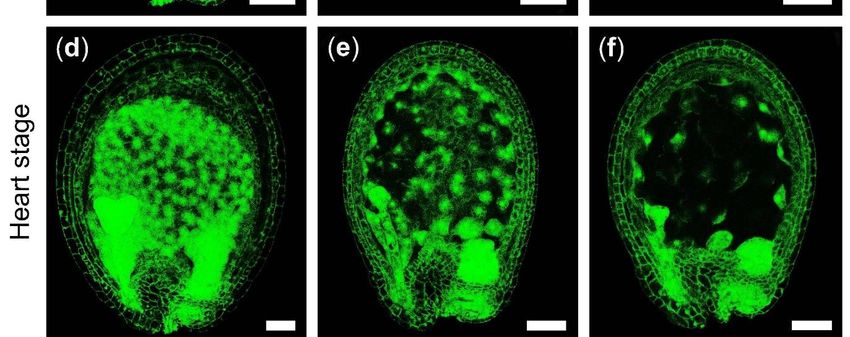
the endosperm development in globular, heart and torpedo stages were also observed
by detecting the endosperm auto-fluorescence. The results showed that the endosperm
free nuclei of WT increased quickly from the globular stage to the torpedo stage, while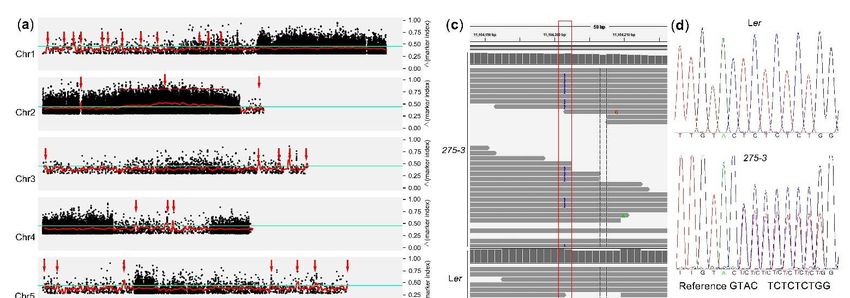
Int. J. Mol. Sci. 2021, 22, 6224                                                                                                             5 of 18

                                     the number of endosperm free nuclei was significantly less in 275-3, indicating that the
Int. J. Mol. Sci. 2021, 22, x FOR PEER REVIEW
                                     development of endosperm in 275-3 was slower than in WT (Figure 3). All of the above                               6 of 21
                                     showed that the development of the embryo and the endosperm were both affected and
                                     the ovules were stagnating in the globular stage, leading to the abortion of seeds.

      Figure 2. The phenotype of Arabidopsis mutant 275-3. (a) The silique of WT. (b) The silique of Arabidopsis mutant 275-3; the
      Figure   2. The
      red asterisks     phenotype
                     indicated       of Arabidopsis
                                the albino            mutant
                                            ovules. (c–e)       275-3.
                                                           The WT       (a) The
                                                                    ovules       silique
                                                                            at the globularof WT.
                                                                                              stage(b)
                                                                                                    (c),The
                                                                                                        earlysilique   of Arabidopsis
                                                                                                               heart stage  (d) and themutant
                                                                                                                                        torpedo275-3; the
      red
      stageasterisks
            (e). (f–h).indicated  theinalbino
                         The ovules            ovules.
                                         the mutant    (c−e)
                                                     275-3     The WT
                                                            at which  WTovules
                                                                           ovulesatwere
                                                                                      the globular   stagestage
                                                                                          at the globular  (c), early   heartheart
                                                                                                                  (f), early  stage  (d) and
                                                                                                                                   stage      the torpedo
                                                                                                                                         (g) and
      stage  (e). (f−h).
      the torpedo   stageThe
                           (h).ovules
                                The barsinwere
                                           the mutant
                                                1 mm in275-3    at (b),
                                                          (a) and  whichandWT   ovules
                                                                            50 µm         were at the globular stage (f), early heart stage (g) and
                                                                                     in (c–h).
      the torpedo stage (h). The bars were 1 mm in (a) and (b), and 50 μm in (c−h).
                                            To clone the mutated gene, firstly, we crossed 275-3 with another ecotype Ler (Lands-
                                      berg erecta) to produce F1 generation. The mutant of the F1 generation was backcrossed with
                                      Ler three times to get BC2 F1 population and BC3 F1 population. In the BC1 F1 and BC2 F1 gen-
Int. J. Mol. Sci. 2021, 22, 6224                                                                                                   6 of 18

                                         erations, the abortion ratios of the mutant were 20.66% and 22.73% respectively, confirming
                                         that the mutant 275-3 was caused by a recessive gene (Table 1). Because there were enough
                                         markers between Arabidopsis ecotype Col and Ler, and we wanted to cut down the time of
                                         gene cloning, Step Three was performed earlier using the 39 plants of BC2 F1 population
                                         to identify and narrow the region where the target gene was located, through analysis of
                                         the phenotype-linked markers and their recombinants. We downloaded and synthesized
                                         the primers of SSLP (simple sequence length polymorphism) markers from TAIR database
                                         (The Arabidopsis Information Resource, https://www.arabidopsis.org/servlets/mapper;
                                         accessed on 7 June 2021). The marker indexes (the rate of Col-type gametophyte) of 25 SSLP
                                         markers were calculated. The results showed that only the indexes of markers in Chro-
                                         mosome 2 were more than 0.4 (Table S1). Among them, the indexes of F3P11 and T20P8
                                         both were 0.4872, implying that the mutated gene was around here. Two other markers,
                                         F27L4 and T19L18, were chosen to analyze the marker indexes with PCR technology,
                                         indicating that they were 0.4872 and 0.5, respectively. Besides, the PCR results showed
                                         that the 13th plant was the recombinant at T23K3, T12H3, F3P11 and F27L4, which was
                                         different from the recombinant (the 25th plant) at T16B24 and T20P8, telling us that the
                                         target region was about 1.53Mbp between F27L4 (Chr2: 10,068,751 bp) and T20P8 (Chr2:
                                         11,595,846 bp) (Figure S3).
                                               After the BC3 F1 population formed, Step Two was performed and the DNA pool
                                         of 136 BC3 F1 plants was resequenced with 40× depth through the second-generation
                                         sequencing technology as the mutant sample, while the DNA pool mixed with 20 Ler
                                         plants was resequenced as the control. The sequencing data was mapped on the Arabidopsis
                                         reference genome (Col). The polymorphic loci (mainly SNP and InDel) were identified and
                                         their ∆marker indexes were calculated. All of these data were analyzed using MutMap
                                         method [7]. The average distributions of the ∆marker-index showed that there were
                                         30 candidate regions with the threshold 0.45 (Figure 4a). The regions were too many to get
                                         the right one and there also were too many mutated sites in the most likely region (Chr2:
                                         7~17 M). Thus, it was difficult to clone the target gene only using the MutMap method.
                                      Table 1. The abortion ratios of Arabidopsis mutant 275-3 and its progenies.

                                    Number of the                Number of the                Number of the
        Plants                                                                                                      Abortion Rate (%)
                                   Abortive Ovules               Normal Ovules                 Total Ovules
        275-3                            209                            580                          789                  26.49
        BC1 F1                           275                           1331                         1173                  20.66
        BC2 F1                           235                            799                         1034                  22.73
        Col-0                             8                            1199                         1207                  0.66
         Ler                              2                            1116                         1118                  0.18

                                              To clone the target gene, we used the genome sequencing data in the cloning procedure,
                                         and verified the SSLP primers downloaded from TAIR database with the resequencing
                                         data as described as Step Three. Five markers between F27L4 and T20P8 were selected to
                                         analyze their polymorphisms in the BC3 F1 recombinants at F27L4 and T20P8. The results
                                         showed that the 58th plant was recombinant at T28I24, F27A10, and T22F11 while the
                                         26th, 63rd and 65th plants were recombinants at F12C20 and T9J22 (Figure 4b). Thus,
                                         the mutated gene was in the 0.54Mbp region between T22F11 (Chr2: 10,779,026 bp) and
                                         T9J22 (Chr2: 11,328,569 bp). In this region (Chr2: 10,779,026 bp-11,328,569 bp), only one
                                         mutation was found in the exon after removing the sequence difference between Col and
                                         Ler. A cytosine was inserted after Chr2: 11,104,201 bp leading to the shift of At2g26060 ORF
                                         (open reading frame) (Figure 4c). Then, the DNA fragment containing this mutated site
                                         was cloned and sequenced. The results of four mutant plants showed that the mutant 275-3
                                         was a heterozygote; one allele was the same as WT while the other had one extra cytosine
                                         (Figure 4d). In Arabidopsis, At2g26060 encoded a homolog of the yeast cytosolic iron-sulfur
                                         protein assembly protein 1 (also known as CIA1). It was reported that AtCIA1 formed a
                                         complex with AtAE7, AtNAR1 and AtMET18 to promote the transfer of Fe-S clusters to the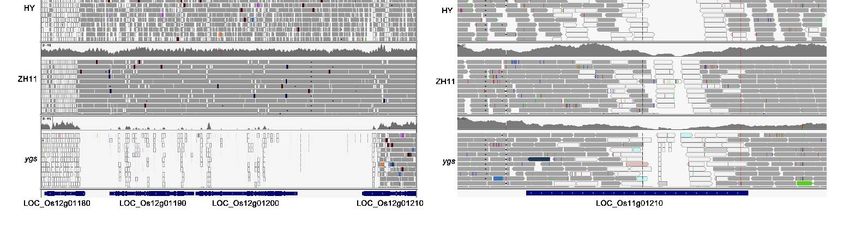
Int. J. Mol. Sci. 2021, 22, 6224                                                                                           7 of 18

                                        apoprotein located in the cytoplasm and nucleus, which was essential for maintaining the
                                        integrity of Arabidopsis genome [24]. The mutation of AtCIA1 produced albino ovules and
                                        stagnation embryo phenotypes, similar to the mutant 275-3 [24]. Therefore, we thought
Int. J. Mol. Sci. 2021, 22, x FOR PEER REVIEW                                                                                 7 of 21
                                        that the mutation of AtCIA1 was the cause of the phenotypes of the heterozygous mutant
                                        275-3 (Figure 4e).

     Figure 3. The developmental process of endosperm in Arabidopsis mutant 275-3. (a,d,g) WT ovules. (b,c,e,f,h,i) The ovules
        Figure 3. The developmental process of endosperm in Arabidopsis mutant 275-3. (a,d,g) WT ovules. (b,c,e,f,h,i) The ovules
     in the mutant 275-3. Scale bars = 50 μm.
        in the mutant 275-3. Scale bars = 50 µm.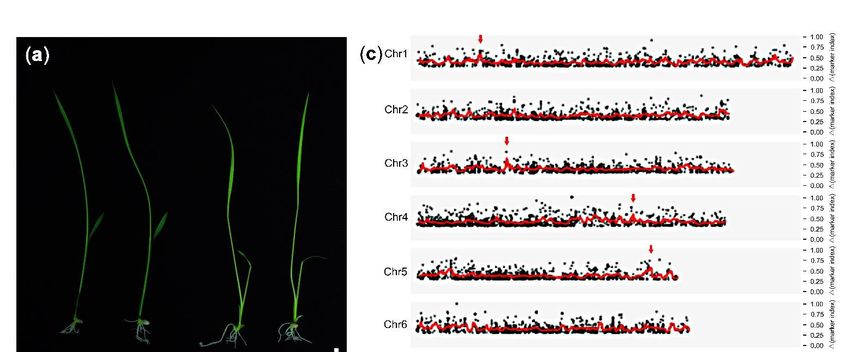
Int. J. Mol. Sci. 2021, 22, 6224 8 of 18
Int. J. Mol. Sci. 2021, 22, x FOR PEER REVIEW 9 of 21
Figure
Figure 4.
4. The
The cloning
cloning data
data ofof CIA1
CIA1 in
in the
the mutant
mutant 275-3
275-3 ofof Arabidopsis.
Arabidopsis. (a)
(a) The
The Δmarker-index
∆marker-index plots plots of
of the
the mutant
mutant 275-3
275-3
generated
generated by the analysis of MutMap. The red lines represent the sliding window average ∆marker-index values
by the analysis of MutMap. The red lines represent the sliding window average Δmarker-index values of
of the
the
100Kb interval with 20kb increments. The blue lines indicated the threshold 0.45 to identify the candidate regions. (b) The
100Kb interval with 20kb increments. The blue lines indicated the threshold 0.45 to identify the candidate regions. (b) The
PCR results of some SSLP markers in the fine mapping of 275-3. The plants of recombinants at F27L4 or T20P8 were used
PCR results of some SSLP markers in the fine mapping of 275-3. The plants of recombinants at F27L4 or T20P8 were used to
to analyze the recombinants at some markers (at the left side) and the red numbers indicate the recombinants. T28I24,
analyze the
F27A10, recombinants
T22F11, at some
T19L18, T9J22 markers
and F12C20(at the
are left side)
located and the
around red10,382,120
Chr2: numbers indicate
bp, Chr2:the10,516,283
recombinants. T28I24,
bp, Chr2: F27A10,
10,779,026
T22F11, T19L18, T9J22 and F12C20 are located around Chr2: 10,382,120 bp, Chr2: 10,516,283 bp, Chr2:
bp, Chr2: 11,061,880 bp, Chr2: 11,328,569 bp and Chr2: 11,462,271 bp, respectively. C, Col; L, Ler. (c) The whole-genome 10,779,026 bp, Chr2:
11,061,880 bp,
sequencing Chr2:at11,328,569
results the mutatedbp and
siteChr2: 11,462,271
in 275-3 and WT bp,using
respectively.
the IGVC,software.
Col; L, Ler.
(d)(c)
TheThe whole-genome
sequencing sequencing
results of DNA
fragments containing
results at the mutated the in 275-3 and
site mutated site WT
in WT andthe
using 275-3.
IGV (e) The cloning
software. (d) Theprocedure
sequencingof CIA1
resultsinofArabidopsis.
DNA fragments containing
the mutated site in WT and 275-3. (e) The cloning procedure of CIA1 in Arabidopsis.
To clone the target gene, we used the genome sequencing data in the cloning
2.3. Cloning
procedure, and Process of Ricethe
verified Mutant
SSLPygsprimers downloaded from TAIR database with the
resequencing
Apart from datatheasArabidopsis
described mutant,
as Step Three.
we alsoFive
usedmarkers between
the improved F27L4toand
method T20P8
clone rice
were selectedmutants
homologous to analyze thattheir
were polymorphisms
not cloned by theinwhole-genome
the BC3F1 recombinants
sequencingat F27L4 Rice
method. and
T20P8.
mutantThe ygs results showedseedling)
(yellow-green that the 58th plantthe
without was recombinant
insertion of T-DNAat T28I24, F27A10,from
was obtained and
T22F11 while the 26th, 63rd and 65th plants were recombinants
the RISD DB (Rice T-DNA Insertion Sequence Database) and its background was cultivar at F12C20 and T9J22
(Figure
Hwayoung 4b). (HY).
Thus, The
the mutant
mutatedygs gene was
seeds in the 0.54Mbp
germinated region
to produce between T22F11
yellowish-green (Chr2:
seedlings,
10,779,026
which faded bp)asand
theyT9J22 (Chr2: 11,328,569
grew (Figure 5a). Finally,bp). In this ygs
the mutant region (Chr2:
turned 10,779,026
white and died.bp- In
11,328,569 bp), onlywhether
order to determine one mutation was found
the phenotype in the
of the exon ygs
mutant after
wasremoving
controlled thebysequence
a single
difference between Col
gene, we calculated theand Ler. A cytosine
phenotypic was inserted
segregation ratio andafter
foundChr2:
that11,104,201 bp leading
the segregation ratio
of the
to the shift
individuals derived
of At2g26060 from
ORF heterozygotes
(open was 2.58:1
reading frame) (Figure(green: yellowish-green
4c). Then, = 62: 24),
the DNA fragment
which wasthis
containing consistent
mutated with
sitethewasexpected genetic
cloned and segregation
sequenced. The ratio 3:1of(pfour
results = 0.53, Chi square
mutant plants
test), indicating
showed that the275-3
that the mutant mutant wasygs was a recessive
a heterozygote; onetrait controlled
allele was the by a single
same as WTgene
whilein
HY.other
the To clone the YGS
had one extragene,
cytosineheterozygote YGS/ygs
(Figure 4d). was crossed
In Arabidopsis, the japonica
with encoded
At2g26060 cultivar
a homolog
Zhonghua
of the yeast11 to get the
cytosolic F2 population
iron-sulfur as assembly
protein described protein
by the Step One
1 (also in Figure
known S2. Contrary
as CIA1). It was
to expectations, the ratio of the homologous mutant ygs in the
reported that AtCIA1 formed a complex with AtAE7, AtNAR1 and AtMET18 to promote progenies derived from the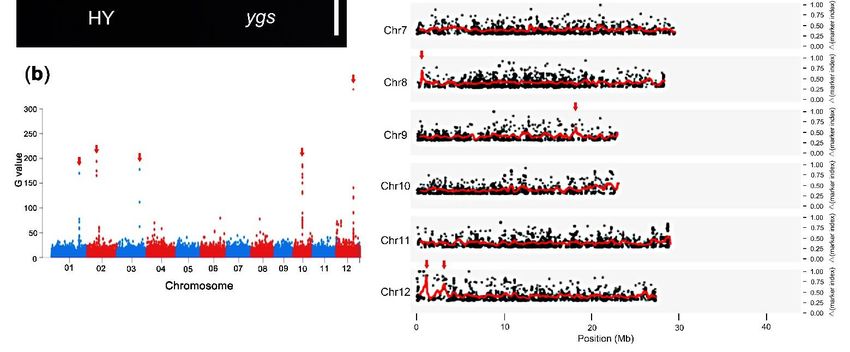
Int. J. Mol. Sci. 2021, 22, 6224                                                                                               9 of 18

                                   cross (Zhonghua 11♀× ygs♂) was 8.1% (3/37) that was close to 1/16, implied that ygs in
Int. J. Mol. Sci. 2021, 22, x FOR PEER REVIEW    might be controlled by two recessive genes. The result was different11from
                                       F2 population                                                                     of 21
                                   the segregation ratio in HY, therefore, we proposed that one gene, essential for the ygs
                                   phenotype, might be mutated in the cultivar HY but not in the cultivar Zhonghua 11.

      Figure 5. The phenotype of rice mutant ygs and the cloning data using the whole-genome sequencing method. (a) The
       Figure 5. The phenotype of rice mutant ygs and the cloning data using the whole-genome sequencing method. (a) The
      phenotype of 7DAG seedlings in rice mutant ygs. Bar was 25 mm. (b) The Manhattan plot of the G values. The red arrows
       phenotype of 7DAG seedlings in rice mutant ygs. Bar was 25 mm. (b) The Manhattan plot of the G values. The red arrows
      indicated the 5 most likely candidate sites. (c) The ∆marker-index plots of the mutant ygs generated by the analysis of
       indicated the 5 most likely candidate sites. (c) The Δmarker-index plots of the mutant ygs generated by the analysis of
      MutMap.
       MutMap. The
                 The red
                      red lines
                          lines represent
                                represent the
                                          the sliding
                                              sliding window    average ∆marker-index
                                                      window average     Δmarker-index values
                                                                                       values of
                                                                                              of the
                                                                                                 the 100
                                                                                                     100 Kb
                                                                                                         Kb interval
                                                                                                             interval with
                                                                                                                      with 20
                                                                                                                           20 kb
                                                                                                                              kb
      increments.  The red  arrows indicated the most  likely candidate sites.
       increments. The red arrows indicated the most likely candidate sites.

                                        Then,
                                         Then, we
                                                weperformed
                                                    performedStep
                                                                StepTwo
                                                                     Twoof of
                                                                           thethe
                                                                               SBMSBMmethod to sequence
                                                                                        method          the ygs
                                                                                                to sequence  thepool mixedmixed
                                                                                                                 ygs pool   with
                                   equal  DNA   of 32 ygs plants and the HY   pool mixed with equal  DNA  of 30 HY  plants
                                   with equal DNA of 32 ygs plants and the HY pool mixed with equal DNA of 30 HY plants    using
                                   the Illumina sequencing platform. The sequencing data of the ygs pool was 40× depth,
                                   using the Illumina sequencing platform. The sequencing data of the ygs pool was 40×
                                   while the HY pool was 20×. The clean data was screened out and mapped on the rice refer-
                                   depth, while the HY pool was 20×. The clean data was screened out and mapped on the
                                   ence genome and the RGAP 7.0 gene modes (http://rice.plantbiology.msu.edu/pub/data/
                                   rice      reference      genome        and       the     RGAP       7.0      gene      modes
                                   Eukaryotic_Projects/o_sativa/annotation_dbs/pseudomolecules/version_7.0/; accessed
                                   (http://rice.plantbiology.msu.edu/pub/data/Eukaryotic_Projects/o_sativa/annotation_dbs
                                   on 7 June 2021). We identified the variants SNP and InDel, and excluded the markers whose
                                   /pseudomolecules/version_7.0/; accessed on 7 June 2021). We identified the variants SNP
                                   supported read numbers were not more than eight. Then, we performed two analysis
                                   and InDel, and excluded the markers whose supported read numbers were not more than
                                   methods to identify the candidate sites. Firstly, we calculated the G value of SNP and
                                   eight. Then, we performed two analysis methods to identify the candidate sites. Firstly,
                                   drew the Manhattan plot to identify the phenotype-linked markers (Figure 5b). The top
                                   we calculated the G value of SNP and drew the Manhattan plot to identify the phenotype-
                                   linked markers (Figure 5b). The top 0.1% sites were considered as the candidates, and 83
                                   possible sites appeared, five of which were the most likely sites (Figure 5b, Table S2).
                                   Meanwhile, we calculated the Δmarker indexes of the SNP and InDel markers and
                                   analyzed them using MutMap [7]. The average distributions of the △marker-index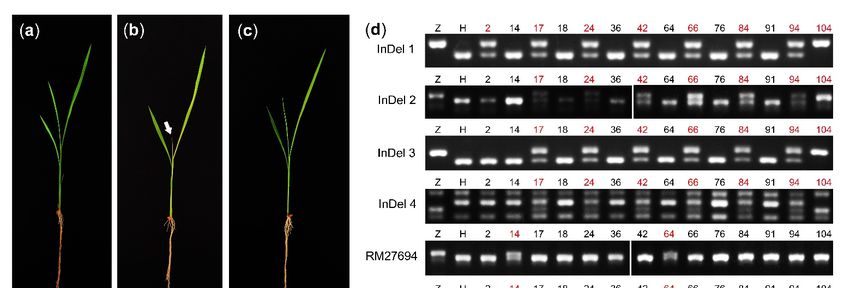
Int. J. Mol. Sci. 2021, 22, 6224                                                                                       10 of 18

                                   0.1% sites were considered as the candidates, and 83 possible sites appeared, five of which
                                   were the most likely sites (Figure 5b, Table S2). Meanwhile, we calculated the ∆marker
                                   indexes of the SNP and InDel markers and analyzed them using MutMap [7]. The average
                                   distributions of the ∆marker-index showed that there were eight candidate regions in seven
                                   chromosomes with the threshold 0.6 (Figure 5c).
                                         However, the candidate sites were too many and further analysis found that the
                                   target gene was not in these candidate regions obtained by the above methods, hence
                                   we conducted Step Three of the sequencing-based mapping method. The primers of
                                   SSR (simple sequence repeat) markers were downloaded from Gramene database (https:
                                   //archive.gramene.org/markers/microsat/; accessed on 7 June 2021) and verified by the
                                   resequencing data. The 36 markers were chosen for PCR to analyze their marker indexes
                                   in the ygs mutant, and the results of seven plants showed that only one possible marker
                                   RM1080 (Chr12: 906,291 bp) was linked to the target site for its marker-index was 0.9286,
                                   which was close to 1 (Table S3). Besides RM1080, we also screened out another two markers
                                   to clone this target gene in 25 ygs mutants. The recombinants at RM1880 (Chr12: 747,262 bp)
                                   and at RM1080 both were the 4th and 14th plants, while there were seven recombinants
                                   at RM27618 (Chr12: 3,804,685 bp) (Figure 6a). For the 4th plant, there were recombinants
                                   at the three markers, we thought that three markers were located in the same side of
                                   the target gene. To get the target gene, we analyzed the SNP and InDel markers around
                                   this region (Chr12: 1 bp-747,261 bp) and removed the markers whose ∆marker indexes
                                   were lower than 0.5. As the ∆marker indexes around the target gene should be 1, the
                                   target region was narrowed in the region (Chr12: 80,442 bp-747,261 bp) (Figure 6b). Using
                                   IGV (Integrative Genomics Viewer) software, we screened out variants in this region in
                                   the sample ygs, HY and ZH11 (Zhonghua 11, which was sequenced in another project),
                                   and found that there was a 23.5Kb gap in ygs but not in HY and ZH11, indicating that
                                   the gap might be a mutation in ygs but not caused by sequencing technology (Figure 6c).
                                   The deletion of the 23.5 Kb sequence led to the mutation of four genes, and one of them,
                                   LOC_Os12g01210, encoded a pentatricopeptide repeat-containing protein. This gene has
                                   been reported by Mao et al. and has functional redundancy with LOC_Os11g01210. It
                                   was reported that the simultaneous mutation of LOC_Os12g01210 and LOC_Os11g01210
                                   produced an etiolated seedling and could not form mature plants [25], which was similar
                                   to our observed phenotypic feature in ygs. To verify that the phenotype of the ygs mutant
                                   was caused by the mutation of LOC_Os12g01210 and LOC_Os11g01210, we observed the
                                   sequencing data of LOC_Os11g01210 in ygs, HY and Zhonghua 11, and found that there
                                   was a ~300 bp deletion in HY but not in Zhonghua 11 (Figure 6d). Thus, we thought that
                                   the phenotype of the ygs mutant was caused by the double mutation of LOC_Os12g01210
                                   (OsYGS1) and LOC_Os11g01210 (OsYGS2).

                                   2.4. Cloning Process of Rice Mutant abs
                                        Meanwhile, another rice mutant was also obtained from the RISD DB (Rice T-DNA
                                   Insertion Sequence Database) and its background was cultivar HY. The new mutant ger-
                                   minated normally and grew like WT for about ten days. Then, the abnormality of the
                                   mutant appeared: the green of the third leaf faded and the newly emerged fourth leaf was
                                   white and chlorotic (Figure 7a,b). After that, the growth of the mutant was arrested and
                                   the seedlings died gradually, Thus, this mutant was named as abs (abnormal seedling). To
                                   clone the mutated site, we crossed abs with ZH11 to get the mapping F2 population, and
                                   calculated the segregation ratio in the F2 population. In 227 plants, there were 50 mutants
                                   which exhibited a 3.54:1 segregation ratio and was consistent with the expected genetic
                                   segregation ratio 3:1 (p = 0.30, Chi square test). This implied that the abs mutant was
                                   controlled by a recessive gene.
Int. J. Mol. Sci. 2021, 22, 6224
Int. x FOR PEER REVIEW 13 of
11 of 18
21
Figure 6. The cloning data and information using the sequencing-based mapping method. (a) The PCR results of three SSR
Figure 6.inThe
markers the cloning data and
fine mapping information
of ygs. The markersusing
are the sequencing-based
shown mapping
at the left side and the redmethod.
numbers(a) The PCR
indicated theresults of three
recombinants.
SSR markers in the fine mapping of ygs. The markers are shown at the left side and the red numbers indicated the
Z, Zhonghua 11; H, Hwayoung; RM1880, RM1080 and RM27618 are located around Chr12: 747,262 bp, Chr12: 906,291 bp
recombinants. Z, Zhonghua 11; H, Hwayoung; RM1880, RM1080 and RM27618 are located around Chr12: 747,262 bp,
and Chr12:
Chr12: 3,804,685
906,291 bp respectively.
bp and (b) The
Chr12: 3,804,685 bp cloning data of(b)
respectively. OsYGS1, the reddata
The cloning brace
ofindicates
OsYGS1,the thecandidate
red braceregion and the
indicates the
red arrow indicates
candidate region andthethe
sitered
of OsYGS1. (c) The the
arrow indicates whole-genome sequencing
site of OsYGS1. (c) The data at the site ofsequencing
whole-genome OsYGS1 (LOC_Os12g01210)
data at the site of
viewed
OsYGS1by(LOC_Os12g01210)
IGV software. (d) viewed
The whole-genome sequencing
by IGV software. (d) Thedata at the site of OsYGS2
whole-genome sequencing (LOC_Os11g01210) viewed
data at the site of by
OsYGS2
IGV software.
(LOC_Os11g01210) viewed by IGV software.
Then, the
2.4. Cloning abs DNA
Process pool
of Rice of 50 abs
Mutant plants was resequenced on the Illumina sequencing plat-
form with 40× depth as described in Step Two. The clean data was screened out and mapped
Meanwhile, another rice mutant was also obtained from the RISD DB (Rice T-DNA
on the rice reference genome and the RGAP 7.0 gene modes (http://rice.plantbiology.msu.
Insertion Sequence Database) and its background was cultivar HY. The new mutant
edu/pub/data/Eukaryotic_Projects/o_sativa/annotation_dbs/pseudomolecules/version_
germinated normally and grew like WT for about ten days. Then, the abnormality of the
7.0/; accessed on 7 June 2021. The data was analyzed with the resequencing data of Hway-
mutant appeared: the green of the third leaf faded and the newly emerged fourth leaf was
oung and Zhonghua 11 to identify the variants (SNP, InDel, SV and CNV). The ∆marker
white and chlorotic (Figure 7a,b). After that, the growth of the mutant was arrested and
indexes of SNP were analyzed using the MutMap method and the average distributions
the seedlings died gradually, Thus, this mutant was named as abs (abnormal seedling). To
of the ∆marker-index showed that there were 14 candidate regions in seven chromosomes
clone the mutated site, we crossed abs with ZH11 to get the mapping F2 population, and
with the threshold 0.5 (Figure S4).
calculated
Then, the segregation
we conducted ratio
Step in the
Three F2 population.
to identify In 227linked
the markers plants,
tothere were 50site
the mutated mutants
using
which exhibited a 3.54:1 segregation ratio and was consistent with the expected
the SSR primers used in the cloning of OsYGS1/2. The results of 30 plants showed that genetic
the
segregation
marker ratio
indexes of 3:1
two(pmarkers,
= 0.30, Chi square
RM1080 andtest). This were
RM1880, implied that
more the0.7,
than absimplying
mutant that
was
controlled
the mutated bysite
a recessive
was linked gene.
to the two markers but not to the candidate regions identified
by the MutMap method (Table S4). As the recombinants at RM1080 and RM1880 were the
same and most were different from the recombinants at RM519, we concluded that the
mutated site of abs was located between RM1080 and RM519 (Figure S5). In this region,
another five SSR markers were screened out using the resequencing data and the Gramene
database (https://archive.gramene.org/markers/microsat/; accessed on 7 June 2021). The
PCR results showed that the recombinants at RM27618 were the 6th, 8th, 15th, 19th and
26th plant which were different from the recombinants at RM27715 (the 1st, 3rd, 5th and
29th plant), and there was no recombinant at RM27694 and RM27697 (Figure S5). Thus, the
mutational site should be in the 1.32M region between RM27618 (Chr12: 3,804,685 bp) and
RM27715 (Chr12: 5,189,063 bp).Int. J. Mol. Sci. 2021, 22, 6224 12 of 18
Figure 7. The phenotype of abs and cloning of OsABS gene: (a) 14 DAG seedling of Hwayoung (HY); (b) 14 DAG seedling
of abs. The white arrow indicated the chlorotic fourth leaf; (c) 14 DAG complementary seedling of abs. (d) The analysis
of recombinants around the mutated site in abs. All the plants used here were the recombinants at RM27618 or RM27715,
and the red number indicated the recombinant. InDel 1, InDel 2, InDel 3, InDel 4, RM27694 and RM27697 are located
3
around Chr12: 4,070,394 bp, Chr12: 4,187,138 bp, Chr12: 4,400,174 bp, Chr12: 4,403,614 bp, Chr12: 4,814,750 bp and Chr12:
4,920,770 bp, respectively. Z, Zhonghua 11; H, Hwayoung. (e) The whole-genome sequencing results at the mutated site in
abs, HY and ZH11 using the IGV software. A thymine (Chr12: 4,710,533 bp, indicated in the black box) was converted to
adenine. (f) The cloning procedure of OsABS. Bars were 2 cm in (a–c).
This region was still too long with too many candidate variants, so we chose another
4 InDel markers from the resequencing data and another 106 mutants of the F2 population to
narrow the target region. Exclude the false-positive plants, 14 recombinants at RM27618 or
RM27715 were found and used for later research (Figure S6). The PCR results showed that
there were the same recombinants (17th, 24th, 42nd, 66th, 84th, 94th and 104th) at InDel 2,
InDel 3 and InDel 4, which were different from the recombinants at RM27694 and RM27697
(14th and 64th) (Figure 7d). These indicated that the mutational site was between InDel
4 (Chr12: 4,403,614 bp) and RM27694 (Chr12: 4,814,750 bp). In this region, we screened
the variants using the resequencing data and found that there were two variants and only
one located in the exon. With the help of IGV software, we found that a thymine (Chr12:
4,710,533 bp) was converted to adenine, leading to the conversion of Ile403 to Asn403 in
LOC_Os12g09000. (Figure 7e,f). Then, the genetic co-separation experiment verified that
this site was tightly linked to the phenotype of abs and the transgene of LOC_Os12g09000
genomic sequence complemented the phenotype of abs (Figure 7c). Thus, LOC_Os12g09000
was the target gene and this gene was essential for the survival of rice seedlings.Int. J. Mol. Sci. 2021, 22, 6224 13 of 18
3. Discussion
In the study of genes, the forward genetic approach is a powerful tool for identifying
genes, based on phenotypes of interest, which cannot be done by the reverse genetic
approach. Unfortunately, the forward genetic approach is limited by the fact that it is
very difficult to map the causative mutational sites. The most popular methods are the
conventional map-based cloning method and the whole-genome sequencing method,
including SHOREmap and MutMap [4–7]. The advantages of the conventional map-based
cloning method are that it can clone all the types of mutation, including the deletion or
insertion of several Kb of DNA fragments and the mutation of epigenetic modifications,
and can get the area containing the target gene exactly (Table 2). Its downsides are that it is
lengthy, requires a large mapping population and confirmation of many candidate genes in
a broad genetic region to characterize the causal variant (Table 2) [8–16]. The whole-genome
sequencing method accelerates the identification of causal mutations by defining the
mapping regions and identifying genetic variants simultaneously. However, it could not be
used to clone the mutation of epigenetic modification and to clone the variants with a certain
failure probability for multiple reasons, especially for heterozygotes (Table 2) [26–29]. Only
one of six mutants was cloned successfully and no mutated genes of heterozygous mutants
were found in our assay. Thus, we applied the highly complementary characteristics of the
two methods and developed the sequencing-based mapping method to clone genes that
were not obtained by the whole-genome sequencing method in the diploid species with
known genomic information.
Table 2. Comparison of different cloning methods.
Mutation Number of Planting Number Cloning
Methods Time a
Types Population Plants Room of Pools b Efficiency c
Conserved
map-based All 3–5 years >600 large 0 ++
cloning
Sequencing-
based mapping All 1–2 years 30–200 small 2 +++
(SBM)
Whole-genome Homologous
170–390 days 20–200 small 2 +
sequencing SNP and InDel
GWAS All >170 days >200 large >10 +++
a:The costing time was calculated in rice, based on the following calculation criteria: the time for rice to grow one generation was 110 days,
the time for resequencing and data processing was 30 days, the time for the verification of the mutated sites was 30 days, and all the
procedures were thought to be performed well. b : The pools here were thought to be resequenced. c : Cloning efficiency represented the
success rate for each method. + represented low success rate; ++ represented medium success rate; +++ represented high success rate.
Through the use of this new mapping method, we cloned six genes in five mutants
of rice and Arabidopsis, and cited three examples in this report. The cloning process of
Arabidopsis heterozygous mutant 275-3 showed that the whole-genome sequencing method
obtained many candidate regions and a very broad region for the background noise, but
failed to get the target gene. With the help of recombinant analysis, we found the right
candidate region and narrowed the target region. Finally, with the help of the whole-
genome sequencing data, the mutated site was obtained. In the cloning of rice mutant
ygs and abs, we identified many markers and found the mutated sites after identifying
the target regions by using SBM. In these process, 32 F2 plants for ygs, 136 F2 plants for
abs and 136 BC3 F1 plants for 275-3 were used for the fine mapping, while the numbers
of plants used in the conventional map-based cloning method needed to be more than
600 plants [8–12,16,30]. So, this method just needed a small greenhouse to plant the
mapping population, this is very user-friendly for most popular laboratories. The GWAS
analysis (genome wide association study) also can achieve this goal by resequencing more
than 10 pools (some are more than 100 pools) of plants and has the advantage of identifying
many genes underlying the same phenotype or different phenotypes at the same time,Int. J. Mol. Sci. 2021, 22, 6224 14 of 18
especially in the research of a complex quantitative trait. However, it is more expensive
which is a heavy burden for the popular laboratories (Table 2) [21,31]. Moreover, the SBM
could also be used to clone the mutation of epigenetic modifications. We used it to get one
candidate region in an embryo-defective mutant. In this region, no sequence changes had
been found, and the two markers beside it were linked to the phenotype. We planned to
use the RNA-seq method to identify the target gene and expected to get it. Thus, the SBM
could clone different types of plant mutations effectively, and it is a powerful tool for the
study of the functions of plant genes in diploid species with known genomic information.
In the polyploid species, the ratio of the homozygous genotypes in hybrid progenies is
very low in the F2 population (1/36 in the tetraploid species) and there are more than three
kinds (tetraploid species) of genotypes of heterozygotes, which makes the calculation of the
allele-ratio index (marker index in Step Three) very difficult. It was found that the ratios
of the homozygous genotypes at the phenotype-unlinked markers should be less than
or about 1/36 (tetraploid species), while the ratios of the homozygous genotypes at the
phenotype-linked markers are closer to 1.0. Therefore, if the SBM is used in the polyploid
species, the ratio of the homozygous genotypes should be used as the marker-index. In
order to identify the high-quality markers effectively in Step Two, both of the parents
should be resequenced. Theoretically, the number of plants needed and the expected depth
of sequencing are similar to that in the diploid species. Because the heterozygous mutants
of the polyploid species contain several kinds of genotypes, it is difficult to clone them
by this method and GWAS is the better choice. Thus, the SBM can be used to clone the
homologous mutants of the polyploid species with some modification, as long as they have
abundant genomic information. Because most of the crops have been de novo sequenced
and their genomic information is abundant, this method will benefit the research of the
crops. In the species without abundant genomic sequences, this method may be restricted
and the de novo sequencing should be done first.
Besides, because of hybrid sterility, the F1 and F2 generations hybridized between
many rice varieties have a certain abortion rate, which interferes with the separation
of rice heterozygous mutants from the wild type in F2 generation plants. Therefore,
heterozygous mutants of rice can only be hybridized with the varieties closely related
to the mutants. However, it is difficult to screen enough molecular markers to clone the
target genes using the conventional map-based cloning method. Most of these mutated
genes in rice heterozygous mutants are essential for the formation or development of rice
seeds. Therefore, the SBM can be used to clone many heterozygous genes, to study the
phenotypic characteristics of heterozygous mutants, and to dissect the molecular regulated
mechanisms in the formation and development of rice seeds, which would provide a firm
foundation for the improvement of rice varieties.
4. Materials and Methods
4.1. Plant Materials
Arabidopsis thaliana ecotype Columbia (Col), Landsberg erecta (Ler) and the mutant
275-3 (the background was Col) were grown in the greenhouse of Wuhan University at
22 ± 2 ◦ C under a 16 h light/8 h dark photoperiod. The mutant 275-3 was obtained from
the Arabidopsis Biological Resource Center (http://abrc.osu.edu/; accessed on 7 June 2021).
The rice mutant ygs (yellow-green seedling) and abs (abnormal seedling), obtained from
RISD DB (Rice T-DNA Insertion Sequence Database), wild-type varieties (Oryza sativa L. ssp.
Japonica, cultivar ‘Hwayoung’, HY; cultivar ‘Zhonghua110 , ZH11) were grown in natural
environment conditions or in the greenhouse at 28 ± 2 ◦ C under a 14 h light/10 h dark
photoperiod at Wuhan University. Plant phenotypic features were photographed using a
digital camera (Nicon D5000 and Micro NIKKOR 60 mm, Japan).
4.2. Ovule Clearing
Fresh ovules of Col and the mutant 275-3 were isolated from siliques using forceps
and soaked in the Hoyer’s solution (chloral hydrate: glycerol: water= 8:1:2 (w/v/v)) forInt. J. Mol. Sci. 2021, 22, 6224 15 of 18
5—30 min (ovules at globular stage) or 1–2 h (ovules at heart and torpedo stages) [32].
Then, the cleared ovules were observed and photographed with differential interference
contrast microscopy (Olympus TH4-200 equipped with a CCD of a SPOT digital micro-
scope camera).
4.3. Observation of Endosperm Phenotype
The fresh siliques were dissected and transferred into the fixative (4% glutaraldehyde
in PBS, pH 7.0), vacuumed until all siliques were sunk in the fixative, and fixed overnight
at room temperature after siliques were placed into fresh fixative. Next, the samples were
dehydrated by a series of graded alcohols (15%, 30%, 50%, 70%, 90% and 100%) and rehy-
drated by graded alcohols (90%, 70%, 50%, 30%, 15% and 0%) for 20 min for each gradient,
Then, the ovules were separated and mounted onto the slides with Hoyer’s solution until
the samples were cleared. Finally, the embryos and endosperms in transparent ovules were
observed using a confocal laser scanning microscope (Olympus FluoView FV1000) with
488 nm excitation [33].
4.4. DNA Extraction
A suitable amount of fresh leaves (about 0.2 g) of Arabidopsis thaliana and rice were
ground and crushed with the help of liquid nitrogen. Then, the powders were respectively
digested in 700 mL 65 ◦ C CTAB extraction solution (2% CTAB, 2% PVP-40, 1.42 M NaCl,
20 mM EDTA, 0.2% β-mercaptoethanol, 10 mM Tris-HCl) for half an hour, and centrifuged
at 12,000 rpm for 5 min to get the supernatant. The reagent 570 mL chloroform: isoamyl
alcohol (volume ratio: 24:1) was added in the supernatant, shaken violently, and centrifuged
at 12,000 rpm for 10 min to purify their DNA (the supernatant). The supernatant was
purified again using 570 mL chloroform: isoamyl alcohol (volume ratio: 24:1) and then
was transferred into a new EP tube, equal volume of isopropanol was added, and stored
at −20 ◦ C for 30 min. Then, the mixture was centrifuged at 12,000 rpm for 5 min, and the
supernatant was discarded and 500 mL 75% alcohol was added to remove the residual
isopropanol. Finally, the mixture was centrifuged at 12,000 rpm for 2 min and put in
37 ◦ C for 10 min to remove alcohol, and 50 µL of ddH2 O containing RNase was added to
dissolve the DNA. The DNA extracted by this method had high purity and could be used
for genome resequencing and sequencing-based mapping.
4.5. Whole-Genome Sequencing and Data Analysis
The heterozygous mutant 275-3 was crossed with Ler to obtain F1 generation that
exhibited the same phenotypes as 275-3, and the F1 generation was backcrossed with Ler
three times to get the BC3 F1 population that was used for the whole-genome sequencing.
Meanwhile, rice homologous mutants were crossed with ZH11 to get the F2 population
that was used for the whole-genome sequencing. The Ler and ZH11 were also resequenced
as the control, and the leaves from the sequencing population were collected to extract
DNA as described above. The DNA quality of the samples was detected by the ultravio-
let spectrophotometer NanoDrop2000 (Thermo, USA) to ensure that OD260 /OD280 ≥ 1.8,
OD260 /OD230 ≥ 2.0, and DNA concentration ≥ 100 ng/µL. The 1% agarose gel elec-
trophoresis was used to ensure that the genome did not degrade. Then, equal amounts of
DNA for every sample (more than 30 samples for mutants and 20 samples for WT) were
mixed (5–10 µg) and wer resequenced using the second-generation sequencing technology
on the Illumina sequencing platform in Wuhan Seqhealth Co., Ltd. except for sample ZH11
that was sequenced in the Shanghai Oebiotech Corporation.
Using Trimmomatic software, the raw data obtained by the Illumina sequencing platform
was analyzed to obtain high-quality sequencing reads (the clean reads, more than 95% of whose
nucleotide sequences had Q-score of 30) by removing reads containing the adapter, reads
containing ploy-n and low-quality reads. Then, the clean reads of Ler and the mutant 275-3
were mapped on the Arabidopsis reference genome (https://www.arabidopsis.org/download/
index-auto.jsp?dir=%2Fdownload_files%2FGenes%2FTAIR10_genome_release; accessed onInt. J. Mol. Sci. 2021, 22, 6224 16 of 18
7 June 2021), while the clean reads of HY, ZH11 and rice mutants were mapped on the rice ref-
erence genome (MSU Rice Genome Annotation Release 7, http://rice.plantbiology.msu.edu/
pub/data/Eukaryotic_Projects/o_sativa/annotation_dbs/pseudomolecules/version_7.0/all.
dir/all.con; accessed on 7 June 2021) using BWA software. Using GATK software, SNP
(single nucleotide polymorphism), InDel, structural variations (SV, mainly insertion and
deletion of large fragments), and copy number variations (CNV) of the experimental
samples were identified, and their numbers in different pools were calculated. Then, the
marker indexes (allele-ratio) of SNP and InDel markers were calculated using the formula:
marker-index = alt-number/(alt-number + ref-number) (alt-number indicated the number
of the reads that contained the allele different from the reference genome, ref-number
indicated the number of the reads that contained the same allele of the reference genome),
and the markers with more than 8 supported-reads were used for the later analysis. Us-
ing the MutMap method described by Abe, the ∆indexes of all markers were calculated
and analyzed [7]. The average distributions of the ∆marker indexes were calculated and
plotted by using the sliding window approach with a 100 Kb window size and 20 kb
sliding step except rice mutant abs which used the sliding window approach with a 500 Kb
window size and 100 kb sliding step. Meanwhile, the G value was calculated using the
formula G = 2 ∑4i=1 ni ln n̂ni , n̂i = (n1 × n2 )(n1 × n3 ) ÷ (n1 × n2 × n3 × n4 ), and n1 , n2 ,
i
n3 and n4 were the supported read numbers of the two alleles in two samples. The top
0.1% of G values were considered as the sites significantly linked to the phenotype of rice
mutant ygs [34].
4.6. Identification and Analysis of Mapping Markers
To clone the mutated gene in Arabidopsis mutant 275-3, the primers of SSLP (simple
sequence length polymorphism) markers were downloaded from TAIR database (The Ara-
bidopsis Information Resource, https://www.arabidopsis.org/servlets/mapper; accessed
on 7 June 2021). Some SSLP markers were verified by the whole-genome sequencing data
and were chosen for mapping if there was an insertion or a deletion of more than 5 bp at
the sites (for the size difference of more than 5bp could be separated by the 4% agarose
electrophoresis). Some primers of rice SSR (simple sequence repeat) were downloaded from
Gramene database (http://www.gramene.org/; accessed on 7 June 2021), and confirmed
by the whole-genome sequencing data with the same threshold in Arabidopsis. The others
were designed by the software Primer premier 6 around the InDel markers (with insertion
or deletion of more than 5 bp) identified from the whole-genome sequencing data. The
PCR (Polymerase Chain Reaction) products of the mapping population were detected by
the 4% agarose electrophoresis and the marker indexes (the rate of the Col genotypes or
HY genotypes) were calculated to identify the markers that linked to the mutational site.
Furthermore, the distributions of recombinants at these phenotype-linked markers were
analyzed to narrow the candidate region, as the number of recombinants should be less
when the marker was closer to the mutational site and the recombinants at the markers
on different sides of the mutated site should be different. Finally, using the resequencing
genome data, the mutational site in the target region was identified.
4.7. Plasmids Construction and Genetic Transformation
To verify the function of OsABS (LOC_Os12g09000), the genomic sequence of LOC_
Os12g09000 was cloned and inserted into the pCAMBIA1300 vectors. The vector was
introduced into Agrobacterium tumefaciens strain EHA105 and transformed into callus of
rice mutant abs [35].
4.8. Primers
The primers used in this study are listed in Table S5.You can also read